It looks like you're using an Ad Blocker.
Please white-list or disable AboveTopSecret.com in your ad-blocking tool.
Thank you.
Some features of ATS will be disabled while you continue to use an ad-blocker.

Storms
page: 110
share:
Major storms have always been a part of earth's climate system. While in the distant past the planet has experienced hemisphere-wide storm phenomena that would dwarf today's even most powerful tropical cyclones by orders of magnitude, climate conditions throughout the current intergalcial are ideal to make these storms a common occurrence. Only a few other climate events can have as much impact as single hurricane or typhoon and rarely a tropical cyclone season goes by without at least one high category storm making landfall in some part of the world.
Tropical cyclone
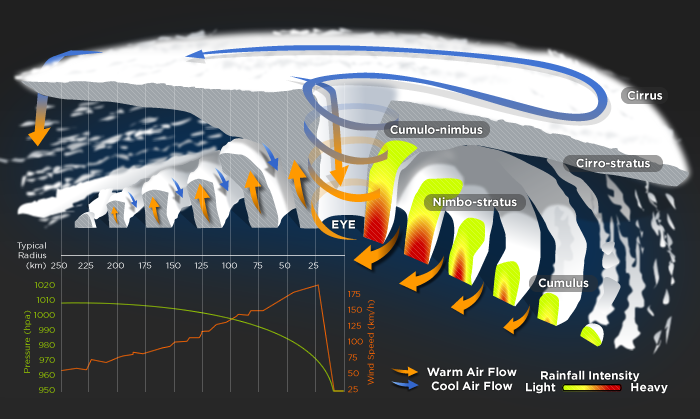
A tropical cyclone is a rapidly-rotating storm system characterized by a low-pressure center, strong winds, and a spiral arrangement of thunderstorms that produce heavy rain. Tropical cyclones typically form over large bodies of relatively warm water. They derive their energy from the evaporation of water from the ocean surface, which ultimately recondenses into clouds and rain when moist air rises and cools to saturation.
This energy source differs from that of mid-latitude cyclonic storms, such as nor'easters and European windstorms, which are fueled primarily by horizontal temperature contrasts. The strong rotating winds of a tropical cyclone are a result of the (partial) conservation of angular momentum imparted by the Earth's rotation as air flows inwards toward the axis of rotation. As a result, they rarely form within 5° of the equator. Tropical cyclones are typically between 100 and 4,000 km (62 and 2,500 mi) in diameter.
The term "tropical" refers to the geographical origin of these systems, which usually form over the tropical oceans. The term "cyclone" refers to their cyclonic nature, with wind blowing counterclockwise in the Northern Hemisphere and clockwise in the Southern Hemisphere. The opposite direction of circulation is due to the Coriolis force.
Depending on its location and strength, a tropical cyclone is referred to by names such as hurricane (/ˈhʌrɨkeɪn/ or /ˈhʌrɨkən/), typhoon /taɪˈfuːn/, tropical storm, cyclonic storm, tropical depression, and simply cyclone.
_____________________________________________________________________________________
Storm Chasers
A worldwide storm-tracking and monitoring system was made possible with dawn of the satellite era and near global coverage was achieved in the early 1970's. Since then, every aspect of global (or tropical) cyclone activity has been observed, measured and analysed in unprecedented detail, which has led to the creation of a variety of universally accepted climate indices for worldwide storminess.
The two main indices measuring cyclone activity on a global/hemispheric-scale and for each ocean basin seperately are the Global Tropical Storm and Hurricane Frequency Index and the Global/Total Accumulated Cyclone Energy Index.
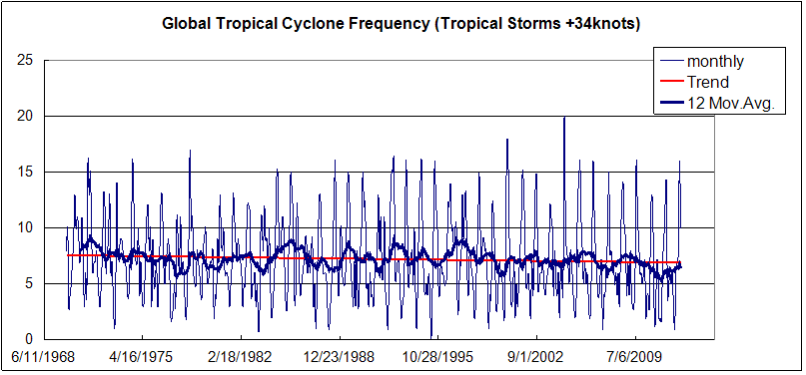
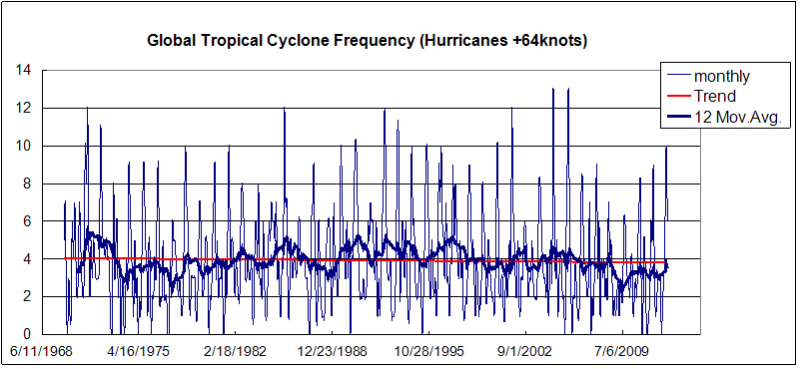
The Frequency Index is basically a simple count for all tropical storm systems above the lowest/first category (sustained maximum lifetime wind-speeds of +34 knots) and is divided into three main categories - tropical storms, hurricanes (+64 knots) and major hurricanes (+96 knots). The index covers the entire period of continuous satellite observation since 1970, data is available for the Globe, both hemispheres and the three main ocean basins.
The ACE is a composite index where the sum of accumulated energy (strength/intensity/duration) for each individual storm within a season is added together and a short/long term average of total storm energy can be calculated and analysed. The ACE also starts in 1970 and data is available for the same sub-sets (Pacific, Atlantic, Indian ocean).
___________________________________________________________________________
More,less or extremely normal?
Media coverage of extreme weather events has increased exponentially in recent years and everytime after a major tropical cyclone has made landfall somewhere with often catastrophic results for the people and the region affected, the question arises as to whether or not there has also been an increase in overall storminess or if extreme storms are getting more severe and more frequent.
A lot of people would believe or are convinced that the answer is yes. But if there has been no detectable change in overall storm activity or intensity then the question remains if any perceived increase is simply an artifact of the flood of news reports and more media hype or if the question and therefore the answer is generally more complex.
As to whether or not there has been an overall increase in tropical storm and major tropical cyclone frequency, the answer is relatively simple. If anything, the number of storms and major storms as decreased slightly over the entire 40 plus year period of satellite observations, but since the trend is not yet significant the average number of storms/cyclones remains practically unchanged.
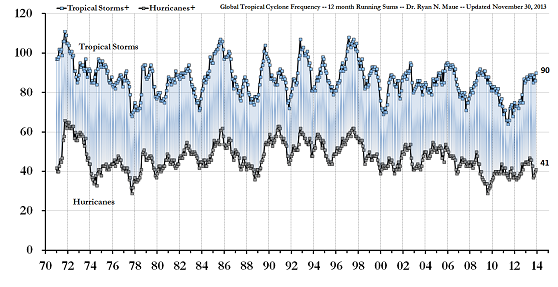
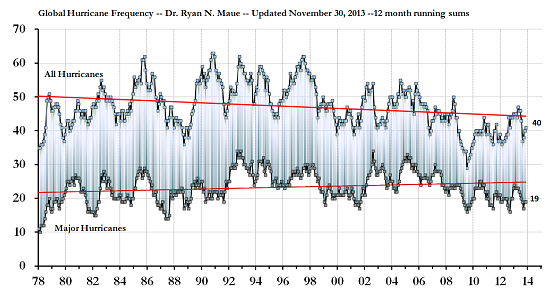
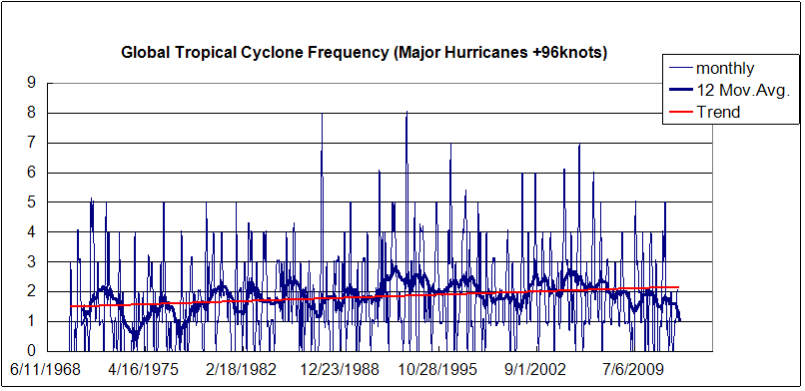
When broken down into the three main categories - tropical storms, hurricanes and major hurricanes - the individual trends become more clearly visible.
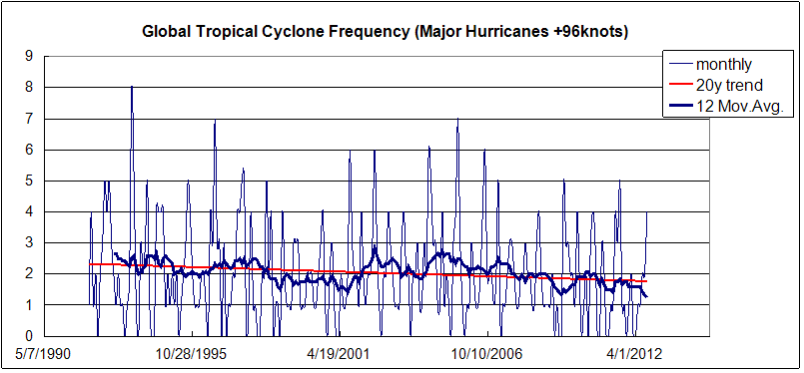
The average number of tropical storms and hurricanes has remained unchanged. The number of the strongest hurricanes/typhoons (category 3+) has increased slightly over the first half of the period with peaks in the mid 90's (peak season 1993) and after a plateau lasting until the early 2000's with another peak in the 2004/5 season, the number has decreased again to a long term low in the last 3 seasons.
Data source
The Global Hurricane Frequency Index can only provide a very basic overview, it's a metric to determine the quantity of worldwide storm occurrence. It is essentially a storm counter with three main categories (all/strong/strongest).
>>>
edit on 3-12-2013 by talklikeapirat because: inHg
>>>
Has the intensity of tropical cyclones that did occur increased/decreased over the last 40 years?
The ACE-index is the first and most important metric to measure this aspect of global(tropical) storm activity.
 Last 4-decades of Global and Northern Hemisphere Accumulated Cyclone Energy: 24 month running sums. Note that the year
indicated represents the value of ACE through the previous 24-months for the Northern Hemisphere (bottom line/gray boxes) and the entire global (top
line/blue boxes). The area in between represents the Southern Hemisphere total ACE.
Last 4-decades of Global and Northern Hemisphere Accumulated Cyclone Energy: 24 month running sums. Note that the year
indicated represents the value of ACE through the previous 24-months for the Northern Hemisphere (bottom line/gray boxes) and the entire global (top
line/blue boxes). The area in between represents the Southern Hemisphere total ACE.
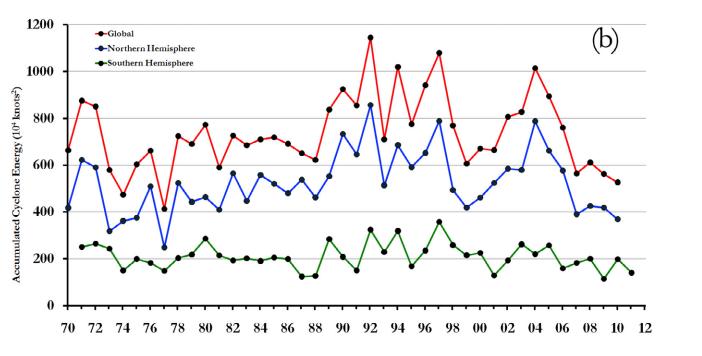 Same as above. Annual totals of global TC ACE (calendar year totals; red boxes), NH TC ACE (calendar year; blue boxes),
and SH TC ACE
Same as above. Annual totals of global TC ACE (calendar year totals; red boxes), NH TC ACE (calendar year; blue boxes),
and SH TC ACE
Since the ACE is essentially a quality measurement it can provide direct evidence for any change in strength/intensity proportional to the number of occurring storms. In a nutshell, if the accumulated cyclone energy has increased while the number of storms has not or vice versa, it directly indicates that storms within this period were more/less intense.
The second case (more hurricanes and major hurricanes/typhoons worldwide, but less accumulated energy) occured during a brief period in the late 1980s. The 1985/86/87 seasons were above average seasons for the number of major stroms while there has been only a slight increase in ACE.
Conversely, in the 2004/5/6 seasons the average number of strong and major cyclones on global scale has only increased slightly or not as much as in any of the previous above average (peak) seasons, but the ACE for this season ranks as the third highest (2005 highest Atlantic hurricane season for both frequency and intensity).
The last point highlights a crucial issue with global averages for any climate parameter. While it is true that in the 2005 hurricane season the worldwide average number of storms was only slightly above normal, it was the highest ranking season in the North Atlantic in all categories.
The utility of both indices is limited to an general overview and first analysis approach, the more specific aspects cannot be determined by a global-scale metric.
________________________________________________________________________________
Storms recently
______________________________________________________________________
Summing up
Global tropical storm frequency has not increased in the last 40-50 years in all categories, beyond seasonal and interseasonal variability tropical storm activity has reached a near long term low in all ocean basins (record low in the Southern Hemisphere) over the last 10 years.
Global tropical storm intensity has varied strongly over the entire 40 year period of satellite observations, for the first time in history the length of the observational record allows a breakdown into active and inactive periods. After the peak in 2005 global tropical cyclone ACE has decreased to the lowest levels since the late 1970s.
There is no systematic upward or downward trend in global tropical storm frequency and intensity, the media hype on the other hand ...
weatherbell.com
NOAA Tropical Cyclone Climatology
NOAA Hurricane Center
ACE Index
(Wiki not up to date, the ACE is now a global-scale index including all storms/all ocean basins)
Global Tropical Cyclone Activity Update
follow up post in next few days
Has the intensity of tropical cyclones that did occur increased/decreased over the last 40 years?
The ACE-index is the first and most important metric to measure this aspect of global(tropical) storm activity.
Since the ACE is essentially a quality measurement it can provide direct evidence for any change in strength/intensity proportional to the number of occurring storms. In a nutshell, if the accumulated cyclone energy has increased while the number of storms has not or vice versa, it directly indicates that storms within this period were more/less intense.
The second case (more hurricanes and major hurricanes/typhoons worldwide, but less accumulated energy) occured during a brief period in the late 1980s. The 1985/86/87 seasons were above average seasons for the number of major stroms while there has been only a slight increase in ACE.
Conversely, in the 2004/5/6 seasons the average number of strong and major cyclones on global scale has only increased slightly or not as much as in any of the previous above average (peak) seasons, but the ACE for this season ranks as the third highest (2005 highest Atlantic hurricane season for both frequency and intensity).
The last point highlights a crucial issue with global averages for any climate parameter. While it is true that in the 2005 hurricane season the worldwide average number of storms was only slightly above normal, it was the highest ranking season in the North Atlantic in all categories.
The utility of both indices is limited to an general overview and first analysis approach, the more specific aspects cannot be determined by a global-scale metric.
________________________________________________________________________________
Storms recently
Recent historically low global tropical cyclone activity
Tropical cyclone accumulated cyclone energy (ACE) has exhibited strikingly large global interannual variability during the past 40‐years. In the pentad since 2006, Northern Hemisphere and global tropical cyclone ACE has decreased dramatically to the lowest levels since the late 1970s. Additionally, the global frequency of tropical cyclones has reached a historical low.
Here evidence is presented demonstrating that considerable variability in tropical cyclone ACE is associated with the evolution of the character of observed large‐scale climate mechanisms including the El Niño Southern Oscillation and Pacific Decadal Oscillation. In contrast to record quiet North Pacific tropical cyclone activity in 2010, the North Atlantic basin remained very active by contributing almost one‐third of the overall calendar year global ACE.
During the past four decades, integrated and secular frequency measures of global tropical cyclone (TC) activity have undergone considerable interannual variability. Since 2006, global and Northern Hemisphere (NH) TC accumulated cyclone energy (ACE) has decreased dramatically, nearly cut in half from the previous peak in 2005 to the lowest levels since the 1970s.
While the annual global frequency of tropical storm TCs has not exhibited a long‐term trend (∼87 per year), the calendar year total of 69 observed in 2010 represented a decades’ low. Indeed while the veryactive North Atlantic (NATL) basin generated 19 named storms in 2010, the rest of the global tropics produced only 50 TCs including the fewest Western North Pacific (WNP) typhoons and Northeast Pacific (NEP) hurricanes counted in the reliable historical record.
______________________________________________________________________
Summing up
Global tropical storm frequency has not increased in the last 40-50 years in all categories, beyond seasonal and interseasonal variability tropical storm activity has reached a near long term low in all ocean basins (record low in the Southern Hemisphere) over the last 10 years.
Global tropical storm intensity has varied strongly over the entire 40 year period of satellite observations, for the first time in history the length of the observational record allows a breakdown into active and inactive periods. After the peak in 2005 global tropical cyclone ACE has decreased to the lowest levels since the late 1970s.
There is no systematic upward or downward trend in global tropical storm frequency and intensity, the media hype on the other hand ...
weatherbell.com
NOAA Tropical Cyclone Climatology
NOAA Hurricane Center
ACE Index
(Wiki not up to date, the ACE is now a global-scale index including all storms/all ocean basins)
Global Tropical Cyclone Activity Update
follow up post in next few days
If it bleeds, it leads. And with more people living in harms way than before, there is a lot more bleeding than there used to be.
Very well thought out thread and presentation.
I enjoyed reading it. Thank you for putting this together!
I enjoyed reading it. Thank you for putting this together!
talklikeapirat
>>>
There is no systematic upward or downward trend in global tropical storm frequency and intensity, the media hype on the other hand ...
weatherbell.com
NOAA Tropical Cyclone Climatology
NOAA Hurricane Center
ACE Index
(Wiki not up to date, the ACE is now a global-scale index including all storms/all ocean basins)
Global Tropical Cyclone Activity Update
follow up post in next few days

Fantastic thread and presentation talklikeapirat.
This needs to reach more people.
They say "The truth will out" - whoever said that originally must have been a media puppet, as we know this saying is a lye in itself!
edit on 3-12-2013 by GezinhoKiko because: (no reason given)
Media has always hyped up any and everything it can to sell a story. It's been going on since its inception. they work the other way too,
exaggerating how good things are, or how economic conditions have improved, when anecdotal evidence shows otherwise.
I know here in Australia we have seen more unusual weather events in recent years. No media hype necessary.
I know here in Australia we have seen more unusual weather events in recent years. No media hype necessary.
Thank you all for your replies. If you found it informative, then my job is done.
reply to post by ketsuko
Interesting way to put it, but you're right. There are now many more people living in areas prone to major strom activity, but these storms are not earthquakes, the track record of modern early warning systems is 100%. It's not easy to reconcile this with the fact that far too many people loose their lifes when another superstrom hits. I hope i'll still live to see the day when a major hurricane makes landfall in densely populated area and the death toll is zero.
reply to post by eriktheawful
Thanks Erik. Coming from you means a lot. I still enjoy reading your Orion-thread.
reply to post by ABNARTY
Thanks ABNARTY. Glad you liked the graphic and good to know it worked.
reply to post by GezinhoKiko
Thanks GezinhoKiko. There are many items on the left side of that chart people should know more about, but to be frank, i often wish mainstream media would stop reporting about 'hot-button issues' en masse and focus on quality journalism again.
reply to post by surrealist
I tried to imagine what you could mean by 'unusual weather events'. Could you expand on that?
talklikeapirat
reply to post by surrealist
I tried to imagine what you could mean by 'unusual weather events'. Could you expand on that?
Sure, I'm glad you picked up on the point about 'unusual' as that doesn't necessarily mean severity though I could cite a couple of events that have shown this in recent years. The thing is, you are speaking specifically about cyclones whereas I am referring to all different types of weather phenomena so we might be debating apples and oranges. Happy to share but it is not really relevant to this thread, but I do contend that while media hype stuff up, I don't think that negates what is quite apparent changing climate conditions including unusual and severe weather events, even if cyclone activity has remained steady over recent decades.
new topics
-
Egypt to join South Africa genocide case at ICJ
Middle East Issues: 2 hours ago -
Kingdom of the Planet of the Apes
Movies: 5 hours ago -
Jean Michel and Brian May Live from Bratislava
General Chit Chat: 10 hours ago -
Iranian Lawmaker Declares Iran Has Nuclear Weapons
Mainstream News: 11 hours ago
top topics
-
Trump Record Breaking Campaign Rally 5/11 in New Jersey Draws 100,000 People
2024 Elections: 14 hours ago, 14 flags -
Biden Withholding Sensitive US Intelligence on Hamas Leaders From Israel
US Political Madness: 14 hours ago, 10 flags -
Anybody else go to the movie theater a lot? Have you noticed how dead they are?
General Chit Chat: 14 hours ago, 7 flags -
something falls in Canada
Aliens and UFOs: 14 hours ago, 5 flags -
Iranian Lawmaker Declares Iran Has Nuclear Weapons
Mainstream News: 11 hours ago, 5 flags -
Jean Michel and Brian May Live from Bratislava
General Chit Chat: 10 hours ago, 5 flags -
US mistakes in assessing the military potential of China and Russia
ATS Skunk Works: 17 hours ago, 4 flags -
Egypt to join South Africa genocide case at ICJ
Middle East Issues: 2 hours ago, 2 flags -
Kingdom of the Planet of the Apes
Movies: 5 hours ago, 1 flags
active topics
-
Anybody else go to the movie theater a lot? Have you noticed how dead they are?
General Chit Chat • 20 • : 777Vader -
Is there a dependence on the number of children in the family and its well-being?
New World Order • 44 • : chr0naut -
Egypt to join South Africa genocide case at ICJ
Middle East Issues • 12 • : CriticalStinker -
-@TH3WH17ERABB17- -Q- ---TIME TO SHOW THE WORLD--- -Part- --44--
Dissecting Disinformation • 955 • : brewtiger123 -
Bibi’s Dilemma
Middle East Issues • 269 • : jofafot -
Kingdom of the Planet of the Apes
Movies • 12 • : chr0naut -
Biden Withholding Sensitive US Intelligence on Hamas Leaders From Israel
US Political Madness • 52 • : 777Vader -
REAL ID now a reality
General Conspiracies • 51 • : TheMisguidedAngel -
A new Why Files How CRISPR and AI Destroy the World
Science & Technology • 19 • : charlest2 -
President Bidens Health is Declining Faster 5.8.2024 - He Should Stay Home.
2024 Elections • 50 • : doubledan717
10