It looks like you're using an Ad Blocker.
Please white-list or disable AboveTopSecret.com in your ad-blocking tool.
Thank you.
Some features of ATS will be disabled while you continue to use an ad-blocker.

LISS off the charts?
page: 14
share:
Could anyone explain why all of these seismic readings are pretty much off the charts?
I tend to notice it when there is more solar/meteor activity, However those are low today.
And all the readings are very high.
earthquake.usgs.gov...
i1359.photobucket.com...
i1359.photobucket.com...
s1359.beta.photobucket.com... - Russia
What's going on? This has happened before but then it went down to normal readings. Are they increasing the reading size every time this happens?
Originally posted by JrDavis
And all the readings are very high.
What's going on? This has happened before but then it went down to normal readings. Are they increasing the reading size every time this happens?
The readings were high at 12:00 Noon on many of the graphs.
Looks like mother Gaia is getting ready to show whos boss and crush the old world order with a world earthquake.
I show 11 quakes on my USGS feed dated 12/07 and running Mag 5 or above. It's been a busy day.
This is the chart for the Seismic sensor group at Binghamton, New York but it doesn't matter much... My USGS heliplots look the same, no matter where one pulls a tape from. It's been a wild day.
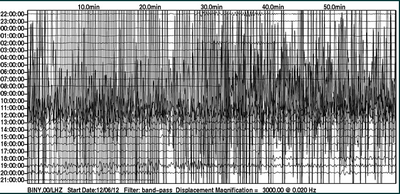
This is the chart for the Seismic sensor group at Binghamton, New York but it doesn't matter much... My USGS heliplots look the same, no matter where one pulls a tape from. It's been a wild day.
edit on 7-12-2012 by Wrabbit2000 because: (no reason given)
reply to post by Wrabbit2000
So what we are seeing is in fact increased seismic activity???
I was a believer it could be related to Solar activity and Meteors but those seem the norm.
What could cause such seismic activity across the globe?
Thank you for your response.
So what we are seeing is in fact increased seismic activity???
I was a believer it could be related to Solar activity and Meteors but those seem the norm.
What could cause such seismic activity across the globe?
Thank you for your response.
Originally posted by JrDavis
Could anyone explain why all of these seismic readings are pretty much off the charts?
They are all overloaded after picking up the big Japanese earthquake.
And yes, this is a serious answer.
As a seismometer owner, I can assure you that an earthquake of this magnitude gets a HUGE signal on every seismometer all around the world. (except for mine because it was switched off)
And yes, the shock wave echos for a number of hours, helped along by the aftershocks on that earthquake.
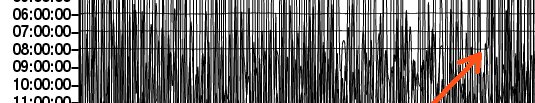
Take a random example, this one, and see that the signal is flat until shortly after the earthquake (08:18 UTC)...
edit on 7-12-2012 by alfa1 because: (no reason given)
This is rather odd, I operate a weather station over last 5 years, and when the earthquakes happened the pressure went up quite high, not seen so a
fast increase in pressure ever before, it went from 998.2 up to 1014.1 that was within 2 hours today.
reply to post by alfa1
So what we are seeing is the earth shaking due to the 7.3 in Japan today?
Why do we not feel this vibration? I mean I personally haven't but maybe others have?
So what we are seeing is the earth shaking due to the 7.3 in Japan today?
Why do we not feel this vibration? I mean I personally haven't but maybe others have?
Originally posted by JrDavis
reply to post by alfa1
So what we are seeing is the earth shaking due to the 7.3 in Japan today?
Why do we not feel this vibration? I mean I personally haven't but maybe others have?
Yes. Seismographs all over the world registered it. We don't feel it because seismographs are very sensitive instruments.
www.abovetopsecret.com...
Originally posted by JrDavis
So what we are seeing is the earth shaking due to the 7.3 in Japan today?
Why do we not feel this vibration?
The vibration exists, and is rather small, but can be calculated.
This page is such a calculator.
As a test, I plugged in the coordinates of London, and this is the result obtained for that big earthquake near Japan...
DATE-(UTC)-TIME LAT LON DEPTH MAG Q COMMENTS 2012/12/07 08:18:24 37.89N 144.09E 36.1 7.3 US: OFF EAST COAST OF HONSHU
Expected 20s period surface wave amplitude [ 1.38E+02 µm] [ 4.33E+01 µm/s]
Expected 1s period body wave amplitude [ 3.50E+00 µm] [ 2.20E+01 µm/s]
As you see, the amount of "shaking" felt in London would be in the micrometer scale, and the speed of the earth movement in micrometers per second.
Extremely tiny, measureable by sensitive equipment, but humans wont notice.
edit on 7-12-2012 by alfa1 because: (no reason given)
Originally posted by JrDavis
reply to post by Wrabbit2000
So what we are seeing is in fact increased seismic activity???
I was a believer it could be related to Solar activity and Meteors but those seem the norm.
What could cause such seismic activity across the globe?
Thank you for your response.
What we are seeing by the chart I posted isn't an increase in overall activity.... Today has had two MAJOR quakes in the world. One off the coast of Japan above 7 and another in New Zealand. This is a screen shot from the USGS feed on one of my sites.
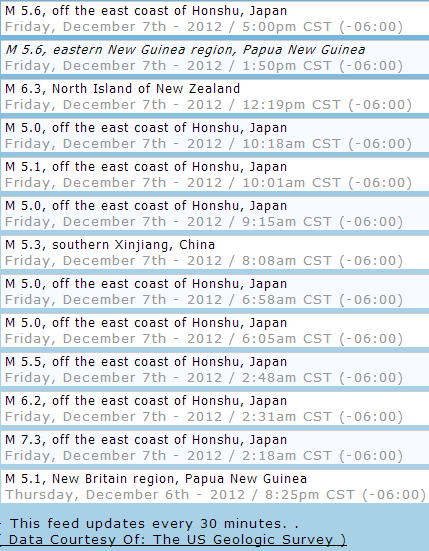
Like I said, it has been a busy day...but much of that is after shocks. To be realistic. 2 notable events happened and the rest is background noise. Japan and NZ. Thats not common...on the same day..but hardly rare either. Nothing to worry about in it's own right, IMO.
edit on 7-12-2012
by Wrabbit2000 because: minor change to show IN ..not off the coast of NZ
I hate to bring up an older thread, especially on a day where most people will think this has something to do with a cover up, but would there be any
explanation as to why a LOT of LISS Stations are down right now?
new topics
-
Mike Pinder The Moody Blues R.I.P.
Music: 29 minutes ago -
Putin, Russia and the Great Architects of the Universe
ATS Skunk Works: 3 hours ago -
A Warning to America: 25 Ways the US is Being Destroyed
New World Order: 7 hours ago
top topics
-
President BIDEN's FBI Raided Donald Trump's Florida Home for OBAMA-NORTH KOREA Documents.
Political Conspiracies: 13 hours ago, 31 flags -
A Warning to America: 25 Ways the US is Being Destroyed
New World Order: 7 hours ago, 13 flags -
Is AI Better Than the Hollywood Elite?
Movies: 15 hours ago, 4 flags -
Mike Pinder The Moody Blues R.I.P.
Music: 29 minutes ago, 2 flags -
Maestro Benedetto
Literature: 15 hours ago, 1 flags -
Putin, Russia and the Great Architects of the Universe
ATS Skunk Works: 3 hours ago, 1 flags
active topics
-
Putin, Russia and the Great Architects of the Universe
ATS Skunk Works • 12 • : RussianTroll -
Truth Social goes public, be careful not to lose your money
Mainstream News • 132 • : matafuchs -
New whistleblower Jason Sands speaks on Twitter Spaces last night.
Aliens and UFOs • 67 • : Ophiuchus1 -
Gaza Terrorists Attack US Humanitarian Pier During Construction
Middle East Issues • 57 • : ToneD -
Mike Pinder The Moody Blues R.I.P.
Music • 1 • : RussianTroll -
Mood Music Part VI
Music • 3106 • : TheWoker -
University of Texas Instantly Shuts Down Anti Israel Protests
Education and Media • 275 • : Vermilion -
President BIDEN's FBI Raided Donald Trump's Florida Home for OBAMA-NORTH KOREA Documents.
Political Conspiracies • 22 • : 320MPH -
A Warning to America: 25 Ways the US is Being Destroyed
New World Order • 19 • : Cvastar -
Alternate Electors vs Fake Electors - What is the Difference.
2024 Elections • 118 • : Threadbarer
4