It looks like you're using an Ad Blocker.
Please white-list or disable AboveTopSecret.com in your ad-blocking tool.
Thank you.
Some features of ATS will be disabled while you continue to use an ad-blocker.

ATS Members Guide to Modern Presidents
page: 1share:
Good Morning, fellow members. I am starting this thread as a place to gather and display the basic facts of the modern Presidents. The media is
throwing numbers around left and right about the stats and often quoting stats as showing a pattern going back which isn't true as often as it is.
Research seems shaky and it's hard to expect everyone to have the time to really dig and get the good sources.
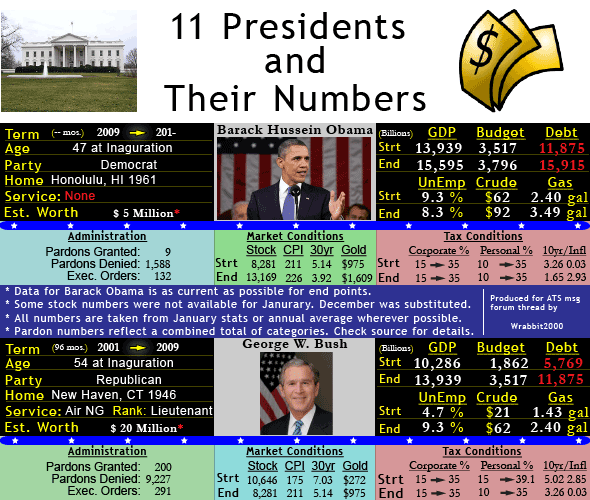
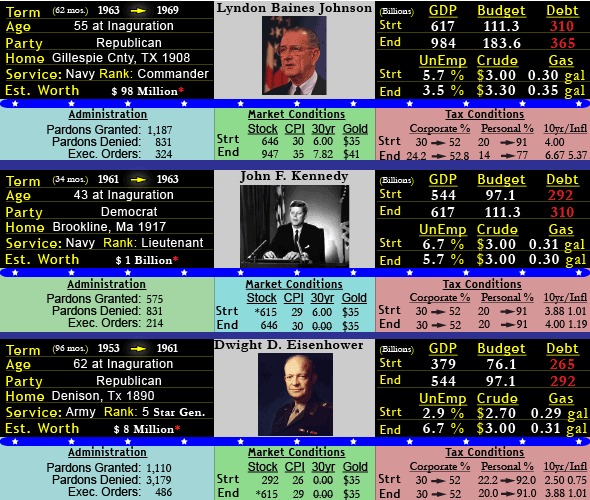
What I have put together here is a set of stats that cover our nation's President's from Pres. Eisenhower to Pres. Obama for a wide variety of things. In every case possible I have used primary sources. In as many cases as it's possible, I have used the agencies whose general purpose in life is collecting these very stats. In all numbers, I spent a very lengthy period going over and over to insure they were as accurate as possible. In more than one case, I deleted whole sections when a more accurate source with direct collection of the material came up.
What began as simply throwing some stats together for a reply on here became something more as even some of the basic stats seemed to be as much a matter of opinion as fact by how many different versions of a given number were presented around the net.
So I built this first for ATS members as a resource.
Second, as an addition to my portfolio as a College Graphics major and I needed the extensive time on the graphics software this supplied.
Finally, I created this as a tool for my Son when he gets a bit older and needs this information for his schooling. The message which follows this one contains the sourcing information for the data and where it all came from. It's all there for fact checking.
Please be kind...I've only been doing any form of graphics for a year or so. I'm learning as I go.
Over the coming days, I will be posting another thread on the Federal Budget. On this thread I plan to add another piece on Military events over these Presidents terms with the relevant stats which ATS members will want most. I also plan to add a small section on which documents of a personal or background nature each President has released and when. Please check back if those sound interesting.
*** These graphics are 100% created by myself and from a blank screen starting point. Every number is taken individually and from different sources. No opening Wiki to copy it all for me and the whole problem of the junk that seemed to give on some things is why I made it. With that in mind, I don't mind people using them but please drop me a note if so and a link to where it's being used. The Pictures of the Presidents came from their Library collections, respectively and are public domain by Government policy and law.
Any errors are purely my mistake despite much proof reading. I'll correct anything someone notices. Just let me know. Anyway, I hope this can be useful as a reference!
edit on 14-8-2012 by Wrabbit2000 because: Corrected Rank and Stats
Explanation of Some Headings:
Estimated Worth = ( Data is drawn from a 3rd party site)
GDP = Gross Domestic Product
Budget = Federal Budget (Does Not Include State Government Spending)
Debt = Gross Federal Debt
UnEmp = Unemployment Rate
Crude = Per Barrel Price
Gas = Regular Gasoline Pump Price Avg
Pardon = Pardons represent combined figures and the way the numbers were kept changed significantly over the years. Check the link for details and how the specifics break down.
Exec Orders = Executive Orders issued by the President during his term.
Stock = Dow Jones Average taken from January where possible
CPI= Consumer Price Index
30 Year = 30 Year Mortgage Rate
Gold = Market Rate per Troy Ounce
Taxes are as labeled for US Federal Income
Corp Taxes
Personal Taxes
10 Year = 10 Year Treasury Rate
Inf = Annual Inflation Rate
In some areas I referred to multiple sites as someone checking my links will notice some don't cover the full year ranges shown in my graphics. I have all the sources carefully stored away (I have to for the college end of using this for my portfolio) and can give all that relate to something if someone wants it. It would have tripled the length of the message or more though and beyond the purpose of useful as the list above ought to be. U2U for more, if seriously needing it for something though.
This looked like it took you some time. I commend your efforts. Better yet, it's also very useful. Thank you very much for this.
reply to post by Wrabbit2000
Excellent research and compilation of historical data in an easy to read format ....it certainly presents an interesting infograph.
I have a question though....when quoting net $values for gold, crude and gas - are these values indexed to express the true $cost as per CPI??
If not, these figures allude to an exponential increase in all of the above and may colour the information somewhat.
All the best with your continuing studies.
edit on 14-8-2012 by Perhaps because: typo
reply to post by Perhaps
I have both sets of numbers here for the commodity prices. I chose to use the actual dollars spent rather than adjusted dollars for inflation and today's value for two reasons.
First, I wanted to keep this as accurate and useful as a reference as possible. So, I kept to what a person actually living at that time would have seen on an average price index in the newspaper or paid at the gas station. That also strikes me as downright interesting for people in a trivia way that the adjusted dollars really miss.
Second, I struggled with the layout and design of the charts for quite some time in finding a balance of useful information and outright clutter. A couple sections had more information at one version of this or another...but just looked too 'busy' and messy. So I settled on using the actual $'s.
(I can add the other set in another post if it's of real interest?)
Originally posted by Wrabbit2000
reply to post by Perhaps
I have both sets of numbers here for the commodity prices. I chose to use the actual dollars spent rather than adjusted dollars for inflation and today's value for two reasons.
First, I wanted to keep this as accurate and useful as a reference as possible. So, I kept to what a person actually living at that time would have seen on an average price index in the newspaper or paid at the gas station. That also strikes me as downright interesting for people in a trivia way that the adjusted dollars really miss.
Second, I struggled with the layout and design of the charts for quite some time in finding a balance of useful information and outright clutter. A couple sections had more information at one version of this or another...but just looked too 'busy' and messy. So I settled on using the actual $'s.
(I can add the other set in another post if it's of real interest?)
Thanks for your explaination - I view it now the way you intended it to be.
On a side note, it's interesting to see how many recent POTUS' were ex Naval.
Cheers
Awesome thread. Those graphics you put together are very informative.
Definitely looking forward to the next one.
It's hard to believe gas was just $1.07 a gallon only 20 years ago.
Definitely looking forward to the next one.
It's hard to believe gas was just $1.07 a gallon only 20 years ago.
reply to post by watchitburn
Some of the numbers were amazing as I was putting them together. What I wouldn't give to have a time machine, a few thousand dollars with the right dates on them and then just a trip back to the 70's when I was born. Buying gold for what looked like a lot then would make a billionaire today. lol.... The little things of the differences are what struck me the most.
How long Crude stayed in reasonable ranges is interesting too. It took 2001 for much of this to go haywire. At least we see where we, as a nation, need to look back for the goal posts perhaps.
It seems only in Obama's period the Debt became finally bigger than the GDP and that means like many other countries that bankruptcy is sure, just a
matter of time.
Thomas Jefferson, (Attributed) 3rd president of US (1743 - 1826):
Khalil Gibran, (The Prophet, 1923 book), The Prophet:
Thomas Jefferson, (Attributed) 3rd president of US (1743 - 1826):
I believe that banking institutions are more dangerous to our liberties than standing armies. If the American people ever allow private banks to control the issue of their currency, first by inflation, then by deflation, the banks and corporations that will grow up around [the banks] will deprive the people of all property until their children wake-up homeless on the continent their fathers conquered. The issuing power should be taken from the banks and restored to the people, to whom it properly belongs.
Khalil Gibran, (The Prophet, 1923 book), The Prophet:
Woe to the nation that departs from religion to belief, from country lane to city alley, from wisdom to logic.
Woe to the nation that does not weave what it wears, nor plant what it eats, nor press the wine that it drinks.
Woe to the conquered nation that sees the victor's pomp as the perfection of virtue, and in whose eyes the ugliness of the conqueror is beauty.
Woe to the nation that combats injury in its dream but yields to the wrong in its wakefulness.
Woe to the nation that does not raise its voice save in a funeral, that shows esteem only at the grave, that waits to rebel until its neck is under the edge of the sword.
Woe to the nation whose politics is subtlety, whose philosophy is jugglery, whose industry is patching.
Woe to the nation that greets a conqueror with life and drum, then hisses him off to greet another conqueror with trumpet and song.
Woe to the nation whose sage is voiceless, whose champion is blind, whose advocate is prattler. Woe to the nation in which each tribe claims to be a nation.
reply to post by Wrabbit2000
I don't see honesty as a criterion.
Bush could keep the gas price low while planning to invade other countries.
He helped the war-machine and new job opportunities , didn't he ?
I don't see honesty as a criterion.
Bush could keep the gas price low while planning to invade other countries.
He helped the war-machine and new job opportunities , didn't he ?
I think the most interesting part of the charts is that while the economy has grown every year for each president, so too did the debt.
Not quite the economic growth they would have you believe is it?
Not quite the economic growth they would have you believe is it?
Very interesting list, I was scrolling up and down like a madman comparing all of the different categories...
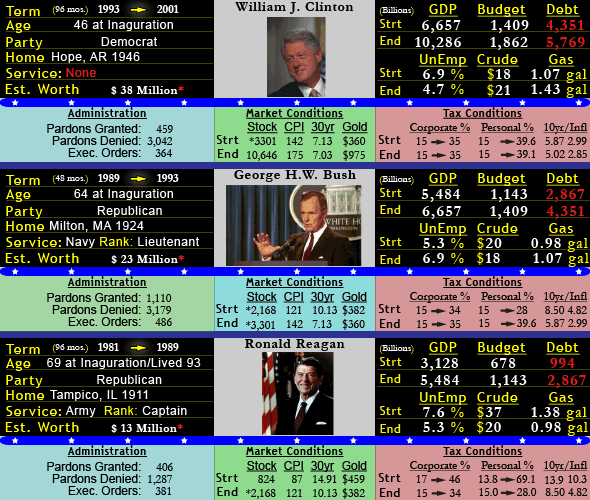
I did notice a mess up though, Bill Clintons end gold number or GW bushes starting gold numbers are off
Shows them both ending gold at 975
I did notice a mess up though, Bill Clintons end gold number or GW bushes starting gold numbers are off
Shows them both ending gold at 975
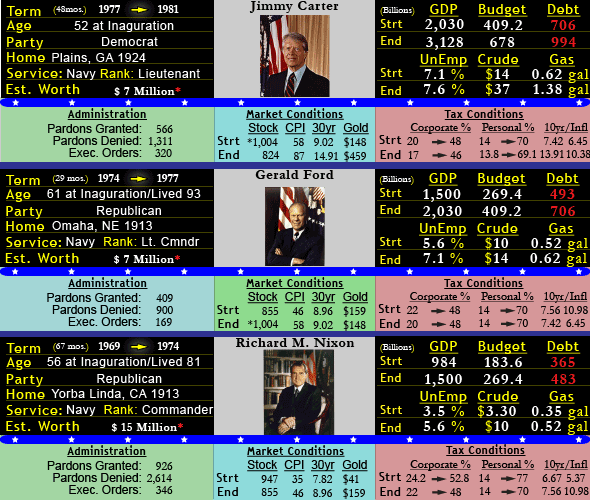
Hell of a lot of work there, great job. Something that stuck out to me - Kennedy, LBJ, Reagan, and Clinton were the only POTUS who took a bad
situation and made it better. 2 Dems, 2 Rep.
As someone else noted, 2001 seems to be a very "haywire" time for the numbers. Obviously this was also at the time of 2011.
From 2001 - today the unemployment rate, debt, and the price of Crude all doubled (or more) while the GDP only rose by 50%.
That my friends is why we're bankrupt and failing. Hmm, makes you wonder who really was behind 9/11. Seems to me the people that came out of this whole thing the best are the bankers and the oil producing nations.
Just for eye candy:
2001:
2012:
12 years of spending, lending, and borrowing... we're close to insolvent with no way to right the ship.
As someone else noted, 2001 seems to be a very "haywire" time for the numbers. Obviously this was also at the time of 2011.
From 2001 - today the unemployment rate, debt, and the price of Crude all doubled (or more) while the GDP only rose by 50%.
That my friends is why we're bankrupt and failing. Hmm, makes you wonder who really was behind 9/11. Seems to me the people that came out of this whole thing the best are the bankers and the oil producing nations.
Just for eye candy:
2001:
- GDP 10.2 bil
- UnEmp: 4.7%
- Crude: $21
- Debt: 5.7 bil
2012:
- GDP: 15.6 bil
- UnEmp: 9% (I say 9 because the DOL is reporting election year numbers now)
- Crude: $92
- Debt: 16bil
12 years of spending, lending, and borrowing... we're close to insolvent with no way to right the ship.
edit on 14-8-2012 by gncnew because: (no reason given)
edit on 14-8-2012 by gncnew because: (no reason given)
reply to post by morder1
Thank you and a great catch on the Gold error. The correct numbers should be:
1993: $360.91
2001: $272.22
2009: $975.00
So it is the end number for Bill Clinton that is off and my bad. The first gold set I had entered was for W Bush and then copied the field across the others. I missed one field to update and I'd hate to have seen the error go unnoticed. I appreciate the note and ability to correct it to give the thread more value!
@Thread
I'm happy to see that the numbers and ability to view such a long running set of the same bits of data, by President, is proving as helpful as it is interesting for everyone. I hope my followup pieces here and the budget thread I'm still working on are equally useful.
Are you sure about those crude oil prices from Eisenhower to Nixon?
Otherwise, great graphic. Thanx.
Otherwise, great graphic. Thanx.
edit on 8/14/2012 by TTAA2012 because: (no reason given)
Something i realized is before it got to george w bush, gas prices were raising but only by a few cents. at the end of george bushes 8 yr term it
raised a full dollar, obamas 1st term hasnt ended yet and it went up a dollar.
reply to post by TTAA2012
Thanks for the note. The source may be off but I'm going by what they said there for the earlier years in particular. I saw a few different versions of "In this year..." novelty type things for the price and they couldn't agree with each other, so I went with this one:
Crude Prices 1946-2011, Annual Average
I'll be the first to admit I also made a typo and missed it. I'm going to consider the couple errors I have caught (and been made aware of) now in typo and mixing the connecting lines a lesson as I build and finish the next one on the Budget. Proof read on a full nights rest, not just before falling into bed seeking one.
Clinton To Bush on Crude Price for 2001 should be 26, where it is current 21.
Again, everyone, my apologies on the couple errors that have been found and notated. I finished in a very tired condition and rushed a bit. Certainly a lesson learned on final checks to a future major thread.
(It's a shame I can't correct the Graphics directly in the image vault...but I don't believe that's possible now?)
edit on 14-8-2012 by Wrabbit2000 because: typo
Originally posted by mideast
reply to post by Wrabbit2000
I don't see honesty as a criterion.
Bush could keep the gas price low while planning to invade other countries.
He helped the war-machine and new job opportunities , didn't he ?
I've thought and considered how to reply to your observation because while politics itself isn't the direct purpose of what I made, it's obviously meant to serve as something of a reference for others to consider outside this thread.
With that in mind, I'd say that the Gas prices can be manipulated, and of course by definition OPEC is a functional monopoly of Oil resources to a whole block of the world. Things are what they are and on this one, well, there is something to be said for the President not having direct control anyway. (More on that in a follow-on for the Presidents) .
That's why I tried to get as diverse yet still meaningful a set of numbers and sources as I could. There are too many data points in different areas to believe all could be manipulated to make any one of the Presidents look good or bad, so I hope it works as a fair display of trends. Whichever type someone may be interested in seeing....
edit on 14-8-2012 by Wrabbit2000 because: (no reason given)
The gold prices under Reagan is very telling. Much confidence....
new topics
-
Ireland VS Globalists
Social Issues and Civil Unrest: 4 minutes ago -
Biden "Happy To Debate Trump"
Mainstream News: 35 minutes ago -
RAAF airbase in Roswell, New Mexico is on fire
Aliens and UFOs: 44 minutes ago -
What is the white pill?
Philosophy and Metaphysics: 2 hours ago -
Mike Pinder The Moody Blues R.I.P.
Music: 2 hours ago -
Putin, Russia and the Great Architects of the Universe
ATS Skunk Works: 6 hours ago -
A Warning to America: 25 Ways the US is Being Destroyed
New World Order: 10 hours ago
top topics
-
President BIDEN's FBI Raided Donald Trump's Florida Home for OBAMA-NORTH KOREA Documents.
Political Conspiracies: 16 hours ago, 34 flags -
A Warning to America: 25 Ways the US is Being Destroyed
New World Order: 10 hours ago, 18 flags -
Mike Pinder The Moody Blues R.I.P.
Music: 2 hours ago, 7 flags -
What is the white pill?
Philosophy and Metaphysics: 2 hours ago, 5 flags -
RAAF airbase in Roswell, New Mexico is on fire
Aliens and UFOs: 44 minutes ago, 4 flags -
Is AI Better Than the Hollywood Elite?
Movies: 17 hours ago, 4 flags -
Biden "Happy To Debate Trump"
Mainstream News: 35 minutes ago, 3 flags -
Putin, Russia and the Great Architects of the Universe
ATS Skunk Works: 6 hours ago, 2 flags -
Maestro Benedetto
Literature: 17 hours ago, 1 flags -
Ireland VS Globalists
Social Issues and Civil Unrest: 4 minutes ago, 0 flags
active topics
-
King Charles 111 Diagnosed with Cancer
Mainstream News • 322 • : Oldcarpy2 -
University of Texas Instantly Shuts Down Anti Israel Protests
Education and Media • 278 • : cherokeetroy -
Gaza Terrorists Attack US Humanitarian Pier During Construction
Middle East Issues • 80 • : Asher47 -
Ireland VS Globalists
Social Issues and Civil Unrest • 0 • : TimBurr -
Biden "Happy To Debate Trump"
Mainstream News • 6 • : KrustyKrab -
New whistleblower Jason Sands speaks on Twitter Spaces last night.
Aliens and UFOs • 73 • : pianopraze -
Meadows, Giuliani Among 11 Indicted in Arizona in Latest 2020 Election Subversion Case
Mainstream News • 27 • : IndieA -
RAAF airbase in Roswell, New Mexico is on fire
Aliens and UFOs • 3 • : Degradation33 -
What is the white pill?
Philosophy and Metaphysics • 14 • : kwaka -
Las Vegas UFO Spotting Teen Traumatized by Demon Creature in Backyard
Aliens and UFOs • 16 • : introufo2