It looks like you're using an Ad Blocker.
Please white-list or disable AboveTopSecret.com in your ad-blocking tool.
Thank you.
Some features of ATS will be disabled while you continue to use an ad-blocker.

Flight 77 FDR Data - Pentagon Altitudes Fudged
page: 2share:
altitude (of what kind?) is 238
Barometric.
And the first data frame:
146509.000,120,8186,-3.8,-4.3,-280.4489,0,-239.75,0,26,49,
This shows a GMT time of 0:26:49 - translated to EDT (minus 4 hours) this is 8:26:49 PM. Was this a night flight? (first frame of data in "normal" csv - 8:19:01 am)
Interesting... I'll have a look and see if I have the same thing here. Was it the first flight of the day? Could be the clock needed setting.
And the altitude, which is relevant here, is 120 (Dulles elevation about 290-300 feet msl) and the infallible radio altimeter says 8186. Feet above the ground. It's not in the air. And not a temporary glitch. The numbers go up and down one foot either way for many, many frames, indicating still pre-takeoff (which happened around 8:20:30 in the old csv).
It is because with the aircraft on the ground, the RA is -6 ft, which on the FDR is recorded as the highest value it can record. Once the RA reads 0 ft, then it reads 0.
[edit on 14-9-2007 by mirageofdeceit]
MoD: Thanks for those points. The clock needing set makes sense for the time, and the altimeter error makes sense in that light. I figured both had an
explanation - an error that obvious would not have gone unnoticed. Just made me say "que?"
JDX: I'm sure you've got me on the Gs thing. And while pitch had been changing up to .9 degrees a second up ill then, I guess it's the additional pressure difference of being a few feet lower that would cause any additional change on that scale after 9:37:44 to tear the wings off. ??
As for being deceitful and whatnot - I am trying to get all data sets to line up. You guys are trying to do the opposite. Both are biases. I think this will be clear when I finish the review of the 3D flight path video.
I'll go back and see if there's anything I think is misleading in the fetzer piece and change it. I'll include a link to your corrections to help explain. You did say you worked on it together, somehow I thought that was before publishing but apparently you just didn't get the final vet. But if all collaboration was afterwards, then I'll edit to carify - later tonight or soon.
The line you have drawn has the aircraft changing almost 4 degrees of pitch in less than a second at over 460 knots. It does not match the pitch data
that was recorded in the last second at 4 times per second. The pitch data i supplied on the last page is the data recorded from 09:37:44 to 09:37:45
in which the NTSB claims is the "impact" time.
The pitch angles you offer and the line you have drawn do not match the data supplied by the NTSB. Ours does.
Re: Fetzer
If we both wrote the article together.. .why would i ask to write up corrections together? Have you read the corrections and comments? It says in the first paragraph that we did not write the article. I stated we worked on the comments and correction together... not the article.
z9.invisionfree.com...
There would be no need for corrections/comments from our organization if Fetzer and i had wrote the article together initially.
You misrepresent and mislead your readers.
added link
[edit on 15-9-2007 by johndoex]
I was surprised to not see this video posted in this thread so I added it.
video.google.com...
It is from Pilotsfor911truth and although slowly paced has a great analysis of the errors in the official flight path and the black box path of the flight.
Lots of old info but they cover the black box info
38 minutes in it covers flight data best.
more info at
pilotsfor911truth.org...
[edit on 15-9-2007 by Redge777]
reply to post by johndoex
Rob, you are totally correct that I misread your earlier post about cooperation w/Fetzer. My bad, and looking back there's little excuse for it. It's been updated and bumped. It's still the shrill war cry type thing I intended it as, at the time, but I recognize the part about you having the cockpit thing and all is a bit hyperbolic.
Redge: for the link. I'm gonna try to one-up ya with an embed - no, wait - there's the thread already here:
AA77 flight path in 3D or whatever exact title
Anyone who wants to know about what happened at the Pentagon, you should watch that along with your other research.
Regarding your earlier points, Rob:
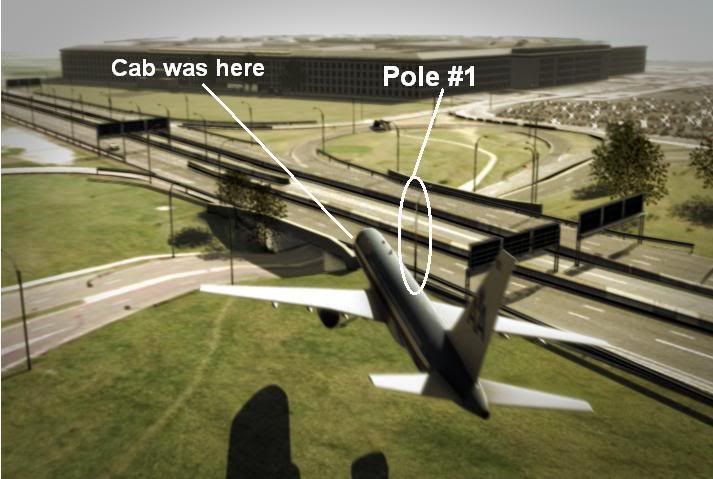
Overpass elevation - Your photos show a roadway well above the Pentalawn - as your profile shows an overpass. Google maps is wrong - it gives it as 32.8, which seems to be the lower roadway elevation, near to the 36.1 feet reported to its right and left. With a clearance of, say, 16 feet, plus roadway thinckeness above, I perhaps rounded down slighly to 50' msl. Russ Pickering used other methods to place it at 50' at least. linkThis is about 20 feet higher than the lawn. But it's an underpass? The clearance is about right but in this computer graphic, but you think they'd really build a road like that?
Over or under? That's a new question to me I'll have to look into.
Re; FDR "errors" - I do get confused sometimes, and I hope I didn't make too many blunders, but the main problem here is I used the numbers from the original CSV and you're looking at readout 2, which I'm still not familiar with. Projecting from (the rollover to) 9:37:44, we have 1-2 seconds 'til impact. Therefore:
With a final pitch of 3, I think I mapped a change of 2 degrees in less than two seconds. It's not so much the shallowness of the slope you're tripping over here as the combo of a slightly shallower picth and a lower altitude (based partly on a more accurate impact point reading). Even when you "try" yo hypothetically place the data at the "official" altitude, somehow it still comes out just above everything. This is not going un-noted.
Trying to get it level was the whole point of the endeavor. And again, going off the original csv, this is as accurate a guess as it is. two degrees of pitch and about 13 of bank in 1-2 seconds. I don't know how much sense this makes, but it seems reasonable enough to offer.
Based on readout 2, hell, I'm sure you're right there.
They are a good guess to fill in the gap in the original CSV. They are all it would take to tie together the FDR and the physical evidence and allow this all to make sense. God forbid. They don't comport with readout 2 then, I take it. Hmmm... Better get to understanding that one now before readout 3 arrives. (moan).
Overpass elevation - Your photos show a roadway well above the Pentalawn - as your profile shows an overpass. Google maps is wrong - it gives it as 32.8, which seems to be the lower roadway elevation, near to the 36.1 feet reported to its right and left. With a clearance of, say, 16 feet, plus roadway thinckeness above, I perhaps rounded down slighly to 50' msl. Russ Pickering used other methods to place it at 50' at least. linkThis is about 20 feet higher than the lawn. But it's an underpass? The clearance is about right but in this computer graphic, but you think they'd really build a road like that?
Over or under? That's a new question to me I'll have to look into.
Re; FDR "errors" - I do get confused sometimes, and I hope I didn't make too many blunders, but the main problem here is I used the numbers from the original CSV and you're looking at readout 2, which I'm still not familiar with. Projecting from (the rollover to) 9:37:44, we have 1-2 seconds 'til impact. Therefore:
The line you have drawn has the aircraft changing almost 4 degrees of pitch in less than a second at over 460 knots. It does not match the pitch data that was recorded in the last second at 4 times per second.
With a final pitch of 3, I think I mapped a change of 2 degrees in less than two seconds. It's not so much the shallowness of the slope you're tripping over here as the combo of a slightly shallower picth and a lower altitude (based partly on a more accurate impact point reading). Even when you "try" yo hypothetically place the data at the "official" altitude, somehow it still comes out just above everything. This is not going un-noted.
Also, your final line shows almost level at the wall. You are being being deceitful and not representing the data accurately.
Trying to get it level was the whole point of the endeavor. And again, going off the original csv, this is as accurate a guess as it is. two degrees of pitch and about 13 of bank in 1-2 seconds. I don't know how much sense this makes, but it seems reasonable enough to offer.
Based on readout 2, hell, I'm sure you're right there.
The pitch angles you offer and the line you have drawn do not match the data supplied by the NTSB. Ours does.
They are a good guess to fill in the gap in the original CSV. They are all it would take to tie together the FDR and the physical evidence and allow this all to make sense. God forbid. They don't comport with readout 2 then, I take it. Hmmm... Better get to understanding that one now before readout 3 arrives. (moan).
1. Pickering doesnt have a clue what he is talking about and has done nothing in the past year except to try to prove the govt story for them sans
positive ID. Please see the Taxi cab photo i posted on the first page of this thread which shows Wash Blvd near level with the pentalwn. I only used
the graphic above to illustrate that indeed it is an 'underpass' at that section and not an overpass.
2. The numbers i posted on page 1 are from the original csv file, RO1
Here they are again... (pitch is recorded 4 times per second)
09:37:44 -4.9
-5.1
-5.4
-5.6
09:37:45 (impact time according to NTSB)
Your line drawn and your pitch angles do not match or represent the numbers from the original csv file. Ours does.
I have no idea why you are trying to "guess" pitch and roll numbers, when the numbers are present for that period of time (according to the NTSB) in the original csv file RO1. Pitch, Vertical speed also correspond with G loads for that time frame. This is what it means to 'cross-check'. No bias, just following the numbers.
Click the 3D animation above in CL's post for an accurate representation of the numbers provided by the NTSB in comparison to the physical damage when omitting altitude and plotted flight path as variables.
Thanks for updating your blog, apology accepted.
typo
[edit on 16-9-2007 by johndoex]
To help you here, the file im referencing is DCA01MA064_tabular which is the original csv RO1.
Roll angle is column J
Pitch Angle is column K
Roll (eta: and pitch) numbers are present for the time period from washington blvd to the pentagon wall (according to the NTSB).
Roll Angles as follows (positive number represents right bank)
09:37:44 6.3
6.3
6
5.3
09:37:45
eta: No need to guess the numbers, they were recorded. Roll and pitch are recorded 4 times per second and are present for the leg shown in our 3D presentation.
eta: Conclusion - The data supplied by the NTSB does not support an impact theory when cross checking all the data. The Pitch/Roll data does not account for the physical damage when working outwards from the "impact point". The data is present. Anything else is pure speculation.
[edit on 16-9-2007 by johndoex]
[edit on 16-9-2007 by johndoex]
reply to post by johndoex
Even the old csv has four pitch readings per second and all are present for 9:37:44? And it gts steeper? And roll too? I had missed that. Maybe in the extended fields of zeros and stuff under each "frame." (Mine I never got formatted right). If so that does invalidate my line as representative of the data.
I am starting to see I need a change of tack on the FDR issues. I've got my foot in the door, figured a few things out, but... jeez. So yeah, I'm gonna have to do something with my recent posts. (shuffling to the side)
But... I'm still planning to review the animation if with an altered technical take. The bank angle recorded, it would then seem, does not match the damage, off by 12 degrees. less than one second left. Hmmm. This makes the placement of impact tricky - looks like you based it on getting the right engine about right (to capitalize on the "columns" even the ASCE sees there?) and disregarding the error this plus the odd bank place the rest of the impact too high - fuselage at least half above the second floor slab, with left wing ipping about mid-2nd floor. There's no way to directly reconcile the data with the "official" impact, but you could've tried harder. Now the general altitude must be higher, which helps your too-high thing. It's a minor point comppared to the data itself of course, but worthy of note.
Russ hasn't got a clue? Wow. I'm not saying he''s 100% right or we agree on everything, but with all due respect, that's a pretty dumb statement.
The "bridge" seems to be more an underpass I now agree, but am I to understand the lower roadway has an elevation of about 15 feet msl and the upper road fully level with the building or what? I see it at 33 feet, about level with the Pentagon, and the upper road 20 feet higher, on a gentle sloping hill thing. The road is maybe ten feet lower right in front of the Pgon, but the lawn still slopes down several feet from there.The base of the VDOT pole seems to be 49 feet msl by Google, and the light poles not much lower. Full anlysis coming.
sweet
Even the old csv has four pitch readings per second and all are present for 9:37:44? And it gts steeper? And roll too? I had missed that. Maybe in the extended fields of zeros and stuff under each "frame." (Mine I never got formatted right). If so that does invalidate my line as representative of the data.
I am starting to see I need a change of tack on the FDR issues. I've got my foot in the door, figured a few things out, but... jeez. So yeah, I'm gonna have to do something with my recent posts. (shuffling to the side)
sour
But... I'm still planning to review the animation if with an altered technical take. The bank angle recorded, it would then seem, does not match the damage, off by 12 degrees. less than one second left. Hmmm. This makes the placement of impact tricky - looks like you based it on getting the right engine about right (to capitalize on the "columns" even the ASCE sees there?) and disregarding the error this plus the odd bank place the rest of the impact too high - fuselage at least half above the second floor slab, with left wing ipping about mid-2nd floor. There's no way to directly reconcile the data with the "official" impact, but you could've tried harder. Now the general altitude must be higher, which helps your too-high thing. It's a minor point comppared to the data itself of course, but worthy of note.
Russ hasn't got a clue? Wow. I'm not saying he''s 100% right or we agree on everything, but with all due respect, that's a pretty dumb statement.
The "bridge" seems to be more an underpass I now agree, but am I to understand the lower roadway has an elevation of about 15 feet msl and the upper road fully level with the building or what? I see it at 33 feet, about level with the Pentagon, and the upper road 20 feet higher, on a gentle sloping hill thing. The road is maybe ten feet lower right in front of the Pgon, but the lawn still slopes down several feet from there.The base of the VDOT pole seems to be 49 feet msl by Google, and the light poles not much lower. Full anlysis coming.
I think this is more representative of a cross section of the topography along the alledged flight path...
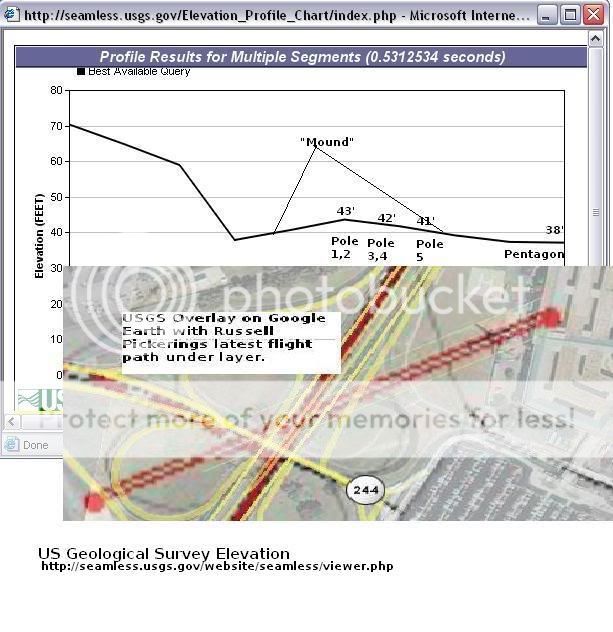
It was done with US Geological Survey. The red line you see along the reported flight path is what is represented in the graph above for topography cross section. And is what i used in my drawing you hacked up..
Good to see you found the csv file contains the numbers you seek and you will not have to guess.
Again, you can save yourself alot of time with your posts if you email us first. I rarely come here to check ATS, but when i do, its always something else being misrepresented and i feel obligated to set the record straight. Waste of time really and perhaps i shouldnt bother... but sometimes i feel i have to.
Go here to see the numbers i crunched last year in this scenario based on vertical speed.
z9.invisionfree.com...
[edit on 17-9-2007 by johndoex]
Originally posted by Caustic Logic
There's no way to directly reconcile the data with the "official" impact, but you could've tried harder.
Im not trying to "fit" an impact. Im showing what the number represent. No bias, straight forward numbers provided by the NTSB. AS you said, the data does not support the "official impact" theory.
Now the general altitude must be higher, which helps your too-high thing.
Its not "[my] too high thing"... its what the data shows. So i suppose you can say its "The NTSB too high thing"...
Russ hasn't got a clue? Wow. I'm not saying he''s 100% right or we agree on everything, but with all due respect, that's a pretty dumb statement.
That is correct. Russ doesnt have a clue. I can safely say that after working countless hours with the man, he truly doesnt have a clue, perhaps has a learning disorder, and/or has an agenda. I have never come across someone so stubborn and unable to learn new information, regardless if it pertains to 9/11. Im not trying to attack him, however this is my honest opinion.
eta: And to be fair to Russ since he is not here to defend himself... he will tell you im a master manipulator, only it in for the money, and that i "sequestered" and manipulated all these people to join a 'cult'.
[edit on 17-9-2007 by johndoex]
new topics
-
President BIDEN's FBI Raided Donald Trump's Florida Home for OBAMA-NORTH KOREA Documents.
Political Conspiracies: 32 minutes ago -
Maestro Benedetto
Literature: 2 hours ago -
Is AI Better Than the Hollywood Elite?
Movies: 2 hours ago -
Las Vegas UFO Spotting Teen Traumatized by Demon Creature in Backyard
Aliens and UFOs: 5 hours ago -
2024 Pigeon Forge Rod Run - On the Strip (Video made for you)
Automotive Discussion: 6 hours ago -
Gaza Terrorists Attack US Humanitarian Pier During Construction
Middle East Issues: 6 hours ago -
The functionality of boldening and italics is clunky and no post char limit warning?
ATS Freshman's Forum: 8 hours ago -
Meadows, Giuliani Among 11 Indicted in Arizona in Latest 2020 Election Subversion Case
Mainstream News: 8 hours ago -
Massachusetts Drag Queen Leads Young Kids in Free Palestine Chant
Social Issues and Civil Unrest: 8 hours ago -
Weinstein's conviction overturned
Mainstream News: 10 hours ago
top topics
-
Krystalnacht on today's most elite Universities?
Social Issues and Civil Unrest: 11 hours ago, 9 flags -
University of Texas Instantly Shuts Down Anti Israel Protests
Education and Media: 14 hours ago, 8 flags -
Supreme Court Oral Arguments 4.25.2024 - Are PRESIDENTS IMMUNE From Later Being Prosecuted.
Above Politics: 11 hours ago, 8 flags -
Weinstein's conviction overturned
Mainstream News: 10 hours ago, 7 flags -
Gaza Terrorists Attack US Humanitarian Pier During Construction
Middle East Issues: 6 hours ago, 7 flags -
Massachusetts Drag Queen Leads Young Kids in Free Palestine Chant
Social Issues and Civil Unrest: 8 hours ago, 6 flags -
Meadows, Giuliani Among 11 Indicted in Arizona in Latest 2020 Election Subversion Case
Mainstream News: 8 hours ago, 5 flags -
Las Vegas UFO Spotting Teen Traumatized by Demon Creature in Backyard
Aliens and UFOs: 5 hours ago, 4 flags -
President BIDEN's FBI Raided Donald Trump's Florida Home for OBAMA-NORTH KOREA Documents.
Political Conspiracies: 32 minutes ago, 3 flags -
2024 Pigeon Forge Rod Run - On the Strip (Video made for you)
Automotive Discussion: 6 hours ago, 2 flags
active topics
-
Is AI Better Than the Hollywood Elite?
Movies • 5 • : 5thHead -
University of Texas Instantly Shuts Down Anti Israel Protests
Education and Media • 235 • : NorthOS -
New whistleblower Jason Sands speaks on Twitter Spaces last night.
Aliens and UFOs • 62 • : pianopraze -
Alternate Electors vs Fake Electors - What is the Difference.
2024 Elections • 115 • : WeMustCare -
Sunak spinning the sickness figures
Other Current Events • 24 • : NoCorruptionAllowed -
Nearly 70% Of Americans Want Talks To End War In Ukraine
Political Issues • 95 • : Irishhaf -
Meadows, Giuliani Among 11 Indicted in Arizona in Latest 2020 Election Subversion Case
Mainstream News • 14 • : WeMustCare -
HORRIBLE !! Russian Soldier Drinking Own Urine To Survive In Battle
World War Three • 44 • : theshadowknows -
President BIDEN's FBI Raided Donald Trump's Florida Home for OBAMA-NORTH KOREA Documents.
Political Conspiracies • 0 • : WeMustCare -
God's Righteousness is Greater than Our Wrath
Religion, Faith, And Theology • 31 • : glend