It looks like you're using an Ad Blocker.
Please white-list or disable AboveTopSecret.com in your ad-blocking tool.
Thank you.
Some features of ATS will be disabled while you continue to use an ad-blocker.

Is there Proof that Man isn't causing "Global Warming"?
page: 2share:
Originally posted by Muaddib
Yes, the Earth is going through Climate Change, and it will probably warm more, but some research suggest that after the Sun's output and the increase in solar flare slows down,
Is there hardcore proof that there is an actual and affectual increase in sun/solar activity, today, with direct temperature links even?
[edit on 12-6-2007 by IgnoranceIsntBlisss]
Originally posted by Muaddib
hummm..... This is very strange, this particular research is nowhere to be found now, even though it existed a couple of weeks ago.
Actually a week ago i was able to open that link and view the research, now it is gone. Maybe they are having some problems or someone hacked into their site?
try the wayback machine sometime
the new URL parser is killing longer links, manual mode: ie. copy and paste - replace the * in ht*p with a t pls (both, in the begiining and the middle)
h*tp://web.archive.org/web/20060522091537/h*tp://blue.atmos.colostate.edu/publications/pdf/R-229.pdf
but i got to warn you, sometimes, a new owner buys out a site and locks the archive by request ie. censorship
[edit on 12.6.2007 by Long Lance]
Originally posted by IgnoranceIsntBlisss
Is there hardcore proof that there is an actual and affectual increase in sun/solar activity, today, with direct temperature links even?
Solar activity has been pretty much consistent for the last several decades. It cannot account completely for current warming.
www.mps.mpg.de...
If you're not prepared to read the actual science that makes up the consensus, then you will be open to manipulation by misinformation, or in the case of some disinformation.
0.014'C is a figure from a regional model which does not speak to global trends at all. Like most of the stuff that will be posted in an attempt to challenge AGW, it is a cherrypicked study that is does not reflect the current science on global trends at all. If you want to experience this 0.014'C, best move to the central US grasslands.
www.jamstec.go.jp...
crga.atmos.uiuc.edu...
However, I guess if you think that 1xCO2 would give 0.007'C showing all the science is crap, then it's not even worth my effort to explain...
[edit on 12-6-2007 by melatonin]
Im pretty sure our resident climatologist will shoot this down but heres some work and calculations which some would call proof but anyhow...
brneurosci.org...
Might not be done with the latest and most expensive computer models as they mention in it. Basicly their conclusion is that the effect of CO2 in raising temperatures has been distorted in the climatologist models.
www.oism.org...
Here is some measurement data collected that show longterm drop instead of shooting record high temperatures. It also shows the increase in plant growth due to increased CO2. Theres also explanation on why we seem to be going up in temperatures measured in urban areas while temperatures in rular areas seem to be going down. Granted this is study from the 1998 so its what someone could call "outdated".
Originally posted by Gonjo
Im pretty sure our resident climatologist will shoot this down but heres some work and calculations which some would call proof but anyhow...
brneurosci.org...
Might not be done with the latest and most expensive computer models as they mention in it. Basicly their conclusion is that the effect of CO2 in raising temperatures has been distorted in the climatologist models.
They produce a figure that is lower than current estimates for climate sensitivity. But they still show that doubling CO2 will affect climate (1.4-2.7'C vrs 2-4.5'C). That's enough for me.
So you have supported the notion that human CO2 does affect climate significantly. Well done.
Obviously it would be good if these people can actually publish this data, then it will be added to the corpus of data. With some showing much more warming (higher bound much more than 4.5'C), some a bit less (lower bound 1.5'C), and a conservative figure of 2-4.5'C.
As for the second website, this should suffice..
www.mps.mpg.de...
Their solar data is incorrect and is based on Friss & Christensen's erroneous data (see Damon & Laut, 2004). The Solanki article has the correct solar data.
But an aside, I'm not a climatologist, just a scientist that is interested in climate change. Have been for over 20 years since I wrote a physics essay on it in 1987.
[edit on 12-6-2007 by melatonin]
Originally posted by melatonin
They produce a figure that is lower than current estimates for climate sensitivity. But they still show that doubling CO2 will affect climate (1.4-2.7'C vrs 2-4.5'C). That's enough for me.
So you have supported the notion that human CO2 does affect climate significantly. Well done.
[edit on 12-6-2007 by melatonin]
You fail to notice the fact that they have calculated _the whole_ GHG effect. so unless you claim that CO2 is the reason of the whole GHG effect and raise of 33'C then you can start to wake up. Last time I checked CO2 was not the only GHG. So when they say doubling GHG would increase temperature by 1.4-2.7'C they are not talking about CO2 but the whole athmospheric effect, which seems to have escaped even you. Correct me if im wrong but even you said CO2 was responsible only for 9-26% of the whole effect depending on how much moisture the area in question has.
Originally posted by Gonjo
You fail to notice the fact that they have calculated _the whole_ GHG effect. so unless you claim that CO2 is the reason of the whole GHG effect and raise of 33'C then you can start to wake up. Last time I checked CO2 was not the only GHG. So when they say doubling GHG would increase temperature by 1.4-2.7'C they are not talking about CO2 but the whole athmospheric effect, which seems to have escaped even you. Correct me if im wrong but even you said CO2 was responsible only for 9-26% of the whole effect depending on how much moisture the area in question has.
Eh?
You don't what you are talking about, did you read the same words as me? I know exactly what they are saying, but it seems you don't:
What is the contribution of anthropogenic carbon dioxide to global warming? This question has been the subject of many heated arguments, and a great deal of hysteria. In this article, we will consider a simple calculation, based on well-accepted facts, that shows that the expected global temperature increase caused by doubling atmospheric carbon dioxide levels is bounded by an upper limit of 1.4-2.7 degrees centigrade. This result contrasts with the results of the IPCC's climate models, whose projections are shown to be unrealistically high.
The 9-26% is calculated by models that express the physical properties of the molecules in question, due to overlapping longwave absorption, producing an exact figure is difficult, although some like Ramanathan & Croakley have done so (12%). This is an estimate of the proportion of the greenhouse effect that CO2 is responsible for.
The problem with offering alternative causes for global warming is that one is still left with human activity which should also be causing global
warming and which little if any attempt is made to disprove. Even if other natural factors are involved, that in itself doesn't prove that human's
are not also responsible.
And, as noted in the 'sister thread' to this one - we're not talking CO2
And, as noted in the 'sister thread' to this one - we're not talking CO2
Originally posted by melatonin
Originally posted by IgnoranceIsntBlisss
Is there hardcore proof that there is an actual and affectual increase in sun/solar activity, today, with direct temperature links even?
Solar activity has been pretty much consistent for the last several decades. It cannot account completely for current warming.
www.mps.mpg.de...
That shows it start rising leading into 2000, then it ends at 2000. Isn;t there some sort of 'depot' that has these sorts of proxies at recent interval?
0.014'C is a figure from a regional model which does not speak to global trends at all. Like most of the stuff that will be posted in an attempt to challenge AGW, it is a cherrypicked study that is does not reflect the current science on global trends at all. If you want to experience this 0.014'C, best move to the central US grasslands.
Ok, so equilibrium change in global mean surface temperature following a doubling of the atmospheric (equivalent) CO2 concentration is called Climate Sensitivity. What is the direct term for the temp the present CO2 is responsible for?
The rough average between the different C.S. estimates is perhaps 2.8C. So then does that mean the current CO2 is 'causing' 1.4C of the temp?
[edit on 12-6-2007 by IgnoranceIsntBlisss]
I was reading through this thread and I was resonable impressed. I hadn't visited ATS in a while so I signed in. I will make my points and sit back
and read. The whole idea that CO2 is somehow higher than in the last , some say, 650,000 years, has been brought into question by Ernst Beck, 90,000
air samples of CO2 in last 180 years and Jaworowsky who showed the phalacy of using ice core CO2 as a proxy for amospheric CO2. I don't have the
links handy but anyone can put those names in and find the PEER REVIEWED papers . Anyway a quick look at these papers show how deceitful the AGW's
have been. In the 1940's the CO2 was over 440, same in 1825. In the current solar cycle #24, THE SUN'S electro magnetic fields have protected the
earth from cosmic rays from far away supernovae. Begining with solar cycle #25 that will change. Cosmic rays which contain small particles cause
increased cloud cover. Temperatures go down. Expect the beginings of that little ice age that was mentioned earlier around 2020. By 2030 there will be
no doubt that runaway manmade global warming was a hoax. There will be the proof. Sorry I don't have the URL's handy but I am too busy right now to
look GW is a threat to mankind. Threats make large quantities of money available. Scientists need this money, Environmental organizations get the
benefits. They in turn give money to politicians. As far as rapidly increasing temperature it is not. Especially the troposphere which should warm if
greenhouse gases were the culprit. yes we should be more efficient, we chould clean up bad stuff wherever it occurs. we have cleaned up our lakes and
rivers. More to be done. Don't waste the money on plant food CO2. Oh and check out the effect of carbonnic acid and calcite (calcium carbonate) which
is the CO2 regulator system and describes how CO2 is released from the oceans when it gets warmer.
There is so much proof to support that Man is NOT fully responsible for so called "global warming". One easy fact to bring up is the fact that the
SUN is also heating up, sun flares and solar activity is at an all time high, we are entering into a photon belt of Light that will bring about many
changes on Earth.
Earth is always changing, there is no reason to think that man, all by himself, is causing the warming up of the Earth. Sure, we may contribute to it with the garbage we do, but overall, this change is galactic in nature, and all these fools who go on TV and say how global warming is all our fault, we need to have taxes on our carbon footprint, its actually a breathing tax, did you know that? They want to tax you for breathing, just like they did in Ireland during the Middle Ages.
Earth is always changing, there is no reason to think that man, all by himself, is causing the warming up of the Earth. Sure, we may contribute to it with the garbage we do, but overall, this change is galactic in nature, and all these fools who go on TV and say how global warming is all our fault, we need to have taxes on our carbon footprint, its actually a breathing tax, did you know that? They want to tax you for breathing, just like they did in Ireland during the Middle Ages.
Originally posted by IgnoranceIsntBlisss
The rough average between the different C.S. estimates is perhaps 2.8C. So then does that mean the current CO2 is 'causing' 1.4C of the temp?
no, it's progressively less with increased concentration, (saturation)
i posted this a while ago: www.abovetopsecret.com...
to be fair i will include another thread, with responses to these points:
www.abovetopsecret.com...
it goes on of course but it's lengthy.
iow: doubled carbon dioxide -> either 99% or 1% increase in greenhouse effect if concentration is low or high, respectively.
Originally posted by IgnoranceIsntBlisss
That shows it start rising leading into 2000, then it ends at 2000. Isn;t there some sort of 'depot' that has these sorts of proxies at recent interval?
The recent change is negligible. There is a slight trend, but the major increase finished around 1950. It hasn't reached that level since.
I think (I'd need to check though) that solar irradiance measures are taken directly now. However, they use proxies for earlier periods.
What is the direct term for the temp the present CO2 is responsible for?
The rough average between the different C.S. estimates is perhaps 2.8C. So then does that mean the current CO2 is 'causing' 1.4C of the temp?
I'm not sure it has a particular definition. Probably just the attribution of warming to CO2.
Climate sensitivity is calculated as 280ppm to 560ppm. Thus we are not at 1.5xCO2, maybe 1.35xCO2. The way to calculate it is to understand that a doubling of CO2 is suggested to produce a forcing of 4wm-2. So using the 3'C figure, we have 0.75'C/wm-2.
CO2 forcing is estimated to currently be 1.5wm-2; so 1.5x0.75 = about 1.1'C +/- probably about 0.5'C
So the current increase of CO2 has the potential to induce 1.1'C. However, there are also forcings that are cooling the atmosphere, such as aerosols. These are essentially masking a good part of this potential forcing, but it isn't going anywhere for a while...
[edit on 12-6-2007 by melatonin]
Originally posted by LightWorker13
One easy fact to bring up is the fact that the SUN is also heating up, sun flares and solar activity is at an all time high, we are entering into a photon belt of Light that will bring about many changes on Earth.
The proof of that factor would be ideal. I keep running into charts that cut off around Y2K. I gotta dig out my folders from my inquiry a few months ago maybe, when I get home. but I could swear the charts were all dropping off around Y2K. Cosmic ray increases, and proof of a direct connection would also be ideal.
How much the Sun causes warms this planet as well as Mars and Venus would be some nice data too. I might have to start a thread over in the Space forums and maybe we can get some solid unbiased input on that particular...
[edit on 12-6-2007 by IgnoranceIsntBlisss]
Originally posted by IgnoranceIsntBlisss
The proof of that factor would be ideal. I keep running into charts that drop off. I gotta dig out my folders from my inquiry a few months ago maybe, but I could swar the charts were all dropping off around Y2K. Cosmic ray increases, and proof of a direct connection would also be ideal. How much the Sun causes warms this planet as well as Mars and Venus would be some nice data 2. I might have to start a thread over in the Space forums and maybe we can get some unbiased input...
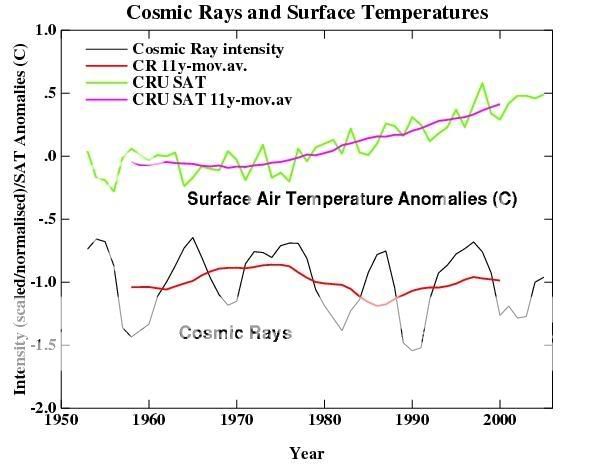
You can actually check the cosmic ray data yourself:
ftp.ngdc.noaa.gov...
There is no trend, just the normal cycles. Plotted against temperature, it looks thus:
[edit on 12-6-2007 by melatonin]
That's fine, but again we're given charts that 'end' on Y2K. It's almost like there's a 'conspiracy' to keep us scratching our heads about
specifically what is happening today.
But from there we need an understanding of how much it actually contributes, if any, and then to line that up with solar activity with an understanding of how relevent the solar activity actually is.
But from there we need an understanding of how much it actually contributes, if any, and then to line that up with solar activity with an understanding of how relevent the solar activity actually is.
Originally posted by IgnoranceIsntBlisss
That's fine, but again we're given charts that 'end' on Y2K. It's almost like there's a 'conspiracy' to keep us scratching our heads about specifically what is happening today.
The data from most of 2006 is there. On the graph, it's just case of using a longer period mean calculation that accounts for cycles. This allows the longer trends to be seen. Essentially, there isn't one. There is a period where cosmic rays go down, temperature continues up; another where cosmic rays go up, temperature continues up. So, the only real inference is that variations at this level have little effect on temperature.
As for the solar data, the decoupling is clear.
Originally posted by melatonin
On the graph, it's just case of using a longer period mean calculation that accounts for cycles. This allows the longer trends to be seen.
So then is that the actual data, or is it a "calculation"? Why wouldn't good scientists have the most specific and accurate data possible?
All of the most data-important graphs seem to have 10 year timeframes that end at 2000 without telling us specifically what year the hard data ends at.
Originally posted by IgnoranceIsntBlisss
Originally posted by melatonin
On the graph, it's just case of using a longer period mean calculation that accounts for cycles. This allows the longer trends to be seen.
So then is that the actual data, or is it a "calculation"? Why wouldn't good scientists have the most specific and accurate data possible?
All of the most data-important graphs seem to have 10 year timeframes that end at 2000 without telling us specifically what year the hard data ends at.
It is the actual data. But like all data, it is not presented raw, it is statistically analysed. Thus, in my particular line of research, if I test 50 students on the stroop test I will statistically analyse using ANOVA to assess significant differences between the group data, producing a summary analysis. the raw data is not presented.
So, for the solar data and cosmic ray data, an 11 year running mean is calculated. This is used to control for the solar cycles. Thus, we know that during the cycles, we will have peak and troughs. By taking a 11 year mean, we can remove these variations and assess the true long-term trend. In essence, it removes the regular variation and allows trends to be obvious.
The proxy data uses Principal Component Analysis (PCA), Reg-Em, Monte Carlo simulations etc etc. Now, if you don't like such statistical analysis, then ignore all proxy data and make no claims about past climate. Whilst those who accept such methods are useful will use the data.
Aren't we about "scheduled" for temperature increases leading into the next ice age cycle?
Petit et al. 1999; data kindly provided by J. R. Petit and colleagues
Petit et al. 1999; data kindly provided by J. R. Petit and colleagues
new topics
-
Australian PM says the quiet part out loud - "free speech is a threat to democratic dicourse"...?!
New World Order: 4 minutes ago -
Ireland VS Globalists
Social Issues and Civil Unrest: 35 minutes ago -
Biden "Happy To Debate Trump"
Mainstream News: 1 hours ago -
RAAF airbase in Roswell, New Mexico is on fire
Aliens and UFOs: 1 hours ago -
What is the white pill?
Philosophy and Metaphysics: 2 hours ago -
Mike Pinder The Moody Blues R.I.P.
Music: 3 hours ago -
Putin, Russia and the Great Architects of the Universe
ATS Skunk Works: 6 hours ago -
A Warning to America: 25 Ways the US is Being Destroyed
New World Order: 10 hours ago
top topics
-
President BIDEN's FBI Raided Donald Trump's Florida Home for OBAMA-NORTH KOREA Documents.
Political Conspiracies: 16 hours ago, 35 flags -
A Warning to America: 25 Ways the US is Being Destroyed
New World Order: 10 hours ago, 19 flags -
Mike Pinder The Moody Blues R.I.P.
Music: 3 hours ago, 7 flags -
What is the white pill?
Philosophy and Metaphysics: 2 hours ago, 5 flags -
Biden "Happy To Debate Trump"
Mainstream News: 1 hours ago, 5 flags -
RAAF airbase in Roswell, New Mexico is on fire
Aliens and UFOs: 1 hours ago, 4 flags -
Putin, Russia and the Great Architects of the Universe
ATS Skunk Works: 6 hours ago, 3 flags -
Ireland VS Globalists
Social Issues and Civil Unrest: 35 minutes ago, 2 flags -
Australian PM says the quiet part out loud - "free speech is a threat to democratic dicourse"...?!
New World Order: 4 minutes ago, 0 flags
active topics
-
Biden "Happy To Debate Trump"
Mainstream News • 19 • : underpass61 -
Ireland VS Globalists
Social Issues and Civil Unrest • 3 • : nugget1 -
Australian PM says the quiet part out loud - "free speech is a threat to democratic dicourse"...?!
New World Order • 0 • : FlyInTheOintment -
What is the white pill?
Philosophy and Metaphysics • 16 • : BrotherKinsMan -
Putin, Russia and the Great Architects of the Universe
ATS Skunk Works • 22 • : SchrodingersRat -
Candidate TRUMP Now Has Crazy Judge JUAN MERCHAN After Him - The Stormy Daniels Hush-Money Case.
Political Conspiracies • 793 • : matafuchs -
University of Texas Instantly Shuts Down Anti Israel Protests
Education and Media • 279 • : cherokeetroy -
Is AI Better Than the Hollywood Elite?
Movies • 22 • : 5thHead -
King Charles 111 Diagnosed with Cancer
Mainstream News • 324 • : Oldcarpy2 -
President Biden is Angry at A.G. Merrick Garland for Not Being Loyal to the Biden Family.
Above Politics • 20 • : WeMustCare