It looks like you're using an Ad Blocker.
Please white-list or disable AboveTopSecret.com in your ad-blocking tool.
Thank you.
Some features of ATS will be disabled while you continue to use an ad-blocker.

New study finds 99.999 percent certainty humans are causing global warming
page: 5share:
a reply to: beezzer
That chart has no source, no date, nor is it possible for "present day" at the extreme right most point on the chart to be after about 1950 as the temperature graphed does not reflect the temperature change measured by thermometers, ergo it is misleading or wrong.
You constructed a strawman to defeat this argument. You accused me of being without facts and being biased to get me to defend that strawman.
I will not and have no reason to defend your strawman. Dig it up yourself. Apologize for your behavior.
edit on 17Thu, 04 Sep 2014 17:51:40
-0500America/ChicagovAmerica/Chicago9 by Greven because: (no reason given)
originally posted by: Greven
a reply to: beezzer
That chart has no source, no date, nor is it possible for "present day" at the extreme right most point on the chart to be after 1950 as the temperature graphed does not reflect the temperature change measured by thermometers, ergo it is misleading or wrong.
So you say. And as you are a climate scientist, you are an expert in all of this I suppose.
You constructed a strawman to defeat this argument. You accused me of being without facts and being biased to get me to defend that strawman.
Wrong. I'm a skeptic. I'm asking you to convince me.
I will not and have no reason to defend your strawman. Dig it up yourself. Apologize for your behavior.
Hold your breath.
a reply to: beezzer
You again make strawmen, for I have never claimed what you allege me to be.
I am not interested in convincing you, because so far as your behavior indicates, you are one of those individuals who forms an opinion and then fits facts into that opinion.
I want you to apologize for constructing strawmen and yet you persist in doing so in this very post.
a reply to: AugustusMasonicus
A wonderful chart. It shows an extended time period.
Provides lots of data.
And is indicative of a cyclic nature.
A wonderful chart. It shows an extended time period.
Provides lots of data.
And is indicative of a cyclic nature.
originally posted by: AugustusMasonicus
a reply to: Greven
Here is a chart (Egyptian era to 2009) which has a similar graph along with annotations and the authors names:
Look how slowly temps rose in the past compared to the dramatic rise lately. Can you explain that with your chart?
Each warming trend on your graph took hundreds of years to achieve the peak, so explain why its rising so fast now as per your graph?
edit on
4-9-2014 by LDragonFire because: (no reason given)
a reply to: LDragonFire
Well, it does say on the 1800's upward leg, 'At least 90 major eruptions', which would appear to be more than in other upward swings based on this graph.
Edit to add: I think we need the solar data to have the other half of their calculations since these two scientists tie them together.
Well, it does say on the 1800's upward leg, 'At least 90 major eruptions', which would appear to be more than in other upward swings based on this graph.
Edit to add: I think we need the solar data to have the other half of their calculations since these two scientists tie them together.
edit on 4-9-2014 by AugustusMasonicus because: networkdude has no beer because his mug got filled with chemtrail residue
originally posted by: SonOfTheLawOfOne
If weather is the measurement of air temperature, moisture level, cloud cover, wind speed, air pressure, etc. for a given place and a given point in time.... and we can't predict it with a great deal of accuracy for a 48 hour period in a given place and time.... and climate is based on how weather varies over the entire planet for extended periods of time... I fail to see how anyone can arrive at the conclusion that anyone, anywhere on this planet, can in any way whatsoever, predict the climate of the planet when we can't even accurately measure and predict the weather, which is far smaller scale with almost the same set of variables.
That question has been answered and answered and answered innumerable times but the ignorant don't want to learn.
The objects of prediction in climate and weather are not the same, and the models, though related are not the same either. It is not necessary to predict whether in 2178 whether it will be sunny or cloudy in Vladivostok (weather prediction) to have some idea about climate prediction which is about averages and physics and patterns.
The people who do this for a living understand it. There is no fundamental scientific problem.
You can't predict what anybody's poker hand at a casino will be. However, you can predict how often kings come up, averaged over time, if you know the properties of the deck.
a reply to: AugustusMasonicus
You have the link to the website for this graph?
Isn't it sort of a stretch to think that we know every single volcanic eruption in the last 4500 years? If we are in a high time for volcanic eruptions, would this be the fear issue the ptb would want to push and not climate change?
You have the link to the website for this graph?
Isn't it sort of a stretch to think that we know every single volcanic eruption in the last 4500 years? If we are in a high time for volcanic eruptions, would this be the fear issue the ptb would want to push and not climate change?
edit on 4-9-2014 by LDragonFire because: (no reason given)
edit on 4-9-2014 by LDragonFire because: (no reason given)
Something else to consider:
Evidence for a Global Warming at the Termination I Boundary and Its Possible Cosmic Dust Cause
So, how much influence do we have on cosmic dust?
Cycles beyond human control?
Ok, so what about methane?
Again, it seems as though methane is a trailing indicator rather than an initiating factor in considering changes in climate.
So the diluting of the salinity is a trailing indicator to fluctuations in temperature.
 (click on thumbnail for larger image)
That's a pretty substantial increase in background cosmic energy density.
But the thing said dust, right?
Got it, space dust. Lots of it everywhere throughout space near stars. Makes sense.
Too regular to be volcanic, got it. Things in space rotate and operate in cyclical patterns.
More space dust, LOTS more. Dust digging out holes in the ozone layer (what no SUVs?), dust adding to the ambient background warmth of near-sol space, dust acting like a lens concentrating solar radiation on the earth, and dust causing the sun to heat up.
Got it, space dust.
hmm
Continued next post.
Evidence for a Global Warming at the Termination I Boundary and Its Possible Cosmic Dust Cause
On the other hand, evidence of an elevated cosmic ray flux and of a major interstellar dust incursion around 15,800 years B.P. suggest that a cosmic ray wind driven incursion of interstellar dust and gas may have played a key role through its activation of the Sun and alteration of light transmission through the interplanetary medium.
So, how much influence do we have on cosmic dust?
emphasis mine
However, since the climatic system incorporates negative feedback relationships which give it some degree of stability and tend to maintain it in a given climatic state, be it glacial or interglacial, destabilizing perturbations must exceed a certain critical size if they are to effect any large-scale change. Those that are too small in magnitude or duration will fail to change the system's prevailing climatic state. Weather noise probably belongs to this subcritical category.
Cycles beyond human control?
emphasis mine
It has been suggested that global synchrony might have been achieved through some kind of interhemispheric linking, such as changes in atmospheric CO2 concentration (Corlis, 1982; Manabe and Broccoli, 1985; Johnson and Andrews, 1986). However, by itself, CO2 produces a relatively small greenhouse warming effect. For example, the Vostok ice core measurements of Barnola et al. (1987) show that at the end of the ice age CO2 concentration rose by 25% from 195 ppm to 260 ppm
Ok, so what about methane?
emphasis mine
Compared with carbon dioxide, methane underwent a much larger percentage increase at the end of the ice age, doubling from about 360 ppb to 725 ppb, as determined from measurements of the Summit, Greenland ice core (Chappellaz et al, 1993). However, since its absolute concentration is 1000 fold less than that of CO2, it is not a major contributor to greenhouse warming. Rather, its increase also is most likely a response to climatic change rather than an instigator, the rise in CH4 concentration being attributed to the increased abundance of vegetation which is a major producer of this gas
Again, it seems as though methane is a trailing indicator rather than an initiating factor in considering changes in climate.
However, studies of benthic foraminifera in the Atlantic suggest that NADW production did not flip to its interglacial high-flux mode until around 12,500 14C yrs B.P., or about 500 14C years after the onset of the Bölling (Jansen and Veum, 1990; Veum et al., 1992; Charles and Fairbanks, 1992). So, the onset of NADW production cannot be the agent that caused the rapid warming at the beginning of the Böllin
So the diluting of the salinity is a trailing indicator to fluctuations in temperature.
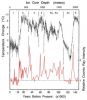
The dramatic climatic shifts that took place during the Pleistocene may have had an extraterrestrial cause. One indication comes from the occurrence in ice age polar ice of high concentrations of 10Be, a 1.5 Myr half-life isotope generated when cosmic ray protons impact nitrogen and oxygen nuclei in the atmosphere (Raisbeck et al., 1981, 1987; Beer et al., 1984a, 1985, 1988, 1992).
...
For example, the profiles shown in Figures 6 and 7 suggest that the cosmic ray background intensity was quite
high on several past occasions.
 (click on thumbnail for larger image)
A variety of evidence indicates that the core of our Galaxy (Sgr A*), which lies 23,000 light years away, releases intense volleys of relativistic electrons about every 10 4 years or so, and that these fronts, or galactic superwaves, travel radially outward through the Galaxy with such minimal dispersion that at the time of their passage they are able to elevate the cosmic ray background energy density in the solar neighborhood as much as 10^2 to 10^3 fold above current levels.
That's a pretty substantial increase in background cosmic energy density.
Galactic superwaves are sufficiently intense and prolonged that they would propel the resulting interstellar/nebular dust and gas into the solar system which would have had a substantial effect on the Earth-Sun climate system.
But the thing said dust, right?
There is plenty of frozen material both in and around the solar system which could be vaporized and propelled into the inner solar system by a Galactic superwave. Observations of infrared excesses in nearby stars suggest that the solar system, like these other star systems, is surrounded by a light-absorbing dust shell, and may contain about 103 times more dust than had been previously supposed on the basis of IRAS observations of the zodiacal dust cloud (Aumann, 1988)
Got it, space dust. Lots of it everywhere throughout space near stars. Makes sense.
The unusually high concentrations of HF and HCl acids found in Byrd Station, Antarctic ice dating about 15,800 year B.P., may be residues from one such interstellar dust incursion. Hammer, et al. (1997) note that it is difficult to explain these eight peaks as having a volcanic origin because the combined acid output which spans a period of about a century exceeds by 18 fold the largest volcanic signal observed in the Byrd ice core record and also because the recurrence of the events is unusually regular, a behavior that is not seen in volcanic eruptions.
Too regular to be volcanic, got it. Things in space rotate and operate in cyclical patterns.
The subsequent deglacial warming could have been due to a combination of factors: a) destruction of the ozone layer due to the presence of interstellar halides allowing UV penetration, b) increase of the solar constant due to light backscattered from the zodiacal dust cloud, c) shift of the incident solar spectrum to the infrared resulting in greater absorption of the solar beam (reduced scattering from high albedo surfaces), and d) a major increase in the Sun's luminosity and activation of its photosphere and corona due to the dust's effect on the Sun (LaViolette, 1983a, 2005).
More space dust, LOTS more. Dust digging out holes in the ozone layer (what no SUVs?), dust adding to the ambient background warmth of near-sol space, dust acting like a lens concentrating solar radiation on the earth, and dust causing the sun to heat up.
Got it, space dust.
Available data suggests that these warmings were initiated neither by changes in atmospheric CO2 concentration nor by a major alteration in the rate of North Atlantic deep-water production. Moreover it is not clear whether these mechanisms are capable of producing warmings and coolings of the kind of magnitude, geographical extent, and abruptness observed at the Termination I boundary. Polar ocean front migrations and weather fluctuations also do not offer an adequate explanation
hmm
Continued next post.
a reply to: LDragonFire
No, I pulled it off Bing but this is the authors site.
Here are some quotes:
No, I pulled it off Bing but this is the authors site.
Here are some quotes:
It seems to me that the climate change debate continues to be obscured by manmade hot air and fury. Deeply entrenched and extremely vociferous positions have been taken on all sides. I’m sort of ‘in the middle of things.’
It remains the firm opinion of this climatologist that the earth’s ever-changing climate is constantly being influenced by naturally-occurring cycles of solar and volcanic activity, sea-surface ocean temperature patterns and, possibly, by cycles of cosmic rays that bombard our planet.
edit on 4-9-2014 by AugustusMasonicus because: networkdude has no beer so I am going to harvest his liver
originally posted by: beezzer
a reply to: mbkennel
Enough.
Okay?
Where's your degree in climate science?
MMM?
Nonexistent?
So only neurosurgeons should believe neurosurgeons?
I'm not one, but I am personally acquainted with a few, and have some basic familiarity with the underlying physical problem and know some, and know enough to listen to them and not impose my opinions (though more informed than the average person's) over confirmed, published research validated by the people who are the real experts. That's the point.
a reply to: AugustusMasonicus
This seems to be the source, yet for some reason you didn't bother to link it:
www.longrangeweather.com...
Look at the temperatures on that chart. 2009 was so much cooler than 2005 When it was actually:
2005 +0.65 degrees Celsius
2006 +0.59 degrees Celsius
2007 +0.62 degrees Celsius
2008 +0.49 degrees Celsius
2009 +0.59 degrees Celsius
2010 +0.66 degrees Celsius
2011 +0.54 degrees Celsius
2012 +0.57 degrees Celsius
2013 +0.59 degrees Celsius
Hahaha that dropoff at 2009 - look out, another ice age coming ahahahaha.
Oh, and as for other dates on record, compare them:
1991 +0.37 degrees Celsius
1981 +0.08 degrees Celsius (it's tied with 1985 for the coldest year from 1979 to 2014)
1883 -0.19 degrees Celsius
I'm going to have to say that at first glance it looks like garbage.
a reply to: jadedANDcynical
That hasn't been published anywhere. And Paul LaViolette in some other areas of physics is a 100% nonsense crank.
It doesn't mean it's wrong, it just means that it's far from definitive and shouldn't be believed unless there is much more credible pubilshed research and general agreement.
That hasn't been published anywhere. And Paul LaViolette in some other areas of physics is a 100% nonsense crank.
It doesn't mean it's wrong, it just means that it's far from definitive and shouldn't be believed unless there is much more credible pubilshed research and general agreement.
edit on 4-9-2014 by mbkennel because: (no reason given)
a reply to: beezzer
Yet another crap chart with no source data, you mean.
Oh right, you just went ahead and believed it to be true just as you did with the last chart which was crap.
Didn't you just complain about science doing that?
Are you ever going to apologize for your libelous remarks and strawmen, or is your behavior representative of your maturity?
edit on 18Thu, 04
Sep 2014 18:17:27 -0500America/ChicagovAmerica/Chicago9 by Greven because: (no reason given)
originally posted by: beezzer
a reply to: mbkennel
I know a rocket scientist.
Really.
(It don't make me a rocket scientist)
(really)
Exactly my point! And you wouldn't mock rocket scientists who said why rockets work or don't work, but with climate, because the experts are telling people unpleasant truths with political consequences, whatever the geophysical scientists say, well, screw them and their ideas?
originally posted by: LDragonFire
originally posted by: AugustusMasonicus
a reply to: Greven
Here is a chart (Egyptian era to 2009) which has a similar graph along with annotations and the authors names:
Look how slowly temps rose in the past compared to the dramatic rise lately. Can you explain that with your chart?
Each warming trend on your graph took hundreds of years to achieve the peak, so explain why its rising so fast now as per your graph?
The sharper rises and falls are because the data comes from direct measurement, such as thermometers and other instruments for measuring weather / climate. That began early-mid 1800's, which is why you see the sharper peaks and valleys after that date.
Prior to that, all of the data comes from ice cores, tree rings and plant stomata and is inferred at lower resolutions. What that means, is that while we can measure day to day or year to year, tree rings and ice cores gives us 5-10 years for example. This creates a "smoothing" in the data, which is where you lose precision and details, such as extreme swings one way or the other.
~Namaste
originally posted by: Greven
a reply to: beezzer
Yet another crap chart with no source you mean.
So you don't believe in a cyclic nature of climate?
Oh right, you just went ahead and believed it to be true just as you did with the last chart which was crap.
That's because I believe in a cyclic nature of climate.
Didn't you just complain about science doing that?
True! When I see science that validates what I believe, I'm more likely to believe that data.
As you will believe the data that supports your beliefs and negate any data that doesn't support your beliefs. As seen in this thread.
Are you ever going to apologize for your libelous remarks and strawmen, or is your behavior representative of your maturity?
Are you still holding your breath?
new topics
-
Where should Trump hold his next rally
2024 Elections: 2 hours ago -
Shocking Number of Voters are Open to Committing Election Fraud
US Political Madness: 2 hours ago -
Gov Kristi Noem Shot and Killed "Less Than Worthless Dog" and a 'Smelly Goat
2024 Elections: 3 hours ago -
Falkville Robot-Man
Aliens and UFOs: 3 hours ago -
James O’Keefe: I have evidence that exposes the CIA, and it’s on camera.
Whistle Blowers and Leaked Documents: 4 hours ago -
Australian PM says the quiet part out loud - "free speech is a threat to democratic dicourse"...?!
New World Order: 5 hours ago -
Ireland VS Globalists
Social Issues and Civil Unrest: 5 hours ago -
Biden "Happy To Debate Trump"
2024 Elections: 6 hours ago -
RAAF airbase in Roswell, New Mexico is on fire
Aliens and UFOs: 6 hours ago -
What is the white pill?
Philosophy and Metaphysics: 8 hours ago
top topics
-
A Warning to America: 25 Ways the US is Being Destroyed
New World Order: 16 hours ago, 21 flags -
James O’Keefe: I have evidence that exposes the CIA, and it’s on camera.
Whistle Blowers and Leaked Documents: 4 hours ago, 12 flags -
Blast from the past: ATS Review Podcast, 2006: With All Three Amigos
Member PODcasts: 8 hours ago, 12 flags -
Australian PM says the quiet part out loud - "free speech is a threat to democratic dicourse"...?!
New World Order: 5 hours ago, 11 flags -
Biden "Happy To Debate Trump"
2024 Elections: 6 hours ago, 10 flags -
Mike Pinder The Moody Blues R.I.P.
Music: 8 hours ago, 8 flags -
Ireland VS Globalists
Social Issues and Civil Unrest: 5 hours ago, 5 flags -
RAAF airbase in Roswell, New Mexico is on fire
Aliens and UFOs: 6 hours ago, 5 flags -
What is the white pill?
Philosophy and Metaphysics: 8 hours ago, 5 flags -
Putin, Russia and the Great Architects of the Universe
ATS Skunk Works: 11 hours ago, 4 flags
active topics
-
Where should Trump hold his next rally
2024 Elections • 12 • : StudioNada -
University of Texas Instantly Shuts Down Anti Israel Protests
Education and Media • 310 • : SchrodingersRat -
Candidate TRUMP Now Has Crazy Judge JUAN MERCHAN After Him - The Stormy Daniels Hush-Money Case.
Political Conspiracies • 815 • : Annee -
President BIDEN's FBI Raided Donald Trump's Florida Home for OBAMA-NORTH KOREA Documents.
Political Conspiracies • 35 • : Threadbarer -
Remember These Attacks When President Trump 2.0 Retribution-Justice Commences.
2024 Elections • 58 • : WeMustCare -
2024 Pigeon Forge Rod Run - On the Strip (Video made for you)
Automotive Discussion • 8 • : WhitewaterSquirrel -
Gov Kristi Noem Shot and Killed "Less Than Worthless Dog" and a 'Smelly Goat
2024 Elections • 28 • : cherokeetroy -
Shocking Number of Voters are Open to Committing Election Fraud
US Political Madness • 5 • : AwakeNotWoke -
The Acronym Game .. Pt.3
General Chit Chat • 7756 • : bally001 -
RAAF airbase in Roswell, New Mexico is on fire
Aliens and UFOs • 8 • : Skinnerbot