It looks like you're using an Ad Blocker.
Please white-list or disable AboveTopSecret.com in your ad-blocking tool.
Thank you.
Some features of ATS will be disabled while you continue to use an ad-blocker.

New study finds 99.999 percent certainty humans are causing global warming
page: 14share:
originally posted by: Kali74
a reply to: AugustusMasonicus
They aren't deceptive methods, that is the point. They are methods widely, almost exclusively used in data presentation.
Just because they are widely used, doesn't make them right.
That is called Argumentum ad Populum, and is exactly what is wrong with this entire debate.
From another post... let me exemplify why homogenization slips by, more than it is deceptive, it CAN be an honest mistake, but can also be an intentional oversight.
Take a look at this graph... (which is widely used, much like the Mauna Loa data)
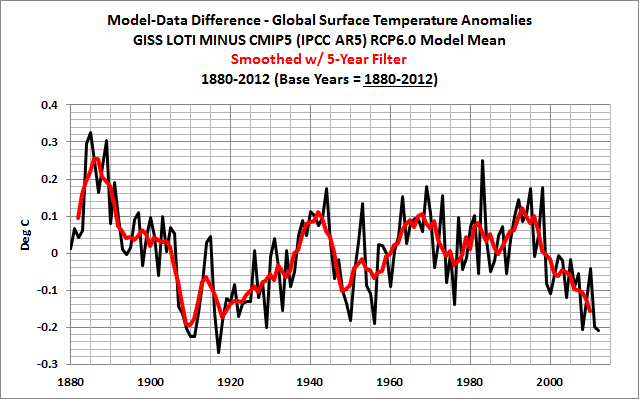
Notice how the 1990-1995 (red line) appears to be slightly HIGHER than the 1980-1985 segment, when very clearly in the RAW DATA (the black line), there is a much higher spike in that time frame.
If I gave you JUST the red line in the graph, you would NEVER know about that spike, which could be of critical importance if you are being asked something like "what was the peak in the last 50 years?" - your answer on the red line, would be "somewhere around 1992-1993", but if you were looking at the raw data, it would be 1982-1983.
This is a real-life example of how PROXIES are determined. They are completely based on smoothing, and are used EVERYWHERE in climate models. In fact, any temperature data or CO2 prior to the 1850's (and even after) comes from PROXIES, not from actual measurements or observations. The "spikes" are never seen in them and are often post-processed with a FFT to remove them.
So then... what happens when you feed that same data into a climate model? How can that model possibly be correct and predict with any accuracy, what would happen with fictional data?
More importantly, how are you OK with your politicians and representatives making decisions and policies based on those same models that use fictitious data?
To change your life and the lives of everyone you know, when very clearly, important clues, facts, and data have been removed, out of an intent that you nor I can possibly know or understand?
That's where most people won't bend. It doesn't have to be deceptive to be wrong, that is the point I'm trying to make. I'm not painting scientists on either side of the debate as having clean hands when it comes to the data they use, they are both guilty of this problem. It's just more obvious and rampant on the CAGW and AGW side of the argument.
~Namaste
edit on 7-9-2014 by SonOfTheLawOfOne because: (no reason given)
a reply to: Kali74
Nothing deceptive about this:
Hockey stick graph, or what I did to change history
Nothing whatsoever. It's done every day in data presentation. I mean, if the numbers do not show what I want, I will just change them. Nothing deceptive, nothing unethical about that, right?
Nothing deceptive about this:
Hockey stick graph, or what I did to change history
Nothing whatsoever. It's done every day in data presentation. I mean, if the numbers do not show what I want, I will just change them. Nothing deceptive, nothing unethical about that, right?
a reply to: bbracken677
What is deceptive about that? The IPCC graph is from 1990 the "Hockey-stick" graph is from 2001 and is an accurate representation of the temperature increase in that time period.
What is deceptive about that? The IPCC graph is from 1990 the "Hockey-stick" graph is from 2001 and is an accurate representation of the temperature increase in that time period.
a reply to: SonOfTheLawOfOne
But you had been painting it as deceptive. I don't really have time at the moment to verify particular year spans but one of the reasons for smoothing is to toss out events like ENSO because no one is trying to measure strictly temperature increase or decrease but GHG warming, the climate models don't need to be fed data about such events because it then taints the picture that is trying to emerge. The reasons the models output 'accurate' pictures is because when looking backwards and comparing actual history to predictions those events are factored out there too, and subsequently we can then look at any climate events that did happen in the time frame and explain warming that didn't show in the models or why expected warming didn't happen.
I also haven't had time to look at your previous links so I don't know anything about where this refutation of smoothing comes from, legitimate science or woo-woo science... but I'll give it the benefit of the doubt and assume it comes from legitimate science. If, as you state, that smoothing yields complete inaccuracy why hasn't science been turned on its head? I assume also that you understand the personality types of scientists and that the need to be accurate and correct wouldn't be able to resist that turning of science on its head, to be the firsts at disproving/proving/confirming everything in science history. I just can't imagine that if it had legs to stand on that the science community would just sit on it.
The planet is not going anywhere, it will do fine.
We, however, well, that's a different story
We, however, well, that's a different story
edit on 7-9-2014 by jajaja because: (no reason given)
a reply to: Kali74
You missed the part, I suppose, about the "reduced" temps from the medieval warming period. In the first graph modern warming had not reached the level of the medieval period, yet in the hockey stick graph the medieval period is much lower.
In other words, in the 2nd graph it's a clear "see what man has done" whereas the other (the accurate 1990 graph) you cannot see anything particularly unusual with the current trend. Well within natural occurrence and not pointing directly at something man has done.
Look at the graphs again. They supposedly show the same basic time frame, but one is much "smoother' than the other resulting in, what appears to be, unnatural warming during the industrial era. This is the hockey stick graph. This is the graph that once the deception became known, the IPCC yanked the graph from their site and from presentations. Clearly a misrepresentation of the facts. Or it could be stated as clearly a lie.
a reply to: jajaja
Claims that global warming will be the end of man are vastly exaggerated. Warmer periods than ours today were periods in which life was more diverse, more plentiful than today. It is glaciation that is harmful to life, shall we say, due to drier climates and extreme cold. Mankind came the closest to extinction during the last major period of glacial growth. It has been warmer than today during man's history...not prehistory, but history. How much warmer was it during the medieval warming period compared to today? Was man inconvenienced?
Claims that global warming will be the end of man are vastly exaggerated. Warmer periods than ours today were periods in which life was more diverse, more plentiful than today. It is glaciation that is harmful to life, shall we say, due to drier climates and extreme cold. Mankind came the closest to extinction during the last major period of glacial growth. It has been warmer than today during man's history...not prehistory, but history. How much warmer was it during the medieval warming period compared to today? Was man inconvenienced?
a reply to: bbracken677
Mann didn't just decide to lower the temperatures of MWP to make 20th century warming look worse than it was... his graph was based on new (accepted) information combined with previous information about that period.
Link
Mann didn't just decide to lower the temperatures of MWP to make 20th century warming look worse than it was... his graph was based on new (accepted) information combined with previous information about that period.
Link
Abstract
A frequent conclusion based on study of individual records from the so-called Medieval Warm Period (∼1000-1300 A.D.) is that the present warmth of the 20 th century is not unusual and therefore cannot be taken as an indication of forced climate change from greenhouse gas emissions. This conclusion is not supported by published composites of Northern Hemisphere climate change, but the conclusions of such syntheses are often either ignored or challenged. In this paper, we revisit the controversy by incorporating additional time series not used in earlier hemispheric compilations. Another difference is that the present reconstruction uses records that are only 900–1000 years long, thereby, avoiding the potential problem of uncertainties introduced by using different numbers of records at different times. Despite clear evidence for Medieval warmth greater than present in some individual records, the new hemispheric composite supports the principal conclusion of earlier hemispheric reconstructions and, furthermore, indicates that maximum Medieval warmth was restricted to two-three 20–30 year intervals, with composite values during these times being only comparable to the mid-20 th century warm time interval. Failure to substantiate hemispheric warmth greater than the present consistently occurs in composites because there are significant offsets in timing of warmth in different regions; ignoring these offsets can lead to serious errors concerning inferences about the magnitude of Medieval warmth and its relevance to interpretation of late 20 th century warming.
a reply to: Kali74
The climate models being used are NOT accurate. In fact they are inherently inaccurate to a degree that it is clear that there are major problems with the model.
The scientific method must not be at play either, since if one's model cannot accurately predict actual measurements of the phenomena, then by definition one must correct the model and test again until it does accurately predict measurable results. This is, apparently, not happening. Specially since they keep presenting data from the model predicting climate 100 years out.
The model did not predict the last 15 years of relatively flat temps. The model did not predict the growth of ice coverage at the South Pole. The model most assuredly did not predict this past year's growth of the northern ice cap either.
But we should accept blindly the prediction 100 years out......
a reply to: Kali74
"New and accepted data" which has been debunked. This is why you will never see the hockey graph used by the IPCC again.
It was during the medieval warming period when Greenland was actually green. Is Greenland green today?
I call that outright manipulation of data to support your conclusions (or agenda). I call that lying.
If one does that in one's workplace, I wonder how long it would be before one was fired? Answer: As soon as the deception comes to light.
edit on 7-9-2014 by bbracken677 because: (no reason given)
a reply to: bbracken677
That data has not been debunked. The accepted analysis of the MWP now is that some regions were warmer than global temperatures now but the actual global temperature was cooler than now.
That data has not been debunked. The accepted analysis of the MWP now is that some regions were warmer than global temperatures now but the actual global temperature was cooler than now.
I shall wait for 99.9999% confirmation.
We need to be absolutely sure about these things.
.
We need to be absolutely sure about these things.
.
edit on 7-9-2014 by jajaja because: (no reason given)
a reply to: AugustusMasonicus
What about deception on the part of the opposition, as illustrated in this post?
I have yet to see solid proof that, for example, Al Gore said the ice cap would be melted. When I questioned this, I was provided with was instead a video where he said this, back in Dec. 2009:
Which is not at all what people keep claiming he said. Sounds like deception to me. So how about it - where did Gore say Florida would be underwater?
What about deception on the part of the opposition, as illustrated in this post?
I have yet to see solid proof that, for example, Al Gore said the ice cap would be melted. When I questioned this, I was provided with was instead a video where he said this, back in Dec. 2009:
Some of the models suggest to Dr. Maslowski that there is a 75% chance that the entire north polar ice cap during summer... during some of the summer months could be completely ice free within the next 5 to 7 years. Bob used a figure of 2030, and the volumetric analysis leads this... Dr. Maslowski to make that projection.
Which is not at all what people keep claiming he said. Sounds like deception to me. So how about it - where did Gore say Florida would be underwater?
edit on 13Sun, 07 Sep 2014 13:38:23 -0500America/ChicagovAmerica/Chicago9 by Greven because: (no reason given)
originally posted by: Greven
What about deception on the part of the opposition, as illustrated in this post?
Take it up with him. What people post on this site is not driving government policy.
I have yet to see solid proof that, for example, Al Gore said the ice cap would be melted.
Did I mention ice caps?
So how about it - where did Gore say Florida would be underwater?
In his mockumentary he shows Florida being inundated.
I've made this point elsewhere, but for the benefit of our American populace, I'd like to make it again as they often seem to be under the impression
that America is the only place in the world.
The hottest month, on average, is March. The coolest month, on average, is June (or since 1979, July).
The hottest month ever was January. Why is this?
The Earth is closest to the Sun in January (perihelion is around the 3rd), and furthest from the Sun in July (aphelion is around the 4th).
What "mockumentary" and, no link at all?
The hottest month, on average, is March. The coolest month, on average, is June (or since 1979, July).
The hottest month ever was January. Why is this?
The Earth is closest to the Sun in January (perihelion is around the 3rd), and furthest from the Sun in July (aphelion is around the 4th).
originally posted by: AugustusMasonicus
In his mockumentary he shows Florida being inundated.
What "mockumentary" and, no link at all?
edit on 13Sun, 07 Sep 2014 13:47:52 -0500America/ChicagovAmerica/Chicago9 by Greven because: (no
reason given)
a reply to: bbracken677
ancientstandard.com...
No. Greenland has not been green for many tens of thousands of years (if ever).
It was during the medieval warming period when Greenland was actually green. Is Greenland green today?
Of course, when you tell someone that they will be travelling with you to a place that is barren, cold and inhospitable you may have trouble convincing even a Viking to come with you. So instead, Erik (according to popular legend) called the island Greenland and instead painted the island as being a wonderful place to settle.
There are other theories as to how Greenland got its name. One theory is that the “green” in Greenland is actually a translation error. The word “grunt” actually means ground and it could be that Greenland was meant to be named Gruntland (or ground land).
ancientstandard.com...
edit on 9/7/2014 by Phage because: (no reason given)
a reply to: AugustusMasonicus
Can't say I've ever seen that or read Gore's book, but it seems from discussion of it that there was a predicted 20 foot rise of sea levels in the (undefined) near future. Correct me if I'm wrong on that count.
From the rate of rise that we have now, that's rather far in the future, so the claim that it is in the near future is pretty dumb.
new topics
-
BIDEN Admin Begins Planning For January 2025 Transition to a New President - Today is 4.26.2024.
2024 Elections: 3 hours ago -
Big Storms
Fragile Earth: 5 hours ago -
Where should Trump hold his next rally
2024 Elections: 7 hours ago -
Shocking Number of Voters are Open to Committing Election Fraud
US Political Madness: 8 hours ago -
Gov Kristi Noem Shot and Killed "Less Than Worthless Dog" and a 'Smelly Goat
2024 Elections: 9 hours ago -
Falkville Robot-Man
Aliens and UFOs: 9 hours ago -
James O’Keefe: I have evidence that exposes the CIA, and it’s on camera.
Whistle Blowers and Leaked Documents: 10 hours ago -
Australian PM says the quiet part out loud - "free speech is a threat to democratic dicourse"...?!
New World Order: 11 hours ago -
Ireland VS Globalists
Social Issues and Civil Unrest: 11 hours ago
top topics
-
James O’Keefe: I have evidence that exposes the CIA, and it’s on camera.
Whistle Blowers and Leaked Documents: 10 hours ago, 17 flags -
Australian PM says the quiet part out loud - "free speech is a threat to democratic dicourse"...?!
New World Order: 11 hours ago, 15 flags -
Blast from the past: ATS Review Podcast, 2006: With All Three Amigos
Member PODcasts: 14 hours ago, 13 flags -
Biden "Happy To Debate Trump"
2024 Elections: 12 hours ago, 13 flags -
Ireland VS Globalists
Social Issues and Civil Unrest: 11 hours ago, 10 flags -
Mike Pinder The Moody Blues R.I.P.
Music: 14 hours ago, 8 flags -
BIDEN Admin Begins Planning For January 2025 Transition to a New President - Today is 4.26.2024.
2024 Elections: 3 hours ago, 7 flags -
What is the white pill?
Philosophy and Metaphysics: 13 hours ago, 6 flags -
Shocking Number of Voters are Open to Committing Election Fraud
US Political Madness: 8 hours ago, 6 flags -
Big Storms
Fragile Earth: 5 hours ago, 6 flags
active topics
-
Gov Kristi Noem Shot and Killed "Less Than Worthless Dog" and a 'Smelly Goat
2024 Elections • 63 • : GENERAL EYES -
Mood Music Part VI
Music • 3113 • : MRTrismegistus -
BIDEN Admin Begins Planning For January 2025 Transition to a New President - Today is 4.26.2024.
2024 Elections • 20 • : BustedBoomer -
One Flame Throwing Robot Dog for Christmas Please!
Weaponry • 12 • : worldstarcountry -
RAAF airbase in Roswell, New Mexico is on fire
Aliens and UFOs • 13 • : Ophiuchus1 -
President BIDEN's FBI Raided Donald Trump's Florida Home for OBAMA-NORTH KOREA Documents.
Political Conspiracies • 40 • : BingoMcGoof -
Australian PM says the quiet part out loud - "free speech is a threat to democratic dicourse"...?!
New World Order • 7 • : 19Bones79 -
It takes One to Be; Two to Tango; Three to Create.
Philosophy and Metaphysics • 8 • : Compendium -
Big Storms
Fragile Earth • 16 • : rickymouse -
James O’Keefe: I have evidence that exposes the CIA, and it’s on camera.
Whistle Blowers and Leaked Documents • 14 • : 19Bones79