It looks like you're using an Ad Blocker.
Please white-list or disable AboveTopSecret.com in your ad-blocking tool.
Thank you.
Some features of ATS will be disabled while you continue to use an ad-blocker.

Stunning satellite images show summer ice cap is thicker
page: 3share:
originally posted by: jadedANDcynical
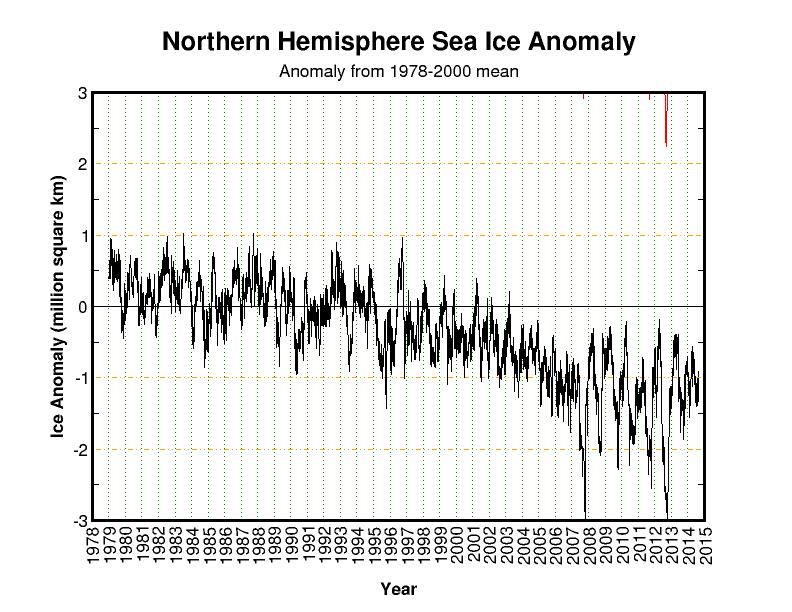
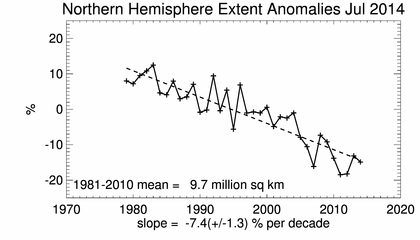
Northern sea ice anomaly:
Yes, a distinct downward trend. There is no denying the sea ice in the northern hemisphere is markedly less than in prior years.
What's that?
You say the earth has two hemispheres?
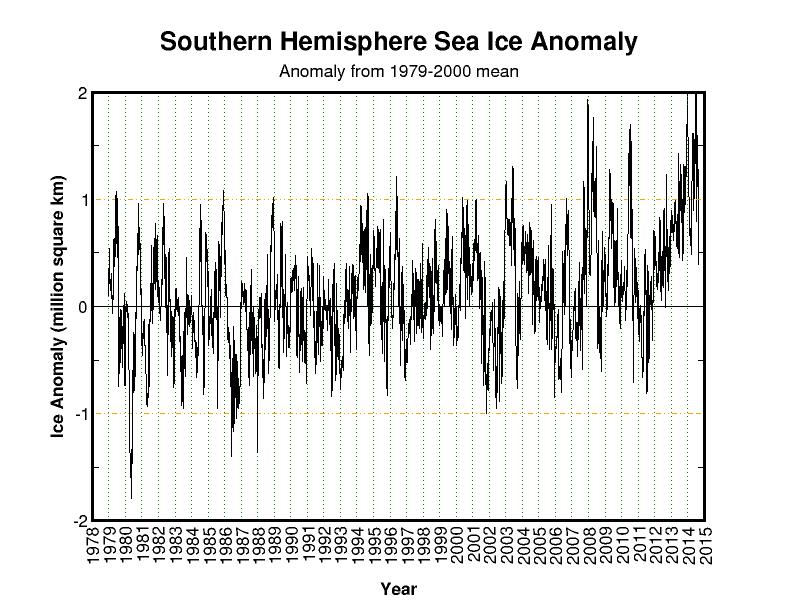
Well golly gee, what is happening to sea ice in that other hemisphere?
You mean to say that there appears to be a distinct upward trend? Say it ain't so...
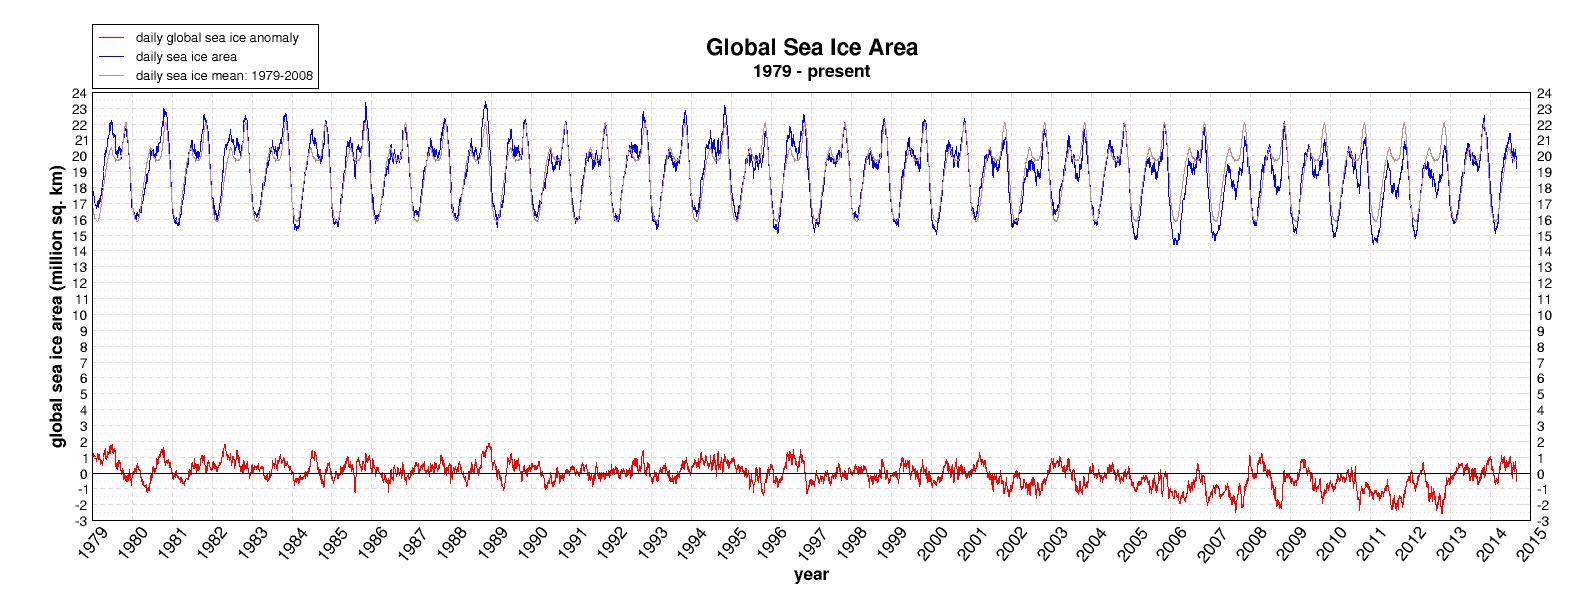
What does that mean for the entire globe then?
Don't tell me...
It's fluctuating within a standard range?
Nah, you've got to be mistaken.
Those charts have to be wrong. Oh, wait, they're from Cryosphere Today? hmmmm...
Great presentation of of a correlation that goes mostly and purposely ignored, so I applaud you for presenting evidence that shows that there is at least parts of the climate story that are still untold.
You will of course, be attacked on this thread, for having a difference in perspective and using facts to show why.
While people focus on how much ice is lost in ONE specific location, they aren't looking at total ice cover on the entire planet, and how seasonal variations all over the world contribute to ups and downs, however as you have shown, the average is steady. Just because the Arctic is losing ice, doesn't mean it is not being regained or replaced elsewhere on the planet, keeping the TOTAL water / ice balance in check.
It's like an hourglass. The total sand in the hourglass never changes, it just MOVES, so as to stay balanced, with the hourglass DESIGNED to allow a certain amount of sand to move in a given amount of time. But our planet couldn't be smart enough to keep itself in balance....
For those citing Neil Degrasse Tyson as a "destroyer of AGW skeptics"... shame on you. He simply regurgitates what the rest of the AGW community claims have been. When the guy goes toe-to-toe, fact-for-fact with the big climate folks (he is NOT a climate scientist, he is an astrophysicist and a "science communicator" by profession) and can stand up a solid argument, I'll put my eggs in a different basket, but he's not the guy I'm betting on.
He's a mouth-piece for the paid academia community, not a free and independent thinking scientist. He didn't even finish his PhD because the committee was dissolved, and instead, got his degree in PHILOSOPHY on physics. He is a PHILOSOPHER, with a doctorate of Philosophy in astrophysics.
Just because he narrated COSMOS doesn't make him Einstein, nor does it give him any more weight to what he says than any other AGW supporter.
~Namaste
edit on 1-9-2014 by SonOfTheLawOfOne because: (no reason given)
originally posted by: jadedANDcynical
a reply to: Kali74
Except that sea ice is sea ice, and if sea ice is being lost one place while growing elsewhere the you have roughly the same amount of sea ice you began with.
I'm not saying we aren't harming our planet, in fact I've been pretty vocal about the messes we've made. I just don't think my suv is doing the same amount of damage that BP, Exxon, and TEPCO have and contnue to do.
Except they are in opposite parts of the world, having different affects on different climate systems. It's not simply a matter of sea ice being sea ice.
You are of course correct that you driving your SUV isn't damaging the planet as much as a big oil companies. But you are buying their product and in greater quantity because of the vehicle you chose. Just sayin.
Still better than having the liberals take our money that we work hard for and give it to illegal aliens, "artists" and "critical thinkers" to
stay at home and "think"
a reply to: UnderKingsPeak
a reply to: UnderKingsPeak
a reply to: xuenchen
So what you said was:
What you use as a source for this claim, the video, has Al Gore saying (in Dec. 2009):
Which really isn't what you just said he claimed at all, so kindly refrain from stating such in the future.
So what you said was:
originally posted by: xuenchen
Al Gore said the ice cap would be long gone by now.
What you use as a source for this claim, the video, has Al Gore saying (in Dec. 2009):
Some of the models suggest to Dr. Maslowski that there is a 75% chance that the entire north polar ice cap during summer... during some of the summer months could be completely ice free within the next 5 to 7 years. Bob used a figure of 2030, and the volumetric analysis leads this... Dr. Maslowski to make that projection.
Which really isn't what you just said he claimed at all, so kindly refrain from stating such in the future.
a reply to: jadedANDcynical
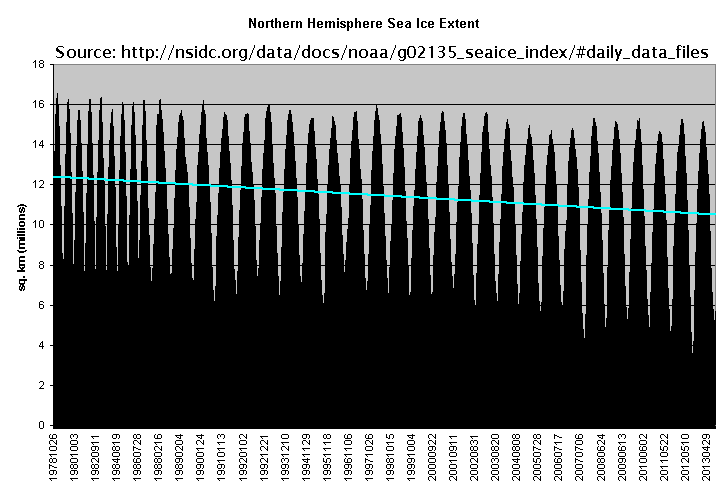
Since you have no trend line in those charts, let me help you out.
Northern Hemisphere
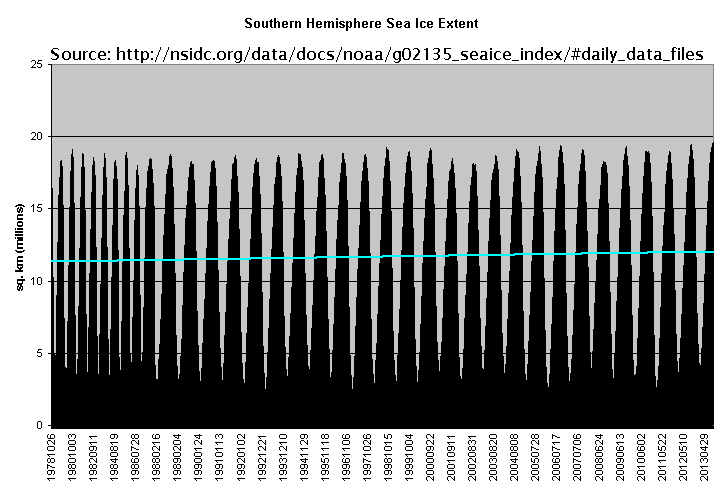
Southern Hemisphere
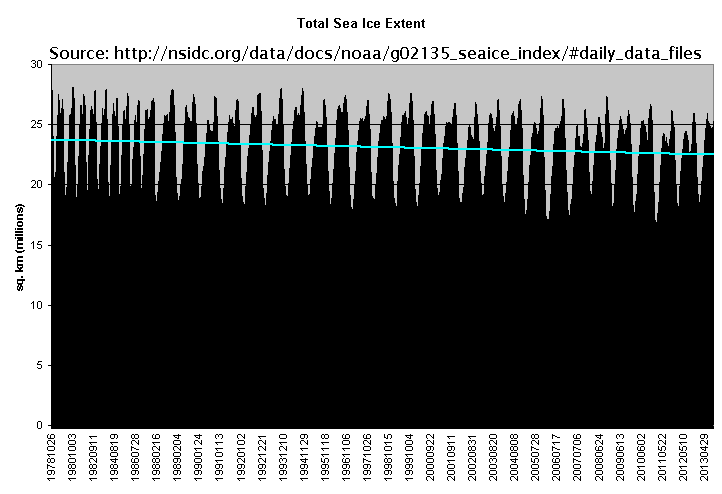
Total Sea Ice Extent
Since you have no trend line in those charts, let me help you out.
Northern Hemisphere
Southern Hemisphere
Total Sea Ice Extent
a reply to: Kali74
Granted, there are several differences between the two:
Make note of the beginning sentence, where it states that the main factor is due to "their different geography," or the fact of where they are not what they are or how they're constituted.
One thing that has to occur regardless of location, wind, current patterns, etc is that the region has to get cold enough for the ice to form in the first place; then all those other factors come in to play.
Arctic vs. Antarctic
And the products I (and most others) are buying from those companies could be replaced with hemp derivatives; as could many petroleum by-products if we would re-engineer our technologies around that as opposed petroleum products.
But that's a bit off topic a better suited to a different thread.
Back to sea ice:

Sea Ice Index
These two graphs show the same pattern, decrease in the north with an increase in the south, however it does appear as though it is not offset as much and thus a general downward trend can be inferred.
I still think that there are variables that the models do not take into account which would better explain major shifts in climate than whatever supposed long-term affect is being attributed to humans.
Except they are in opposite parts of the world, having different affects on different climate systems. It's not simply a matter of sea ice being sea ice.
Granted, there are several differences between the two:
Sea ice differs between the Arctic and Antarctic, primarily because of their different geography. The Arctic is a semi-enclosed ocean, almost completely surrounded by land. As a result, the sea ice that forms in the Arctic is not as mobile as sea ice in the Antarctic. Although sea ice moves around the Arctic basin, it tends to stay in the cold Arctic waters. Floes are more prone to converge, or bump into each other, and pile up into thick ridges. These converging floes makes Arctic ice thicker. The presence of ridge ice and its longer life cycle leads to ice that stays frozen longer during the summer melt. So some Arctic sea ice remains through the summer and continues to grow the following autumn. Of the 15 million square kilometers (5.8 million square miles) of sea ice that exist during winter, on average, 7 million square kilometers (2.7 million square miles) remain at the end of the summer melt season.
Make note of the beginning sentence, where it states that the main factor is due to "their different geography," or the fact of where they are not what they are or how they're constituted.
One thing that has to occur regardless of location, wind, current patterns, etc is that the region has to get cold enough for the ice to form in the first place; then all those other factors come in to play.
Arctic vs. Antarctic
You are of course correct that you driving your SUV isn't damaging the planet as much as a big oil companies. But you are buying their product and in greater quantity because of the vehicle you chose. Just sayin.
And the products I (and most others) are buying from those companies could be replaced with hemp derivatives; as could many petroleum by-products if we would re-engineer our technologies around that as opposed petroleum products.
But that's a bit off topic a better suited to a different thread.
Back to sea ice:
Sea Ice Index
These two graphs show the same pattern, decrease in the north with an increase in the south, however it does appear as though it is not offset as much and thus a general downward trend can be inferred.
I still think that there are variables that the models do not take into account which would better explain major shifts in climate than whatever supposed long-term affect is being attributed to humans.
One other thing I would like to point out - much discussion revolves around the Arctic and Antarctic sea ice. This completely overlooks land ice in
both places.
Greenland and Antarctica are losing ice on land, and have been for some time. One of the most precise instruments measuring these areas now is the CryoSat-2, but it has only been in orbit for 4 years. So far, melting is worse than anticipated - here's the abstract:
Unmentioned is Antarctica's changes, which would be about −128 ± 83 km3 yr−1.
Greenland and Antarctica are losing ice on land, and have been for some time. One of the most precise instruments measuring these areas now is the CryoSat-2, but it has only been in orbit for 4 years. So far, melting is worse than anticipated - here's the abstract:
This study focuses on the present-day surface elevation of the Greenland and Antarctic ice sheets. Based on 3 years of CryoSat-2 data acquisition we derived new elevation models (DEMs) as well as elevation change maps and volume change estimates for both ice sheets. Here we present the new DEMs and their corresponding error maps. The accuracy of the derived DEMs for Greenland and Antarctica is similar to those of previous DEMs obtained by satellite-based laser and radar altimeters. Comparisons with ICESat data show that 80% of the CryoSat-2 DEMs have an uncertainty of less than 3 m ± 15 m. The surface elevation change rates between January 2011 and January 2014 are presented for both ice sheets. We compared our results to elevation change rates obtained from ICESat data covering the time period from 2003 to 2009. The comparison reveals that in West Antarctica the volume loss has increased by a factor of 3. It also shows an anomalous thickening in Dronning Maud Land, East Antarctica which represents a known large-scale accumulation event. This anomaly partly compensates for the observed increased volume loss of the Antarctic Peninsula and West Antarctica. For Greenland we find a volume loss increased by a factor of 2.5 compared to the ICESat period with large negative elevation changes concentrated at the west and southeast coasts. The combined volume change of Greenland and Antarctica for the observation period is estimated to be −503 ± 107 km3 yr−1. Greenland contributes nearly 75% to the total volume change with −375 ± 24 km3 yr−1.
Unmentioned is Antarctica's changes, which would be about −128 ± 83 km3 yr−1.
edit on 14Mon, 01 Sep 2014 14:02:43
-0500America/ChicagovAmerica/Chicago9 by Greven because: (no reason given)
a reply to: Greven
Anyone who actually wanted to study the planet PROPERLY must feel like an idiot with all of this incomplete data.
And the rest of the scientists that THINK they know what they are doing just are not capable, or ALLOWED to do things in any real situation, like looking at everything, instead, they use all kinds of basically meaningless studies, that accomplish nothing but line the pockets of whomever is chosen at the time.
Get a grip and realize that likely some agencies exist that actually know EXACTLY what is going on, when , and how, PRECISELY, and these are behind the efforts to make sure YOU NEVER WILL.
Gore is the devil. Any Government authority that wants to take more of yours, you have to apply the Gore logic to it and just say no.. Right out of
the gate, just think of Al Gore and you won't have to put any more thought into it.
a reply to: xuenchen
The “sea ice” grows as the “land ice” shrinks. It has to do with the amount of fresh water intrusion into the salinity driven gulf stream currents. I'm not sure that Gore ever stated that the arctic sea ice would disappear, he was worried about the land ice. The land ice is what raises the global sea levels, the sea ice is already accounted for in the sea level. Anyway, as the gulf stream slows, it will cause harsher winters in certain areas, and greater fluctuations (both ways) in the sea ice levels.
Climate deniers, and their lobbyists, love to muddy the waters by using “Sea ice” and “land ice” as though they are interchangeable. It seems that the common public is generally unable to differentiate between the different types of ice, so they use this tactic in the press to hide the real facts. This is why folks need to start listening to the real science community (not the paid for lobbyist scientists who represent the fossil fuel industry), such as those at NASA, NOAA, etc...
www.slate.com...
and here's the rebuttal to Daily Mail
and here's the rebuttal to Daily Mail
edit on 1-9-2014 by Cyruay because: (no reason given)
Having looked into this before, I recall another aspect to this issue that has not been considered; deep ocean warming:
Important role for ocean warming and increased ice-shelf melt in Antarctic sea-ice expansion
So we have an expansion of sea ice area due to the greater amount of freshwater floating on top of the ocean which is a result of deep ocean warming melting the base of the ice sheets.
The next thing one wonders is how much and what other impact this would have.
So this deep sea warming represents a significant change in global sea level as well as a portion of global energy; is it enough that more scrutiny needs to be applied to climate models?
It would seem that the answer to that questuon is "yes."
Warming of Global Abyssal and Deep Southern Ocean Waters between the 1990s and 2000s: Contributions to Global Heat and Sea Level Rise Budgets
So the IPCC doesn't take solar irradiance or deep ocean warming into account for it's climate models?
Is it possible those two variables might outweigh at least some of the impact humans have on the climate?
In contrast to Arctic sea ice, sea ice surrounding Antarctica has expanded1, with record extent2 in 2010. This ice expansion has previously been attributed to dynamical atmospheric changes that induce atmospheric cooling3. Here we show that accelerated basal melting of Antarctic ice shelves is likely to have contributed significantly to sea-ice expansion. Specifically, we present observations indicating that melt water from Antarctica’s ice shelves accumulates in a cool and fresh surface layer that shields the surface ocean from the warmer deeper waters that are melting the ice shelves.
Important role for ocean warming and increased ice-shelf melt in Antarctic sea-ice expansion
So we have an expansion of sea ice area due to the greater amount of freshwater floating on top of the ocean which is a result of deep ocean warming melting the base of the ice sheets.
The next thing one wonders is how much and what other impact this would have.
The abyssal warming produces a 0.053 (±0.017) mm yr−1 increase in global average sea level and the deep warming south of the Subantarctic Front adds another 0.093 (±0.081) mm yr−1. Thus, warming in these regions, ventilated primarily by Antarctic Bottom Water, accounts for a statistically significant fraction of the present global energy and sea level budgets.
So this deep sea warming represents a significant change in global sea level as well as a portion of global energy; is it enough that more scrutiny needs to be applied to climate models?
The warming of the deep ocean is contributing to global and local heat and SLR budgets and needs to be considered for accurate assessments of the roles of the ocean in climate change.
It would seem that the answer to that questuon is "yes."
Warming of Global Abyssal and Deep Southern Ocean Waters between the 1990s and 2000s: Contributions to Global Heat and Sea Level Rise Budgets
So the IPCC doesn't take solar irradiance or deep ocean warming into account for it's climate models?
Is it possible those two variables might outweigh at least some of the impact humans have on the climate?
I always found it interesting that he people that say every little but helps. Are saying that on a divice that uses electicity and is made from oil.
Did anyone else see how much methane was recently discovered exploding from the ocean floor? Some of these wells appear to be a thousand years old. All the models that we are talking about are not updated with this data.
Did anyone else see how much methane was recently discovered exploding from the ocean floor? Some of these wells appear to be a thousand years old. All the models that we are talking about are not updated with this data.
Yet on a broader scale, it reveals a hidden pattern not visible when you look at 2 back to back years...
Arctic Sea Ice Predictions vs Reality
Its kind of like asserting that because it didn't rain yesterday, its not been a rainy season. Climate works on the scales of decades, not years. You only need look at the graphs of the actual measured arctic ice over time in the above link to see that pattern and understand what the predictions really mean. A local increase [in time] of ice does not indicate a reversal in melting or warming. I know it doesn't make sense if you look at 1 or even 2 years...but imagining that the pattern doesn't exist because you don't see it in small increments doesn't change that it does exist.
Not that we aren't polluting the earth, because we are. But there is always an environmental flavor of the decade, in the 80's it was acid rain. In
the 90's it was the ozone layer. In the first 00's it was ice melting/global warming. The teens are young yet I wonder what they will pick this
decade.
I acknowledge we have issues, but their seems to be a type of environmental bandwagaon that people jump on and off of.
I acknowledge we have issues, but their seems to be a type of environmental bandwagaon that people jump on and off of.
Here's a crazy thought: Maybe nobody (and i mean NOBODY) actually understands the dynamics of climate change... So all this data, and all these
trends, and all these contradictory results are just more evidence that nobody knows what the hell they are talking about (yet). Just keep in mind,
science is not an endpoint, it's a process.
a reply to: xuenchen
I wonder if this has anything to do with the fact that I've been noticing the leaves turning early here in VA since 2012 - some started turning already in August this year. I looked it up 2 years ago when I first noticed and learned that the amount of sunlight trees receive is a major factor in when the leaves start to fall.
Less sunlight because it is being reflected back from the larger amounts of ice maybe?
Could explain it - it's been bothering me.
Thanks for the thread.
a reply to: Blue_Jay33
Yeah, whatever happened to that acid rain that was supposed to melt faces and strip paint off cars?
Yeah, whatever happened to that acid rain that was supposed to melt faces and strip paint off cars?
A lot of the data pro climate change seems to only go back 100 or so years, some less, global temp 150 years or so.
Now I'm not denying the evidence presented but (hate doing that) if all 26 people who flagged this thread cut their emissions by 1000% each, nothing would change.
This is one of the few areas were the 1% and the 99% could really matter.
It is all money at the end of the day, we have to purchase things that are detrimental to the planet because we have no alternatives, we can all do our bit to a point, after a while when you consider countries like china and many big corps, until that clears up what is the point.
Back to the records, Neil Degrasse Tyson makes a whole point on cosmos of telling us we probably can't even begin how long 5 billion years is. This point is hammered home constantly, it has survived everything and even flourished.
The earth will be fine, it's us that'll be done for and the 1% could at least do things we cannot do.
whether it be invest in alternatives, lobby against the biggest emmission groups, basically make a difference the local postman could not.
a reply to: jadedANDcynical
Something that just occurred to me is that... we aren't even talking about minimum sea ice extent right now. The article in the OP discusses August 25th, an your charts discuss July.
Arctic minimum ice extent doesn't usually happen until mid-to-late September.
For example, in 2012, the minimum sea ice extent was September 15th at 3.40463 million sq. km, which is half a million sq. km less ice than August 25th of that year. In the beginning of July of that year, the sea ice extent was 9.06206 million sq. km. By the end of July of that year, it had gone down to 6.40522 million sq. km.
edit on 16Tue, 02 Sep 2014 16:12:48 -0500America/ChicagovAmerica/Chicago9 by Greven because: (no reason
given)
new topics
-
Former Labour minister Frank Field dies aged 81
People: 1 hours ago -
SETI chief says US has no evidence for alien technology. 'And we never have'
Aliens and UFOs: 2 hours ago -
This is our Story
General Entertainment: 5 hours ago -
President BIDEN Vows to Make Americans Pay More Federal Taxes in 2025 - Political Suicide.
2024 Elections: 7 hours ago -
Ode to Artemis
General Chit Chat: 8 hours ago
top topics
-
University student disciplined after saying veganism is wrong and gender fluidity is stupid
Education and Media: 16 hours ago, 14 flags -
President BIDEN Vows to Make Americans Pay More Federal Taxes in 2025 - Political Suicide.
2024 Elections: 7 hours ago, 12 flags -
One Flame Throwing Robot Dog for Christmas Please!
Weaponry: 12 hours ago, 6 flags -
Should Biden Replace Harris With AOC On the 2024 Democrat Ticket?
2024 Elections: 14 hours ago, 6 flags -
SETI chief says US has no evidence for alien technology. 'And we never have'
Aliens and UFOs: 2 hours ago, 4 flags -
Don't take advantage of people just because it seems easy it will backfire
Rant: 12 hours ago, 4 flags -
Ditching physical money
History: 12 hours ago, 4 flags -
Ode to Artemis
General Chit Chat: 8 hours ago, 3 flags -
God lived as a Devil Dog.
Short Stories: 17 hours ago, 3 flags -
Former Labour minister Frank Field dies aged 81
People: 1 hours ago, 3 flags
active topics
-
President BIDEN Vows to Make Americans Pay More Federal Taxes in 2025 - Political Suicide.
2024 Elections • 10 • : pianopraze -
Thousands Of Young Ukrainian Men Trying To Flee The Country To Avoid Conscription And The War
Other Current Events • 126 • : Xtrozero -
whistleblower Captain Bill Uhouse on the Kingman UFO recovery
Aliens and UFOs • 18 • : Jukiodone -
University student disciplined after saying veganism is wrong and gender fluidity is stupid
Education and Media • 38 • : Consvoli -
One Flame Throwing Robot Dog for Christmas Please!
Weaponry • 9 • : crayzeed -
So this is what Hamas considers 'freedom fighting' ...
War On Terrorism • 230 • : FlyersFan -
SETI chief says US has no evidence for alien technology. 'And we never have'
Aliens and UFOs • 18 • : Consvoli -
The Reality of the Laser
Military Projects • 34 • : Zaphod58 -
Remember These Attacks When President Trump 2.0 Retribution-Justice Commences.
2024 Elections • 52 • : TzarChasm -
Ditching physical money
History • 15 • : crayzeed