It looks like you're using an Ad Blocker.
Please white-list or disable AboveTopSecret.com in your ad-blocking tool.
Thank you.
Some features of ATS will be disabled while you continue to use an ad-blocker.
share:
Read this a couple days ago on ETF Daily News and
frankly it left me dumbfounded. The article has since been picked up by ZeroHedge and as I've not seen it posted... well, here it is. Frankly after
reading this twice I'm still not sure if this can be true but if it is then it is proof that the US economy is completely broken. Read the entire
article and decide for yourself.
Mods I placed this in the Global forum. While it is focused on the US I suspect when these type figures are checked globally we will see similarities. This has got to be one of the biggest indicators that the economy is dying. We are in trouble folks.
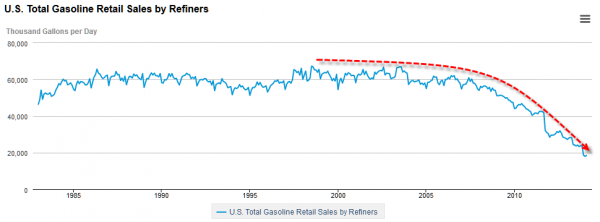
U.S. Gasoline Consumption Plummets By Nearly 75%
Possible or not from what this article discusses it appears we are indeed in this situation. Personally I hope someone can find the flaw in this logic.
Mods I placed this in the Global forum. While it is focused on the US I suspect when these type figures are checked globally we will see similarities. This has got to be one of the biggest indicators that the economy is dying. We are in trouble folks.
U.S. Gasoline Consumption Plummets By Nearly 75%
U.S. “gasoline consumption” – as measured by the U.S. Energy Information Administration (EIA) itself – has plummeted by nearly 75%, from its all-time peak in July of 1998. A near-75% collapse in U.S. gasoline consumption has occurred in little more than 15 years.
Obviously, even in the most-nightmarish economic Armageddon, a (relatively short-term) 75% collapse in gasoline consumption is simply not possible. Unless we were dealing with a nation whose economy had been suddenly ripped apart by civil war, or some small nation devastated by a massive earthquake or tsunami; it’s simply not possible for any economy to just disintegrate that rapidly

Possible or not from what this article discusses it appears we are indeed in this situation. Personally I hope someone can find the flaw in this logic.
edit on 183pm5555pm102014 by Bassago because: (no reason given)
I am calling BS on this, though no doubt there are plenty of people cutting back. I know that in the last decade there have been quite a few people
moving to high gas-mileage cars, but I still see huge trucks everywhere, so I can't believe that gas usage has dropped significantly.
Maybe the price has something to do with it. You can only squeeze a lemon so much before you run out of juice.
Next time dear little princes, dont destroy our infrastructure and manufacturing jobs....if we made as much as our grandparents did we would be buying that crap up like heroin. As it is we cant afford a car, home, education or anything else.
What are you going to sell us now? bread?
Yeah....
I dont buy it though. I do think it went down just not that much.
edit on 5 30 2014 by tadaman because: (no reason given)
what comes to my mind is that the gov. stopped buying and stashing it away.
reserves full?
wars coming to a close?
reserves full?
wars coming to a close?
a reply to: CB328
Initially that's what I thought too. Still this is speaking of consumer lever consumption. Read the whole article, if this is true (not saying it is) but if it is true this is bad. Personally I know I've cut my gas consumption by 100's of percent simply because I can't afford it.
Initially that's what I thought too. Still this is speaking of consumer lever consumption. Read the whole article, if this is true (not saying it is) but if it is true this is bad. Personally I know I've cut my gas consumption by 100's of percent simply because I can't afford it.
I wonder how much of that drop is attributed to the use of electric-hybrid/electric only vehicles, and the uptick in public transit use. I've used PT
regularly here in the Bay area for, sheesh, 16 or 17 years. We've relied on it consistently as a family for over 6 years now, we haven't had a
vehicle in that long. I've seen it go from a handful of riders, to packed buses in all the years I've rode. It's been quite the turn-around,
frankly. I wonder if the new routes and longer hours over the years have balanced out the drop some? I don't mean just locally, I mean nationally.
Public transit is seeing a bit of a renewal all over the place.
a reply to: Bassago
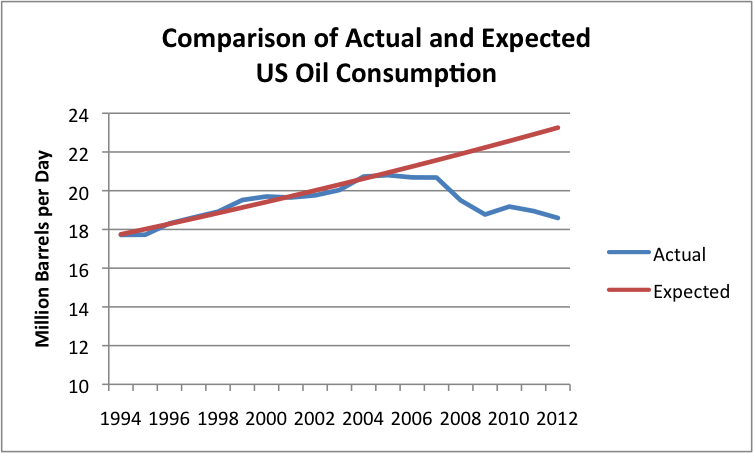
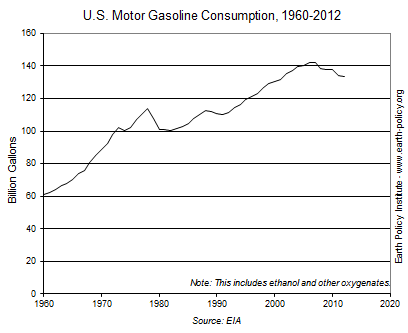
I think the story is fake.
www.earth-policy.org...
www.investing.com...
It has lowered, but nothing like your graph shows.
I think the story is fake.


www.earth-policy.org...
www.investing.com...
It has lowered, but nothing like your graph shows.
How much gasoline does the United States consume?
In 2013, about 134.51 billion gallons1 (or 3.20 billion barrels) of gasoline were consumed2 in the United States, a daily average of about 368.51 million gallons (or 8.77 million barrels). This was about 6% less than the record high of about 142.35 billion gallons (or 3.39 billion barrels) consumed in 2007.
www.eia.gov...
edit on 30-5-2014 by Grimpachi because: (no reason given)
a reply to: Nyiah
I doubt much of the impact has been due to hybrid cars. Folks who can afford those type vehicles can most likely afford gas at $3-$4 a gallon. Public transport is another thing though. I guess we just have to ask why people choose PT. Is it cheaper than driving? More convenient? Probably both.
Still I believe there are some hard (and horrifying) truths to be exposed if the figure in this article are true. As I said earlier I'm unsure, the highways seem to have a lot of vehicles but we know the government is hiding inflation figures, unemployment figures, etc. Not saying they're hiding this but it's a bit obscure. It also points to a dying economy.
I wonder how much of that drop is attributed to the use of electric-hybrid/electric only vehicles, and the uptick in public transit use.
I mean nationally. Public transit is seeing a bit of a renewal all over the place.
I doubt much of the impact has been due to hybrid cars. Folks who can afford those type vehicles can most likely afford gas at $3-$4 a gallon. Public transport is another thing though. I guess we just have to ask why people choose PT. Is it cheaper than driving? More convenient? Probably both.
Still I believe there are some hard (and horrifying) truths to be exposed if the figure in this article are true. As I said earlier I'm unsure, the highways seem to have a lot of vehicles but we know the government is hiding inflation figures, unemployment figures, etc. Not saying they're hiding this but it's a bit obscure. It also points to a dying economy.
I would suggest checking on the meanings of "Gasoline" and "Motor Gasoline".
Does one include Diesel Fuel while the other does not.
Charts can easily mislead if one does not carefully dissect what they are actually measuring.
Lastly, the US is in an economics black pit, that should be obvious to anyone.
P
Does one include Diesel Fuel while the other does not.
Charts can easily mislead if one does not carefully dissect what they are actually measuring.
Lastly, the US is in an economics black pit, that should be obvious to anyone.
P
I think I found where this coming from, but it doesn't really match up to the article in the OPs claim.
U.S. Fuel Consumption Lowest for February Since 1998, API Says
U.S. fuel demand fell in February to the lowest level for the month in 16 years as cold weather curbed driving more than it increased heating demand, the American Petroleum Institute said. Exports climbed.
Total deliveries of petroleum products, a measure of demand, dropped 0.6 percent from a year earlier to 18.5 million barrels a day, the industry-funded group said today. It was the lowest level for February since 1998.
Consumption of distillate fuel, the category that includes diesel and heating oil, slipped 3.6 percent to 3.83 million barrels a day last month, the least for February since 2002. Diesel demand slipped 6.4 percent to 3.29 million. Gasoline demand fell 0.2 percent to 8.4 million, the weakest February since 2001. Jet fuel use dropped 1.9 percent to 1.3 million.
“Cold weather tends to have a dampening effect on the economy, which helped reduce demand for many types of fuel,” John Felmy, chief economist at the API in Washington, said in the report. “Of course, low temperatures have the opposite effect on demand for propane and heating oil.”
Production of gasoline and distillates reached record highs, the API said, with distillates up 9.2 percent to 4.66 million barrels a day and gasoline gaining 3.5 percent to 9.1 million. Fuel exports climbed 24 percent to 4.03 million barrels, the highest February level ever and 415,000 short of the record reached in December.
U.S. crude oil output increased 13 percent to 8.02 million barrels a day. Output of natural gas liquids, a byproduct of gas drilling, climbed 11 percent to 2.72 million.
a reply to: Grimpachi
Ah, the "bad" winter excuse. That's the same thing almost every other hammering in corporate earnings, etc we've been seeing for the last two quarters. Still, fair enough. Still trying to wrap my mind around the links and charts you posted in your previous post.
Frankly I have more faith in your charts and data than in the excuse of "bad weather." Everybody and their brother is using that as an excuse for bad numbers.
U.S. fuel demand fell in February to the lowest level for the month in 16 years as cold weather curbed driving more than it increased heating demand, the American Petroleum Institute said. Exports climbed.
Ah, the "bad" winter excuse. That's the same thing almost every other hammering in corporate earnings, etc we've been seeing for the last two quarters. Still, fair enough. Still trying to wrap my mind around the links and charts you posted in your previous post.
Frankly I have more faith in your charts and data than in the excuse of "bad weather." Everybody and their brother is using that as an excuse for bad numbers.
a reply to: Bassago
In the article, it also discusses why the US can't come up with a simple way to produce the statistical measurements/charts and each time they do, the method varies... a lot of good that does
Also explains why the chart you posted varies from the one grimpachi posted
So basically they are not going by what people buy at the pumps but via gas entering the domestic chain
But with the prices higher, more people are car pooling and traveling less IMO
In the article, it also discusses why the US can't come up with a simple way to produce the statistical measurements/charts and each time they do, the method varies... a lot of good that does
Also explains why the chart you posted varies from the one grimpachi posted
So how can this raw data, produced by the government itself, be explained? To begin with; the government chooses to measure U.S. gasoline consumption in a very odd manner: by measuring the amount of gasoline entering the domestic supply-chain rather than by measuring actual consumption at the other end of the supply-chain – i.e. “at the pump”.
Why does the U.S. government, which (among other things) leads the world in the manufacture of statistics not produce any simple/direct measurement of gasoline consumption? How can the St. Louis Fed produce nearly 100 different charts on gasoline and diesel prices (for any/every price-category which can be imagined by these statistics geeks), but not a single chart on gasoline supply/demand?
So basically they are not going by what people buy at the pumps but via gas entering the domestic chain
But with the prices higher, more people are car pooling and traveling less IMO
edit on 30-5-2014 by snarky412 because: spweeling
a reply to: Grimpachi
I believe motor gasoline, if we mean the gasoline we put in our vehicles, versus oil consumption, if we mean crude oil, it's not really a fair comparison. I say this because crude oil must be refined in order to get the gasoline from it.
I read it takes more than two gallons of crude to get one gallon of gasoline.
originally posted by: snarky412
a reply to: Bassago
In the article, it also discusses why the US can't come up with a simple way to produce the statistical measurements/charts and each time they do, the method varies... a lot of good that does
So how can this raw data, produced by the government itself, be explained? To begin with; the government chooses to measure U.S. gasoline consumption in a very odd manner: by measuring the amount of gasoline entering the domestic supply-chain rather than by measuring actual consumption at the other end of the supply-chain – i.e. “at the pump”.
Why does the U.S. government, which (among other things) leads the world in the manufacture of statistics not produce any simple/direct measurement of gasoline consumption? How can the St. Louis Fed produce nearly 100 different charts on gasoline and diesel prices (for any/every price-category which can be imagined by these statistics geeks), but not a single chart on gasoline supply/demand?
So basically they are not going by what people buy at the pumps but via gas entering the domestic chain
But with the prices higher, more people are car pooling and traveling less IMO
This makes more sense now.
We are importing much less oil than we used to.
If they're measuring consumption in this manner, it's flawed as an actual measurement of oil consumption; it's rather a measurement of oil imports.
a reply to: Bassago
Just a fly-by to mark this one guys. I apologize. This has certainly sparked an interesting discussion that I'm watching with interest so S&F for what it's worth. I will say these charts and statistics can be hard to pin down for truth in and of themselves but I'm curious what the detective work on this one may turn up.
Just a fly-by to mark this one guys. I apologize. This has certainly sparked an interesting discussion that I'm watching with interest so S&F for what it's worth. I will say these charts and statistics can be hard to pin down for truth in and of themselves but I'm curious what the detective work on this one may turn up.
Indeed this seems a bit misleading however I believe that consumers have tried to be more practical about fuel consumption either consciously or not.
Taking trips that are not as far away. Going out less. Using public transit which is getting big even though the US is terrible at it. Moving closer
to jobs and cities.
I know recently I had read something that indicated the average age of a US car is 11 years old. This would indicate that while some are buying gas guzzlers the majority can not afford to do so.
I am even sure that social media have had an affect. I know I have seen my relatives less due to being able to communicate with them and keep updated on their lives constantly through social media. Not to mention entertainment such as driving to the movies or video store or other such activities which have been made obsolete.
Also lets not forget that those who are unemployed and on social welfare programs don't drive as much.
edit on 30-5-2014 by NihilistSanta
because: (no reason given)
Whether the report is accurate or not, isn't the overall 'green agenda' to try to get people to cut down on driving anyway??
Less emissions in the air and what not....
Less emissions in the air and what not....
a reply to: Bassago
I am just trying to figure out where the graph in your OP came from. I did a search with the key words and that was the article that came up. I have links to where all the graphs came from that I used posted with my post.
I understand there is some drop about 6% they attribute to better gas milage from the all time high in 2007.
What I found interesting is the production of fuel and refinement is higher than it has ever been that means all that fuel is being exported while our gas prices are still over $4 a gallon.
Well I don't know really but I have looked at a lot of graphs already. I gave up a while ago on trying to find where your article got theirs and what exactly it explains. I would think it should be easy enough to confirm if true but I am at a loss. Maybe someone else here can find the source.
Nevermind I found it.
www.eia.gov...
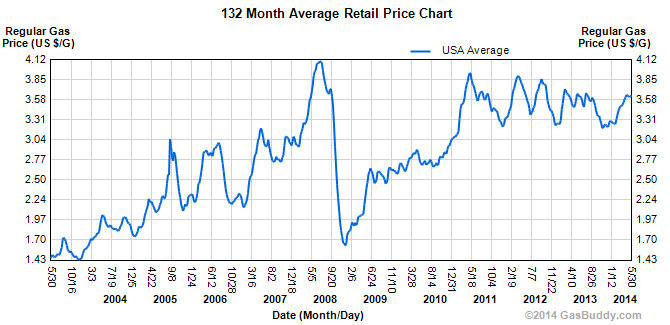
So I eat my hat here. It has gone down. It started in about 2003 and began plummeting in 2008.
I think I need to research gas price changes for those years.
Found it.
 www.gasbuddy.com...
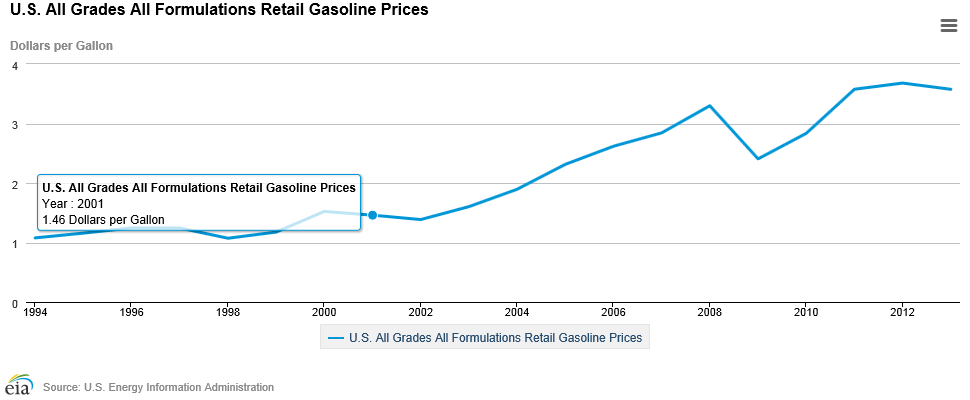 www.eia.gov...
Is there a correlation?
I am just trying to figure out where the graph in your OP came from. I did a search with the key words and that was the article that came up. I have links to where all the graphs came from that I used posted with my post.
I understand there is some drop about 6% they attribute to better gas milage from the all time high in 2007.
What I found interesting is the production of fuel and refinement is higher than it has ever been that means all that fuel is being exported while our gas prices are still over $4 a gallon.
Well I don't know really but I have looked at a lot of graphs already. I gave up a while ago on trying to find where your article got theirs and what exactly it explains. I would think it should be easy enough to confirm if true but I am at a loss. Maybe someone else here can find the source.
Nevermind I found it.
www.eia.gov...
So I eat my hat here. It has gone down. It started in about 2003 and began plummeting in 2008.
I think I need to research gas price changes for those years.
Found it.


Is there a correlation?
edit on 31-5-2014 by Grimpachi because: (no reason given)
I know that many are switching from light trucks that use gasoline to diesel light trucks.
many companies have found this cost effective like construction companies.
For 1/2 ton to 5 ton trucks they no longer have to stock two fuels and all there fleet from trucks to heavy equipment can use the same fuel.
Other companies like delivery companies (FEDex ect) has been going to natural gas for there trucks. along with many cities changing there fleets to natural gas.
www.youtube.com...
The problem with changing to natural gas or electric cars and trucks is it drives the price of both fuels up.
this is bad for home owner that need to heat or power there homes.
My power bill has gone up from less then $50 dollars a month to about $85 a month in the last year and i live in a motor home with solar panels for my 12 volt system that i installed in the last year.
new topics
-
Something better
Dissecting Disinformation: 4 hours ago -
The Witcher IV — Cinematic Reveal Trailer | The Game Awards 2024
Video Games: 7 hours ago -
Friday thoughts
General Chit Chat: 7 hours ago -
More Ons?
Political Conspiracies: 8 hours ago -
Canada Post strike ended by the Government of Canada
Mainstream News: 8 hours ago
top topics
-
They Know
Aliens and UFOs: 12 hours ago, 18 flags -
Canada Banning more Shovels
General Chit Chat: 17 hours ago, 10 flags -
Something better
Dissecting Disinformation: 4 hours ago, 8 flags -
More Ons?
Political Conspiracies: 8 hours ago, 5 flags -
Friday thoughts
General Chit Chat: 7 hours ago, 5 flags -
Canada Post strike ended by the Government of Canada
Mainstream News: 8 hours ago, 4 flags -
The Witcher IV — Cinematic Reveal Trailer | The Game Awards 2024
Video Games: 7 hours ago, 2 flags -
Drones (QUESTION) TERMINATOR (QUESTION)
General Chit Chat: 13 hours ago, 1 flags
active topics
-
A Bunch of Maybe Drones Just Flew Across Hillsborough County
Aircraft Projects • 65 • : 38181 -
DONALD J. TRUMP - TIME's Most Extraordinary Person of the Year 2024.
Mainstream News • 39 • : WeMustCare -
The Acronym Game .. Pt.4
General Chit Chat • 1012 • : FullHeathen -
USS Liberty - I had no idea. Candace Owen Interview
US Political Madness • 33 • : DEATHANDTRUTH -
And Here Come the Excuses!!
General Conspiracies • 201 • : cherokeetroy -
Something better
Dissecting Disinformation • 9 • : AlroyFarms -
The goal of UFO's/ fallen angels doesn't need to be questioned - It can be discerned
Aliens and UFOs • 15 • : Astrocometus -
They Know
Aliens and UFOs • 59 • : WeMustCare -
-@TH3WH17ERABB17- -Q- ---TIME TO SHOW THE WORLD--- -Part- --44--
Dissecting Disinformation • 3666 • : CarlLaFong -
Magic Vaporizing Ray Gun Claim - More Proof You Can't Believe Anything Hamas Says
War On Terrorism • 20 • : DEATHANDTRUTH
