It looks like you're using an Ad Blocker.
Please white-list or disable AboveTopSecret.com in your ad-blocking tool.
Thank you.
Some features of ATS will be disabled while you continue to use an ad-blocker.

Radiation Clouds at Aviation Altitudes (and It's Link to Climate Change.)
page: 1share:
A new study published in the peer-reviewed journal Space Weather reports the discovery of radiation "clouds" at aviation altitudes. When airplanes fly through these clouds, dose rates of cosmic radiation normally absorbed by air travelers can double or more.
...
Above: Radiation measurements made by ARMAS while flying over Antarctica. The colored points are from ARMAS. The black points are from a NASA computer model (NAIRAS) predicting radiation dose rates. Throughout the flight, ARMAS observed higher dose rates than predicted by the model, including a surge highlighted in pink.
...
www.spaceweather.com...
Even though it has been known for a while now that at higher altitudes the doses of radiation exposure is much higher than at ground level, what has been discovered is that there are areas/radiation clouds where the radiation exposure increases sharply with " no apparent reason". Most of the surges in radiation that have been found are located at high latitudes well above 50 degrees in both poles, which means both poles are receiving more cosmic radiation than almost anywhere else on the planet. Although research has also found that there are some areas outside these high latitudes in which these radiation clouds have also been found such as Washington DC, which lies at Latitude 38º 89' N, and Tokyo which lies at Latitude 35° 41' N
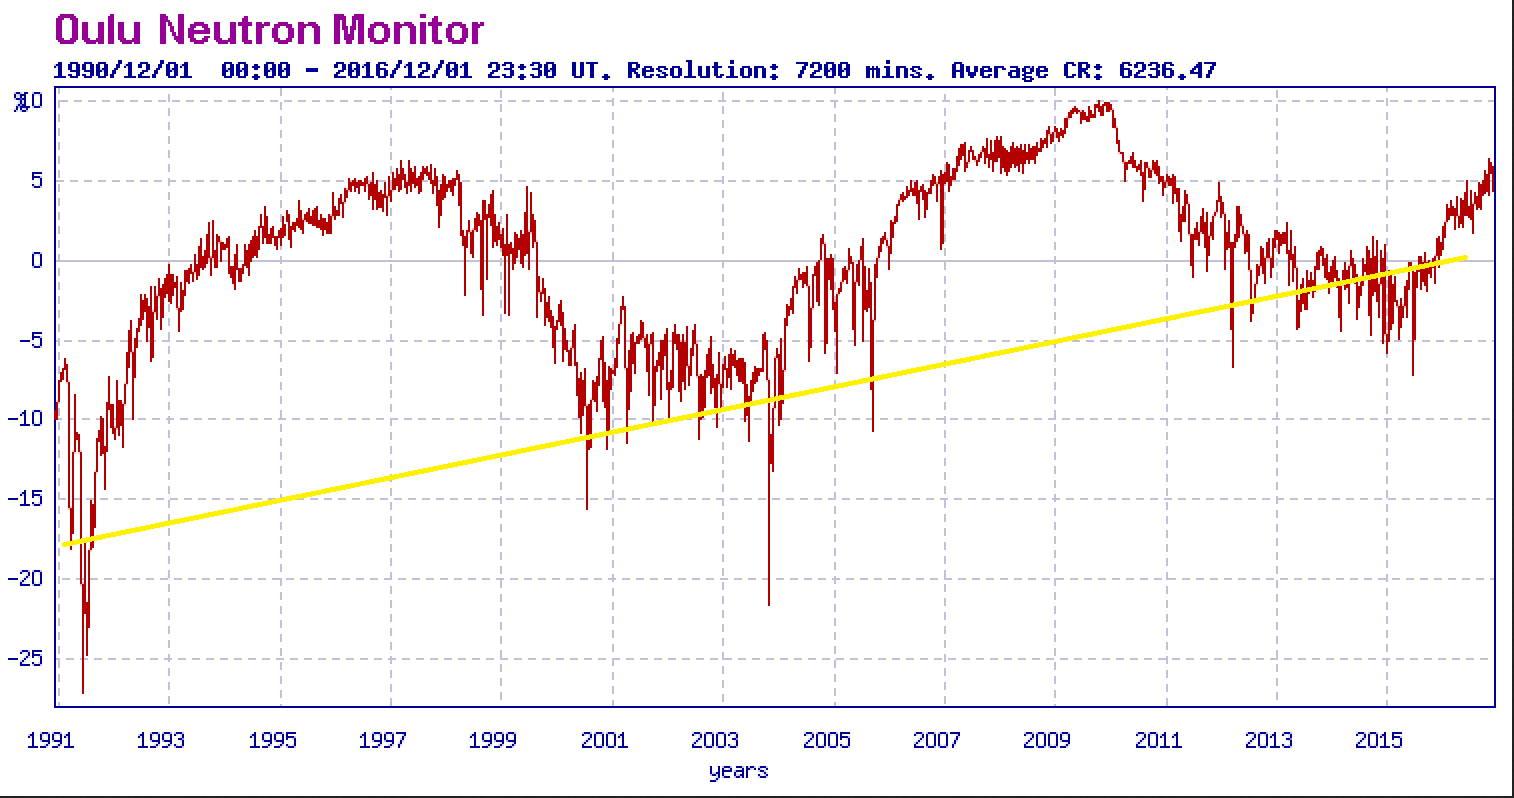
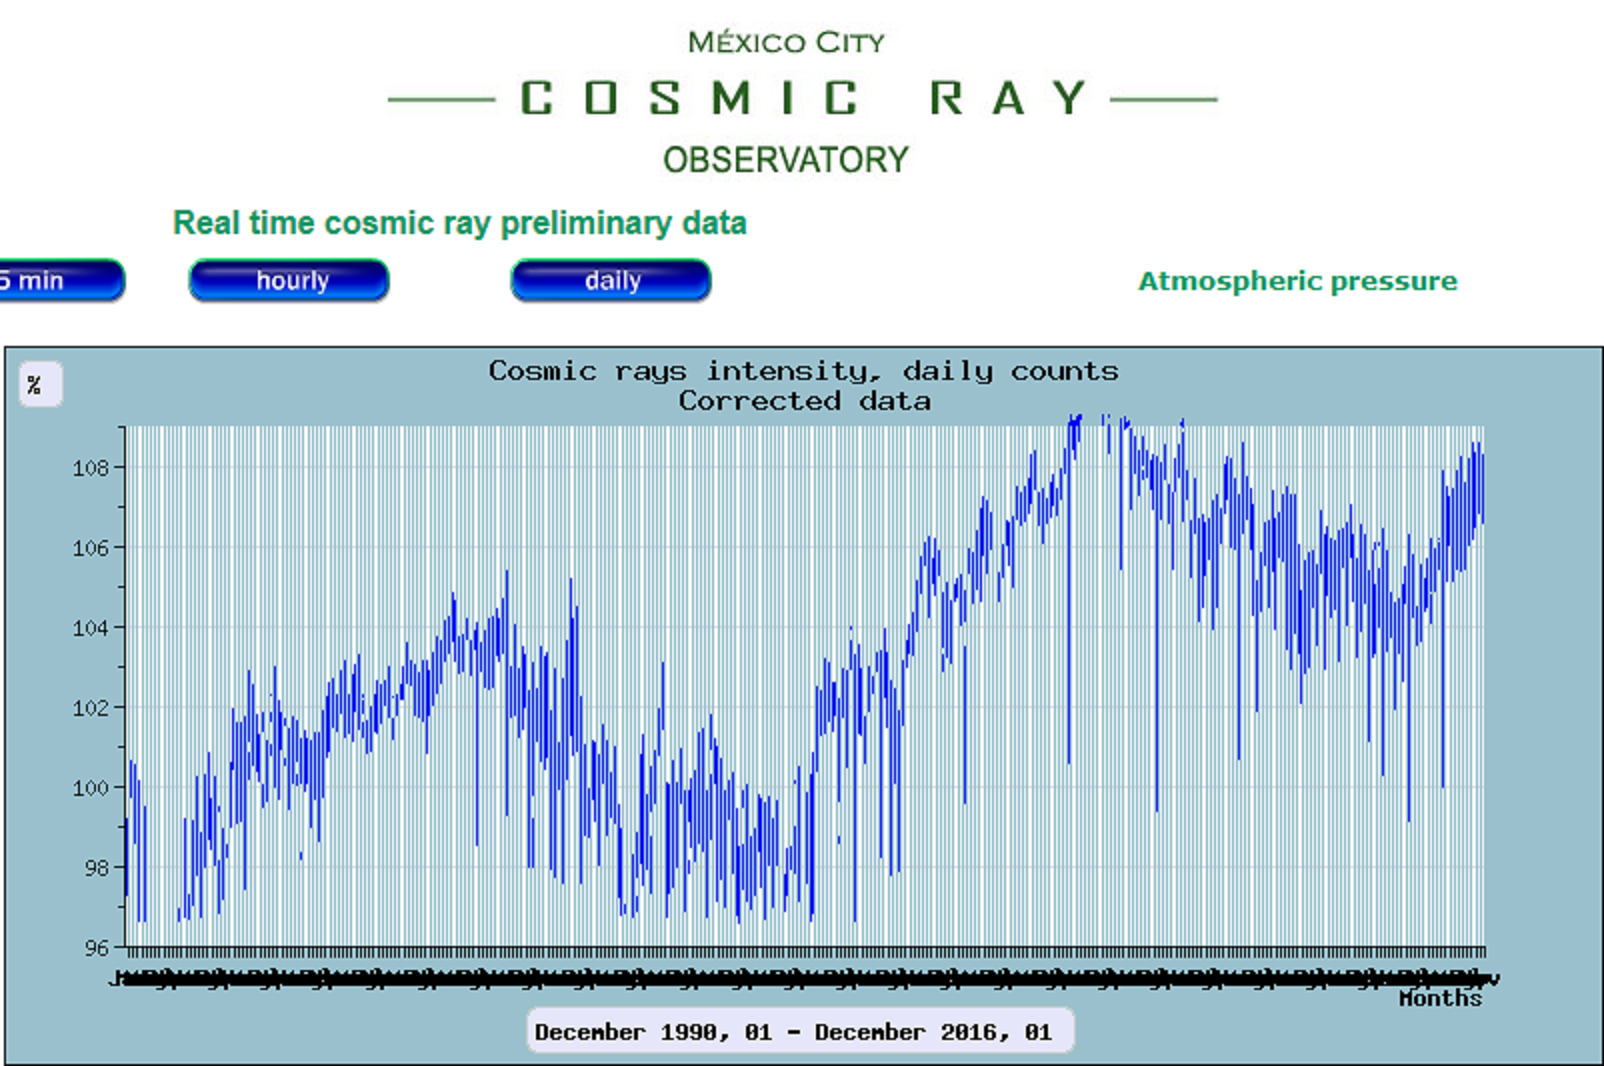
This is occurring at a time when we know cosmic rays have continued to increase.
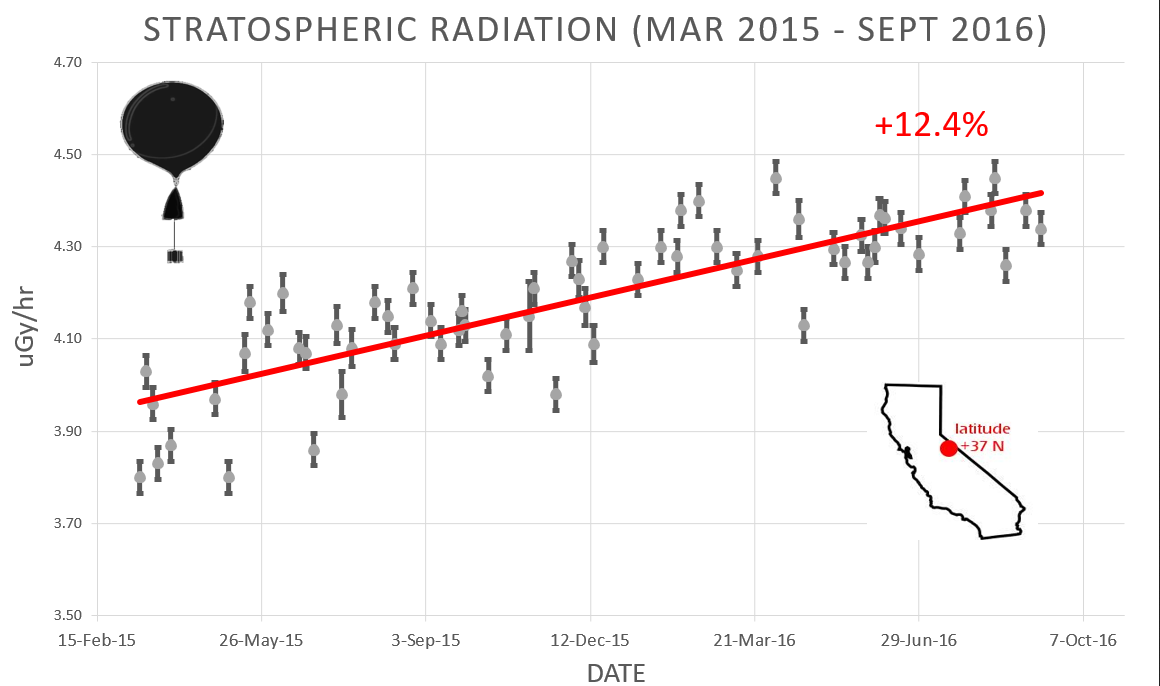
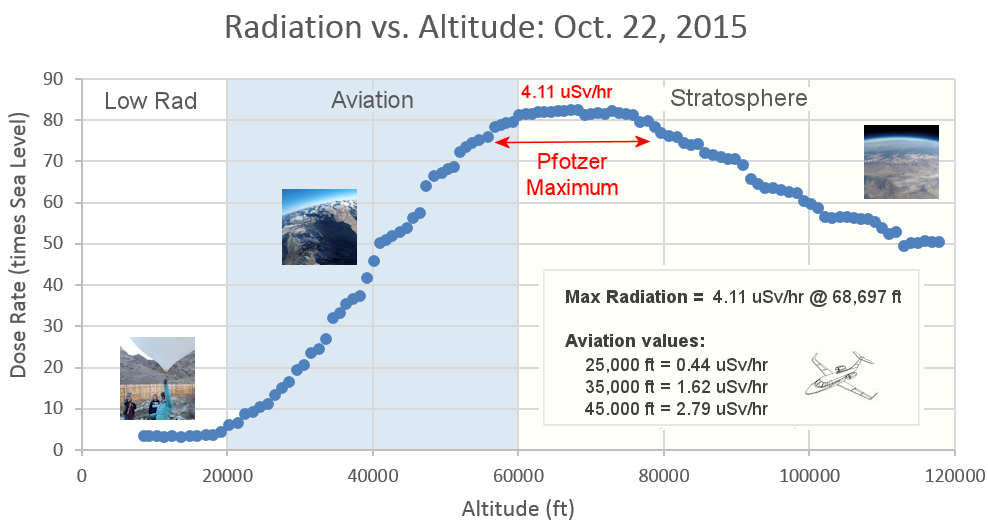
In fact in October 22nd 2015 (last image above) we reached radiation levels of the Reneger-Pfotzer maximum, discovered in the 1930s by German physicist Erich Regener and his student Georg Pfotzer, occurring at about 67,000 feet above central California. They found the "altitude at which the production of ionisation in the atmosphere reaches a maximum, and also found the maximum amount of radiation received by Earth thus far, until October 22nd 2015, when once again we reached similar levels.
The Reneger-Pfotzer maximum, which not only was a discovery of the altitude at which the production of ionisation reaches a maximum in the atmosphere, but the German Physicist and his student also found the maximum doses of radiation coincided with
the heat wave of the 1930s.
It is a known fact that one of the changes caused by increased cosmic ray absorption by Earth's atmosphere affects the ozone levels and the circulation patterns in the Stratosphere, which also affect the circulation patterns and ozone levels in the Troposphere causing dramatic climate changes.
Geomagnetic modulation of clouds effects in the Southern Hemisphere Magnetic Anomaly through lower atmosphere cosmic ray effects
The Influence of Cosmic Rays on the Size of the Antarctic Ozone Hole
Impact of cosmic rays and solar energetic particles on the
Earth’s ionosphere and atmosphere
Stratospheric impact on tropospheric ozone variability
and trends: 1990–2009
Tropospheric ozone variations governed by changes in stratospheric circulation
Occurrence of Ozone Anomalies over Cloudy Areas in TOMS Data
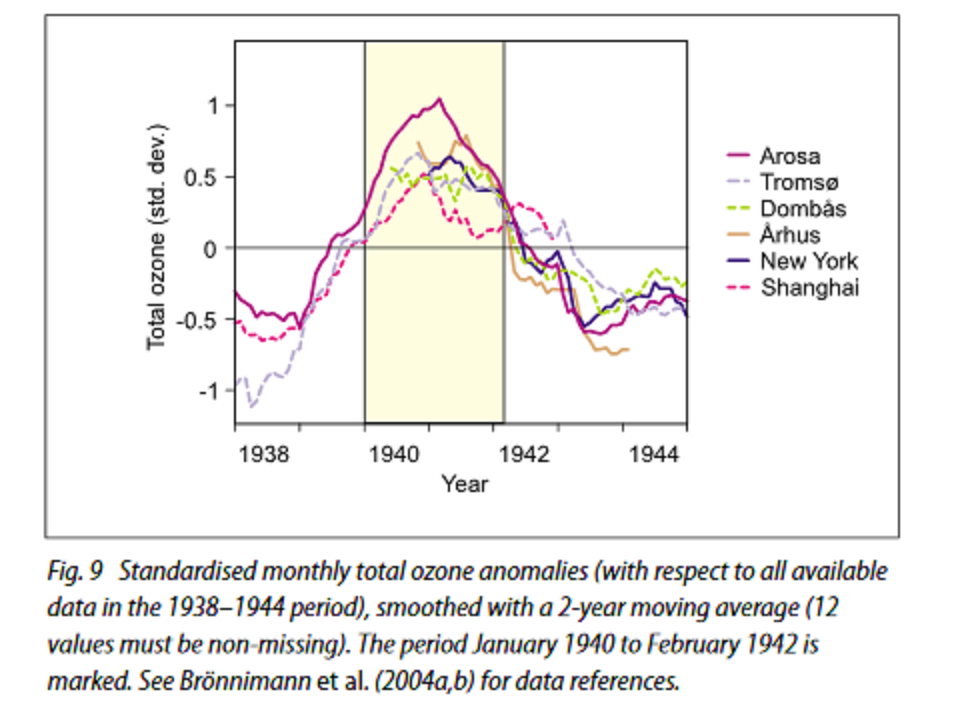
Coincidentally, in the 1940s the entire globe was gripped by a climate anomaly similar to the one we are facing these days. While some areas experienced prolonged extreme high temperatures like Alaska, Europe experienced a prolonged and drastic winter which is known to have affected the outcome of the second World War. Also, not by coincidence, scientists in the 1940s found anomalous increases in ozone over various European sites.
The global climate anomaly
1940–1942
...
The cold European winters during the Second World War (1941/42 was the third in a row) are famous. They even affected the course of the war (Lejenäs 1989). However, it is less well-known that at the same time climate was also anomalous in other regions of the world. Temperatures were exceptionally high in Alaska, and a prolonged El Niño was reported. Moreover, scientists noted unusually high values of total ozone over several European sites. The cold winters in Russia were merely a facet of a global climate anomaly encompassing the troposphere and stratosphere, a fact that was not realised until recently (Brönnimann et al. 2004a, Labitzke and van Loon 1999).
...
...
onlinelibrary.wiley.com...
However, there is a drastic difference between the 1930s-1940s and today. This time around Earth's magnetic field is weaker than it was in the 1930s-1940s, which would mean these increase cosmic radiation would make more drastic changes this time around. That's without pointing out the other changes occurring on Earth such as the increase seismic activity, and the increase geothermal/volcanic activity, among other geophysical and atmospheric changes occurring on Earth.
Knowing what happened in the past would point to the fact that we will continue to experience drastic climate changes and geophysical changes which are also occurring in other planets and moons with an atmosphere in the Solar System.
Perhaps it is time to stop blaming mankind for the one thing we are not to blame, and we should start making efforts to adapt to these changes which will only get worse.
Related ATS articles:
Cosmic Rays, especially X-Rays, The Solar System is Receiving Have been Increasing
edit on 21-1-2017 by ElectricUniverse because: correct links.
The measurements from 2013 to 2016 do not cover a period of time to quantify galactic cosmic rays' dependence on solar cycle variation and their effect on aviation radiation.
The article makes no connection to climate whatsoever. That is purely your imagination.
originally posted by: Phage
The article makes no connection to climate whatsoever. That is purely your imagination.
No...the article deals with the anomalous increase in dosage of radiation at high latitudes, but I linked other research which does correlate changes/increases in cosmic radiation with climate changes, and that is not my imagination...
Are you Phage now claiming that an increase in cosmic radiation reaching Earth would not affect Earth's atmosphere and it's climate? Because that is "your imagination" if that's what you are implying.
edit on 22-1-2017 by ElectricUniverse because: add comment.
a reply to: ElectricUniverse
Hey Hey... watch it now, that hole in the geomagnetic sphere and weakening of the earth's magnetic field is claimed! You see, transporting electricity via power lines has caused a fluctuation in earth's magnetic field. That is my Scam that I claimed years ago... err.. .I mean scientific discovery and disclosure of the greatest threat to mankind ever! And we have a solution! (BTW, Do Not Link this to Climate Change, those greedy sob's will want a cut).
Electron Credits, WE will use the revenue to fix the holes and the earth's magnetic field, .50 cents of every dollar (net of course) will be used to fix the problem... the other .50 cents is for us... you know, research and all.
www.abovetopsecret.com...
OK, here is the plan... the magnetic field is changing due to mans use of electricity (electrical production and the transport of electricity worldwide is disrupting the natural magnetic field of the earth!).... Now, we can get a coalition of scientists to hit the government up for millions for research (I get 5%) and have Al Gore make another movie (with me not Hansen) and if we preach this well enough we can make a crap-ton of money just on the books alone....
Now, if it goes really well after that, we can then press for "electron credits" and "electron Cap & Trade" scams.
Then an international court to "punish" those who do not comply with paying us to prevent this disaster and doing what we tell them in the name of the environment. I hereby repeat my claim this scam ... err, I mean scientific discovery and disclosure of the greatest threat to mankind ever, publicly and originally on the internet on 1/11/2009 and we will call this the "Infolurker Effect" going forward!
We will make a mint by taxing every kilowatt of electricity produced in the WORLD! This is almost as good as the Co2 scam and nobody has claimed it yet so I am..
edit on 22-1-2017 by infolurker because: (no reason given)
undertard the correlation. So Climate or greek to climax has absolutely no need to get into this because science has a general consensus that
greenhouse emissions in the last 20th century have most certainly depleted ( and in modern times there is evidence that it has healed :O) the gaping
hole in the ozone above both magnetic poles on this ball. This post is about how above each of those poles there is an unusual amount of cosmic
radiation or " a bubble of cosmic radiation" which can be my imagination but it is also my belief that the ozone layers depletion at the poles where
magnetic pressure is located has less to do with pollution and more to do with the fall of the soviet union and lack of communism in the world. ahahah
and remember climate has absolutely nothing to do with the earth but rather our political climate.
a reply to: infolurker
Yeah, I know "certain people" will try to blame this yet again on mankind when the entire solar system is changing, and we see similar events occurring in other planets and moons in the solar system. But hey, it's "just coincidence" according to "these people" that these changes are occurring at the same time that we are receiving more cosmic rays and Earth's magnetic field is weaker.
Here is the thing, first the depletion of ozone was blamed on mankind for releasing CFCs, and now, because there has been an increase in ozone in the Troposphere, mankind is again being blamed for this.
Tropospheric Ozone: Global distribution and radiative forcing
www.unc.edu...
Sure CFCs do have an effect on ozone depletion, but how much of this effect has been masked by "natural factors" such as?
Solar Storms Destroy Ozone, Study Reconfirms
And then, there is the fact that some research has shown that even during the time when CFCs were being released worldwide there was an increase in global ozone in the Troposphere. Is it not possible that instead the most likely explanation is that part of the ozone in the stratosphere moved downwards towards the troposphere instead of blaming mankind for both?
Stratosphere-to-troposphere transport revealed by ground-based lidar and ozonesonde at a midlatitude site
Kind of weird when the same increase in cosmic rays in the 1930s and the subsequent increase in ozone during the 1940s occurred, mankind was not to blame. But when we see similar changes occurring now to the ones mankind witnessed in the 1930s-1940s it's not possible that both events occurred because of natural changes?
Yet, what is even more weird is that these same people who keep wanting to blame mankind for all these changes we are seeing can't for the life of them link these changes in ozone to the increase in cosmic radiation which also occurred in the 1930s.
Now nitrogen oxides being released by mankind is being blamed for the tropospheric increases in ozone. But for some reason the AGW crowd ignore the fact that soft x-rays from our sun increases the production of nitrogen oxide in the upper atmosphere, and this nitrogen oxide can, and does get transported into lower regions of Earth's atmosphere.
Unusually strong nitric oxide descent in the Arctic middle atmosphere in early 2013 as observed by Odin/SMR
Transport Processes in the Stratosphere and Troposphere
But of course, it is much easier and "profitable for the globalists" to try to blame mankind for all of these changes.
edit on 22-1-2017 by ElectricUniverse because: correct links.
A personal observation with a hand held Geiger counter.. Was not my Geiger counter.
I know the counter was in millirems but as far as actual numbers sorry I do not remember.. However, at 12,000 ft MSL depending on the time of year the counter would point to about 9 to 9:30 on its' dial..above or around that altitude up to 20/23,000 the meter pointed to 12 o'clock.. 25,000 was another jump but once you cleared 30/33,000 msl the meter was at the 2 or 3:30 position.. I spent many years flying at high altitude and a few years at 43 to 45,000.. It is true if you get a solar event your dosage can go way up.. Even the astronauts have safe places to hide when that happens.. Much of the radiation dosage has been known and measured since the 60s... Not necessarily the hot spots in the op though..
I did have a friend who flew the polar route to Europe but had to quit those routes for he swore the extra radiation he was getting was making him feel ......not well.. He stopped flying those routes and as far as I know retired several years later..
Just a personal report from the 80s to the best of my recollection, so take it for what it is worth.
edit on 727ndk17 by 727Sky because:
..
a reply to: ElectricUniverse
Even the highest measurement that Aircraft passengers were exposed to when flying through these radiation clouds on the graft was 32 µSv/hr.
The average yearly dose for a human is about 50 mSv/year.
So these clouds are not really hazardous to people flying.
Even the highest measurement that Aircraft passengers were exposed to when flying through these radiation clouds on the graft was 32 µSv/hr.
The average yearly dose for a human is about 50 mSv/year.
So these clouds are not really hazardous to people flying.
Not this discussion again...we already spent pages going through this in another thread while you were trying to figure out how to read a simple graph.
originally posted by: ElectricUniverse
Are you Phage now claiming that an increase in cosmic radiation reaching Earth would not affect Earth's atmosphere and it's climate? Because that is "your imagination" if that's what you are implying.
We also discussed that you couldn't even prove what effect an increase in cosmic rays would have on the climate, such as whether it would result in a temperature increase, or a temperature decrease, or no significant effect.
When fukushima occurred I wondered if the stead flow of radiation from that monster had an influencing factor on just more then the ocean. I believe
it was here that someone posted a link to a series of reports done when "blowing up nuclear weapons in the air for fun and science" was still a thing.
Seems yes, man made radiation does have a huge impact on both climate and immediate weather according the science reports, which I imagine have long
been scrubbed from the internet. Keep in mind power plants spew all the time...
Of course modern science folks have read every single possible paper, including the classified ones, and have come to the settled science conclusion something something bananas, xrays, planes and that we are safe from any issues from man made radiation and so is the climate.
Next point. Godard and NASA have both published papers, from some years back, that the Sun is the climate changer and weather modifier - solar energy/radiation. Of course these two corporations are known fake news people, so take that with a grain of salt, as "the science is settled" so anything NASA and Godard may have to say on the topic is of course disinformation trying to steer away from the notion that cows, and humans driving cars are the problem and the solution is to tax the impoverished and marginal and send it to wealthy people. Case closed.
It would seem that there are indeed science papers that purport to demonstrate that climate and weather are influenced by things other then humans, and the radiation from the sun is the primary component - see climate changes on other planets for that. It also seems that it is beyond ignorant to suggest constantly adding dozens of radioactive isotopes to the environment to make extreme weapons for killing is counter productive to both human DNA and the climate and weather, but since any science priest posting here has read all the papers published from all over the world from the last 100 years, including the classified ones, I'm kinda apt to believe him/them and agree something something bananas, xrays and plane fights...
Quite a few years ago I sent off a query on the Antarctic ozone hole to a Mr Ben Deangelo, who I understood to be a top scientist within the US. My
question was "taken that the largest ozone hole is over Antarctic (South Pole) yet the vast majority of the supposed human led pollution was in the
Northern hemisphere, why is it that the Arctic aught to have a bigger hole than Antarctic as when looks at NASA images of the weather patterns the
Northern atmosphere does not mix with the Southern hemisphere"
Someone on here might answer that for me as I've lost the reply from Mr Deangelo.
Someone on here might answer that for me as I've lost the reply from Mr Deangelo.
originally posted by: Arbitrageur
Not this discussion again...we already spent pages going through this in another thread while you were trying to figure out how to read a simple graph.
Do you mean the same discussion in which you couldn't figure out why solar activity would have a stronger influence over the Earth's climate during a time Earth's magnetic has been weakening more and more?
originally posted by: Arbitrageur
We also discussed that you couldn't even prove what effect an increase in cosmic rays would have on the climate, such as whether it would result in a temperature increase, or a temperature decrease, or no significant effect.
No significant effect huh? Is that why we are seeing planets and moons with an atmosphere in the solar system also undergoing dramatic climate changes, and in the form of warming nonetheless?... It's because these changes the Sun, and the increase cosmic rays and cosmic dust has no effect whatsoever on the climate?...
a reply to: watchitburn
The problem is not whether this directly affects humans, but it does show that there has indeed been an increase in radiation entering Earth. How much is this increase radiation altering our atmosphere?
Then there is the fact that even the sun has been acting weird. When the Sun's overall activity was low it was radiating more visible light and soft x-rays which has been warming Earth more.
www.nature.com...
With the Sun acting strangely, the Earth's magnetic field weaker than it was at least over 170 years ago if not more, and because of the weaker interplanetary magnetic field Earth is receiving more radiation and more energy on overall.
The sun itself is reacting strangely to the changes the entire Solar System is undergoing.
The problem is not whether this directly affects humans, but it does show that there has indeed been an increase in radiation entering Earth. How much is this increase radiation altering our atmosphere?
Then there is the fact that even the sun has been acting weird. When the Sun's overall activity was low it was radiating more visible light and soft x-rays which has been warming Earth more.
Declining solar activity linked to recent warming
The Sun may have caused as much warming as carbon dioxide over three years.
Quirin Schiermeier
An analysis of satellite data challenges the intuitive idea that decreasing solar activity cools Earth, and vice versa. In fact, solar forcing of Earth's surface climate seems to work the opposite way around — at least during the current Sun cycle.
Joanna Haigh, an atmospheric physicist at Imperial College London, and her colleagues analysed daily measurements of the spectral composition of sunlight made between 2004 and 2007 by NASA's Solar Radiation and Climate Experiment (SORCE) satellite. They found that the amount of visible light reaching Earth increased as the Sun's activity declined — warming the Earth's surface. Their unexpected findings are published today in Nature1.
The study period covers the declining phase of the current solar cycle. Solar activity, which in the current cycle peaked around 2001, reached a pronounced minimum in late 2009 during which no sunspots were observed for an unusually long period.
Sunspots, dark areas of reduced surface temperature on the Sun caused by intense magnetic activity, are the best-known visible manifestation of the 11-year solar cycle. They have been regularly observed and recorded since the dawn of modern astronomy in the seventeenth century. But measurements of the wavelengths of solar radiation have until now been scant.
Radiation leak
Haigh's team compared SORCE's solar spectrum data with wavelengths predicted by a standard empirical model based mainly on sunspot numbers and area, and noticed unexpected differences. The amount of ultraviolet radiation in the spectrum was four to six times smaller than that predicted by the empirical model, but an increase in radiation in the visible wavelength, which warms the Earth's surface, compensated for the decrease.
Contrary to expectations, the net amount of solar energy reaching Earth's troposphere — the lowest part of the atmosphere — seems to have been larger in 2007 than in 2004, despite the decline in solar activity over that period.
The spectral changes seem to have altered the distribution of ozone molecules above the troposphere. In a model simulation, ozone abundance declined below an altitude of 45 kilometres altitude in the period 2004–07, and increased further up in the atmosphere.
The modelled changes are consistent with space-based measurements of ozone during the same period.
"We're seeing — albeit limited to a very short period — a very interesting change in solar irradiation with remarkably similar changes in ozone," says Haigh. "It might be a coincidence, and it does require verification, but our findings could be too important to not publish them now."
Sun surprise
The full implications of the discovery are unclear. Haigh says that the current solar cycle could be different from previous cycles, for unknown reasons. But it is also possible that the effects of solar variability on atmospheric temperatures and ozone are substantially different from what has previously been assumed.
...
www.nature.com...
With the Sun acting strangely, the Earth's magnetic field weaker than it was at least over 170 years ago if not more, and because of the weaker interplanetary magnetic field Earth is receiving more radiation and more energy on overall.
The sun itself is reacting strangely to the changes the entire Solar System is undergoing.
edit on 23-1-2017 by ElectricUniverse because: add comment.
a reply to: Arbitrageur
Oh, and btw, I at least admitted my mistake, but you haven't admitted any of your mistakes... From first claiming that the graph you gave showed 0.0000005 w/m, then you claimed NASA said this solar activity (visible light and soft x-rays) increased by 100, when they wrote it increased by 1,000.
That's not even mentioning that the instruments for the data you showed would not detect a lot of energy ranges in which soft x-rays are emitted by our sun. I even showed you that astrophysicists were pointing this out, and that the new instruments detecting this activity in our sun was actually showing an increase in activity the sun (visible light and soft x-rays) has been emitting in a time when the sun's other activity, such as sunspots has slowed to a crawl.
www.ssl.berkeley.edu...
The sun itself is not acting as it had done during times like the LIA (Little Ice Age) which proves the entire solar system is receiving more and more energy, as well as interstellar dust, which does affect the sun, and affects planets with an atmosphere like Earth.
edit on 26-1-2017 by ElectricUniverse because: add and correct comment.
a reply to: ElectricUniverse
www.swpc.noaa.gov...
Interesting article from Nature. But it does not say that TSI increased between 2004 and 2007, nor does the data. But what it does say is that the assumed (by some) link between solar activity and climate may be inverse rather than direct.
The chart you show seems to show solar activity related to the 11 year solar cycle (as are soft x-ray and radio emissions), the previous minimum being in 2009. It is quite normal for solar activity to increase after the solar minimum and to decrease after the maximum.
I even showed you that astrophysicists were pointing this out, and that the new instruments detecting this activity in our sun was actually showing an increase in activity the sun (visible light and soft x-rays) has been emitting in a time when the sun's other activity, such as sunspots has slowed to a crawl.
www.swpc.noaa.gov...
Interesting article from Nature. But it does not say that TSI increased between 2004 and 2007, nor does the data. But what it does say is that the assumed (by some) link between solar activity and climate may be inverse rather than direct.
edit on 1/27/2017 by Phage because: (no reason
given)
originally posted by: Phage
The chart you show seems to show solar activity related to the 11 year solar cycle (as are soft x-ray and radio emissions), the previous minimum being in 2009. It is quite normal for solar activity to increase after the solar minimum and to decrease after the maximum.
www.swpc.noaa.gov...
Except for the fact that during this cycle sunspots had slowed down and instead of the sun reducing the amount of energy it emitted soft x-ray emissions and visible light increased.
I even pointed this out in another thread
...
The new soft X-ray data differed from previous data studies in another respect as well. By parsing out the amounts of each individual wavelength of light gathered, the team could identify what elements were present in the corona. Typically, the abundance of some of these atoms in the corona is greater than at the sun's surface. But not so in these recent observations. The mix of material in the corona was more similar to the mix seen at the solar surface, suggesting that some material from the surface was somehow rising up higher into the atmosphere.
...
www.nasa.gov...
www.abovetopsecret.com...
originally posted by: Phage
Interesting article from Nature. But it does not say that TSI increased between 2004 and 2007, nor does the data. But what it does say is that the assumed (by some) link between solar activity and climate may be inverse rather than direct.
You keep avoiding statements made in these studies like it was the plague, and for an obvious reason.
...
An analysis of satellite data challenges the intuitive idea that decreasing solar activity cools Earth, and vice versa. In fact, solar forcing of Earth's surface climate seems to work the opposite way around — at least during the current Sun cycle.
...
"We're seeing — albeit limited to a very short period — a very interesting change in solar irradiation with remarkably similar changes in ozone," says Haigh. "It might be a coincidence, and it does require verification, but our findings could be too important to not publish them now."
Sun surprise
The full implications of the discovery are unclear. Haigh says that the current solar cycle could be different from previous cycles, for unknown reasons. But it is also possible that the effects of solar variability on atmospheric temperatures and ozone are substantially different from what has previously been assumed.
...
www.nature.com...
This solar cycle has been different from what the sun normally does. During the LIA the sun's sunspots slowed to a crawl and it plunged the Earth to a very cold period, but this time around, for some unknown reason (not really that unknown since the solar system has been entering a new region of the Local Interstellar cloud) meanwhile sunspots had slowed considerable, and the sun's own magnetic field had been weakening some of it's activity had increased. This is suggesting something else cause these changes to our sun that normally don't occur..
BTW, the sun emitting more visible light during a period when sunspots and the sun's magnetic field itself has been weakening it's different to how our sun has acted in the past.
Ironic how you keep trying to change what these studies actually say.
edit on 28-1-2017 by ElectricUniverse because: add comment.
a reply to: ElectricUniverse
You see, the data presented in the paper shows that TSI did indeed decrease between 2004 and 2007. Maybe you should look at it more closely.
That is not what your source says. Really. It does not say that. If you look at the data (and the study) there was no increase in TSI over the period of the study. You seem to be confusing TSI with the radiation received at the top of the troposphere.
Except for the fact that during this cycle sunspots had slowed down and instead of the sun reducing the amount of energy it emitted soft x-ray emissions and visible light increased.
You see, the data presented in the paper shows that TSI did indeed decrease between 2004 and 2007. Maybe you should look at it more closely.
edit on 1/28/2017 by Phage because: (no reason given)
a reply to: Phage
For crying out loud...
Here is another study, and try not to twist what it actually says will ya?...
arxiv.org...
SXR (Soft x-rays) events have increased during SC (Solar Cycle) 23 than during SC 21 or 22. Once again corroborating my statements and argument.
BTW, even the NASA article states the sun has been emitting more soft x-rays than it is supposed to, or at least as it used to do in other solar cycles that have been studied.
As for TSI... You are more than familiar with Dr Wilson's research, because I have posted them responding to your past false statements about TSI. Wilson is the Principal Investigator of NASA's ACRIM experiments and his conclusions, as well as his colleagues have disagreed with many of your past claims that TSI hadn't been increasing.
As for the new study that shows and proves visible light from our sun has also been increasing and has warmed the atmosphere. You should let the real experts speak instead of claiming the contrary to what they say.
www.nature.com...
If you disagree with their conclusions and their statements, and not what you try to twist them to be, then write and try to publish your own research to Nature, or some other scientific journal with your false evidence, I mean with your claims.
For crying out loud...
Here is another study, and try not to twist what it actually says will ya?...
1
STATISTICAL ANALYSIS OF SOFT X-RAY SOLAR FLARES DURING SOLAR CYCLES 21, 22 AND 23
Navin Chandra Joshi*, a, Neeraj Singh Bankoti a, Seema Pande b, Bimal Pande a, Wahab Uddin c and Kavita Pandey a
a Department of Physics, DSB Campus, Kumaun University, Naini Tal –263 002, Uttarakhand, India b Department of Physics, MBPG. College, Haldwani, Kumaun University, Naini Tal, Uttarakhand, India c Aryabhatta Research Institute of Observational Sciences, Naini Tal –263 129, Uttarakhand, India
*E-mail address: [email protected]
ABSTRACT
...
Our study shows that during SC 23 we have more SXR flare events having shorter decay time than the rise time
as compared to SCs 21 and 22
arxiv.org...
SXR (Soft x-rays) events have increased during SC (Solar Cycle) 23 than during SC 21 or 22. Once again corroborating my statements and argument.
BTW, even the NASA article states the sun has been emitting more soft x-rays than it is supposed to, or at least as it used to do in other solar cycles that have been studied.
As for TSI... You are more than familiar with Dr Wilson's research, because I have posted them responding to your past false statements about TSI. Wilson is the Principal Investigator of NASA's ACRIM experiments and his conclusions, as well as his colleagues have disagreed with many of your past claims that TSI hadn't been increasing.
As for the new study that shows and proves visible light from our sun has also been increasing and has warmed the atmosphere. You should let the real experts speak instead of claiming the contrary to what they say.
....
Joanna Haigh, an atmospheric physicist at Imperial College London, and her colleagues analysed daily measurements of the spectral composition of sunlight made between 2004 and 2007 by NASA's Solar Radiation and Climate Experiment (SORCE) satellite. They found that the amount of visible light reaching Earth increased as the Sun's activity declined — warming the Earth's surface. Their unexpected findings are published today in Nature1.
...
Radiation leak
Haigh's team compared SORCE's solar spectrum data with wavelengths predicted by a standard empirical model based mainly on sunspot numbers and area, and noticed unexpected differences. The amount of ultraviolet radiation in the spectrum was four to six times smaller than that predicted by the empirical model, but an increase in radiation in the visible wavelength, which warms the Earth's surface, compensated for the decrease.
Contrary to expectations, the net amount of solar energy reaching Earth's troposphere — the lowest part of the atmosphere — seems to have been larger in 2007 than in 2004, despite the decline in solar activity over that period.
...
www.nature.com...
If you disagree with their conclusions and their statements, and not what you try to twist them to be, then write and try to publish your own research to Nature, or some other scientific journal with your false evidence, I mean with your claims.
edit on 29-1-2017 by ElectricUniverse because: correct excerpt.
edit on 29-1-2017 by ElectricUniverse because: add and correct
comment.
In the scientific matter formed electromagnetic voids school of thought, the ionization would affect the entire line of sight areas below, maybe
that's why the equatorial people have smooth skin, and the people in Wyoming are all wrinkled in the face?, no?
new topics
-
Maestro Benedetto
Literature: 1 hours ago -
Is AI Better Than the Hollywood Elite?
Movies: 1 hours ago -
Las Vegas UFO Spotting Teen Traumatized by Demon Creature in Backyard
Aliens and UFOs: 4 hours ago -
2024 Pigeon Forge Rod Run - On the Strip (Video made for you)
Automotive Discussion: 5 hours ago -
Gaza Terrorists Attack US Humanitarian Pier During Construction
Middle East Issues: 6 hours ago -
The functionality of boldening and italics is clunky and no post char limit warning?
ATS Freshman's Forum: 7 hours ago -
Meadows, Giuliani Among 11 Indicted in Arizona in Latest 2020 Election Subversion Case
Mainstream News: 7 hours ago -
Massachusetts Drag Queen Leads Young Kids in Free Palestine Chant
Social Issues and Civil Unrest: 8 hours ago -
Weinstein's conviction overturned
Mainstream News: 9 hours ago -
Supreme Court Oral Arguments 4.25.2024 - Are PRESIDENTS IMMUNE From Later Being Prosecuted.
Above Politics: 10 hours ago
top topics
-
Krystalnacht on today's most elite Universities?
Social Issues and Civil Unrest: 11 hours ago, 9 flags -
Supreme Court Oral Arguments 4.25.2024 - Are PRESIDENTS IMMUNE From Later Being Prosecuted.
Above Politics: 10 hours ago, 8 flags -
University of Texas Instantly Shuts Down Anti Israel Protests
Education and Media: 13 hours ago, 7 flags -
Weinstein's conviction overturned
Mainstream News: 9 hours ago, 7 flags -
Gaza Terrorists Attack US Humanitarian Pier During Construction
Middle East Issues: 6 hours ago, 7 flags -
Massachusetts Drag Queen Leads Young Kids in Free Palestine Chant
Social Issues and Civil Unrest: 8 hours ago, 6 flags -
Meadows, Giuliani Among 11 Indicted in Arizona in Latest 2020 Election Subversion Case
Mainstream News: 7 hours ago, 5 flags -
Las Vegas UFO Spotting Teen Traumatized by Demon Creature in Backyard
Aliens and UFOs: 4 hours ago, 4 flags -
2024 Pigeon Forge Rod Run - On the Strip (Video made for you)
Automotive Discussion: 5 hours ago, 2 flags -
Any one suspicious of fever promotions events, major investor Goldman Sachs card only.
The Gray Area: 15 hours ago, 2 flags
active topics
-
University of Texas Instantly Shuts Down Anti Israel Protests
Education and Media • 231 • : Xtrozero -
Post A Funny (T&C Friendly) Pic Part IV: The LOL awakens!
General Chit Chat • 7135 • : underpass61 -
Nearly 70% Of Americans Want Talks To End War In Ukraine
Political Issues • 94 • : Scratchpost -
VP's Secret Service agent brawls with other agents at Andrews
Mainstream News • 62 • : ByeByeAmericanPie -
SETI chief says US has no evidence for alien technology. 'And we never have'
Aliens and UFOs • 72 • : yuppa -
My Poor Avocado Plant.
General Chit Chat • 77 • : JonnyC555 -
New whistleblower Jason Sands speaks on Twitter Spaces last night.
Aliens and UFOs • 61 • : Ophiuchus1 -
Is AI Better Than the Hollywood Elite?
Movies • 2 • : 5thHead -
Gaza Terrorists Attack US Humanitarian Pier During Construction
Middle East Issues • 25 • : CarlLaFong -
Mood Music Part VI
Music • 3102 • : Hellmutt