It looks like you're using an Ad Blocker.
Please white-list or disable AboveTopSecret.com in your ad-blocking tool.
Thank you.
Some features of ATS will be disabled while you continue to use an ad-blocker.
7
share:
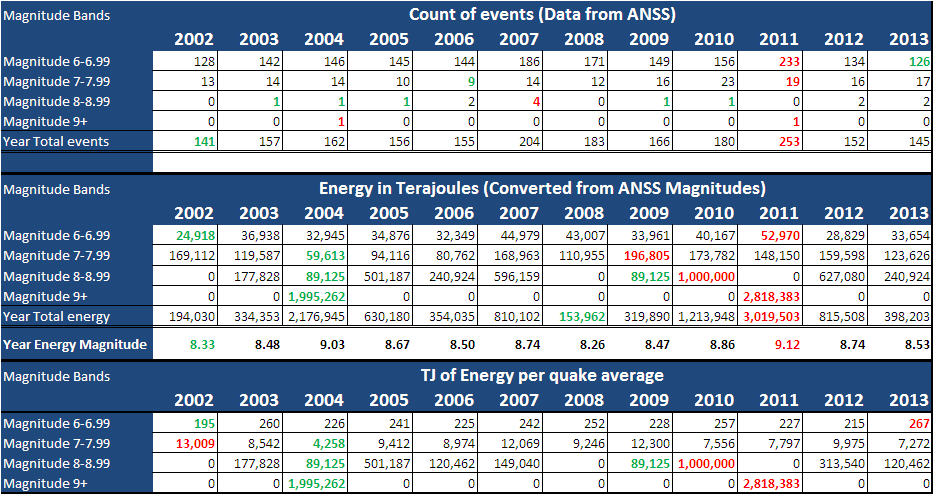
Whilst overall 2013 was pretty much middling year in terms of energy release it has the distinction of having the lowest number of magnitude 6 to 6.99
earthquakes in any of the past 14 years, the next being 2002.
The curious thing however is that if also has the distinction of having the highest average energy per magnitude 6 event in the past 14 years as well.
This is a trend that I have been remarking on for magnitude 5 band earthquakes as well.

Click the image to enlarge
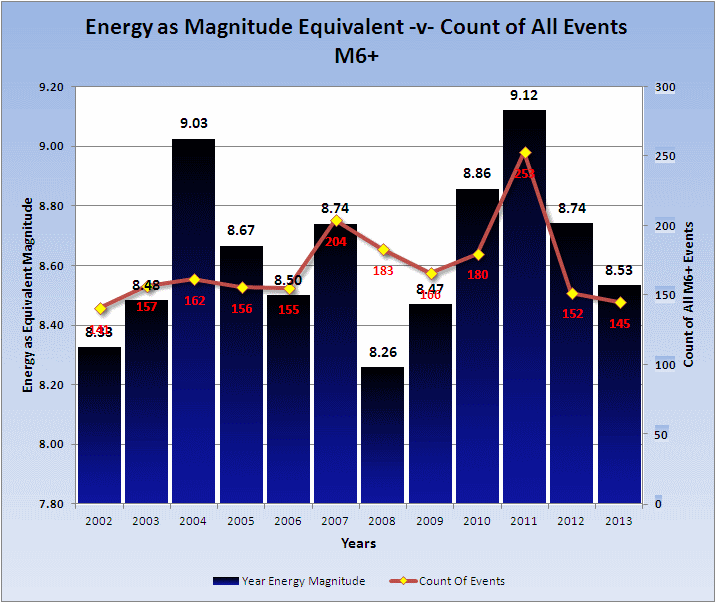
This high average energy release per magnitude 6 quake is all the more curious when the chart of counts versus energy shows a reasonable correlation otherwise.

Click the image to enlarge
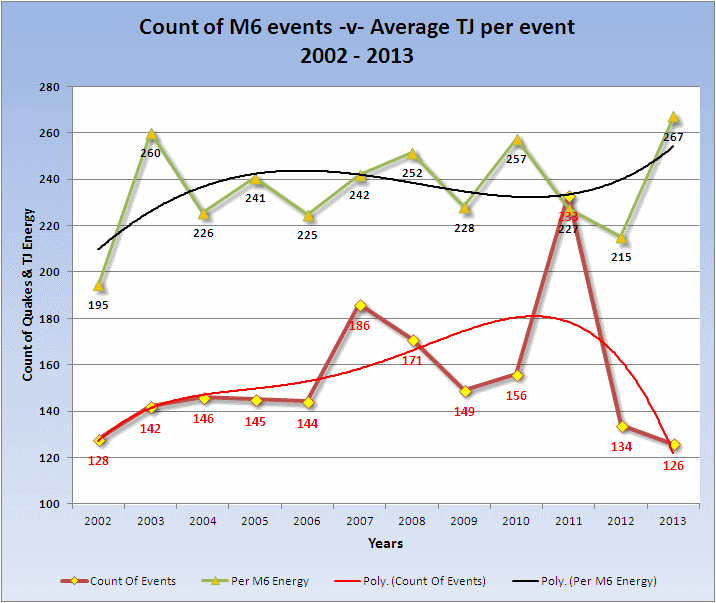
Looking at the average energy per magnitude 6 quake by comparison to the count of quakes you would expect a completely random value. It is not however quite as random as it seems and the twist in the tail during 2013 leaves the years with the lowest count and highest average energy as I said above. The trend in mag 5 not shown here as it is too complex also shows a departure of energy per quake to counts and these seem to be around the time of the double magnitude 8 in April 2013
11/04/2012 08:38:37, 8.6 Mw
11/04/2012 10:43:11, 8.2 Mw

Click the image to enlarge
When I have completed the magnitude 5 figures which will be about 3 months or so to allow for revisions, I may be able to pinpoint it to this double event.
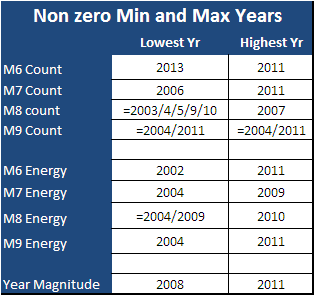
Here are the lowest and highest years as a table

All data is taken from ANSS.
The curious thing however is that if also has the distinction of having the highest average energy per magnitude 6 event in the past 14 years as well.
This is a trend that I have been remarking on for magnitude 5 band earthquakes as well.

Click the image to enlarge
This high average energy release per magnitude 6 quake is all the more curious when the chart of counts versus energy shows a reasonable correlation otherwise.

Click the image to enlarge
Looking at the average energy per magnitude 6 quake by comparison to the count of quakes you would expect a completely random value. It is not however quite as random as it seems and the twist in the tail during 2013 leaves the years with the lowest count and highest average energy as I said above. The trend in mag 5 not shown here as it is too complex also shows a departure of energy per quake to counts and these seem to be around the time of the double magnitude 8 in April 2013
11/04/2012 08:38:37, 8.6 Mw
11/04/2012 10:43:11, 8.2 Mw

Click the image to enlarge
When I have completed the magnitude 5 figures which will be about 3 months or so to allow for revisions, I may be able to pinpoint it to this double event.
Here are the lowest and highest years as a table

All data is taken from ANSS.
Could this be the calm before the storm?
I started following your thread late last year, and tho I don't have a clue what yore talking about 90% of the time, the other 10 is in dumbed-down English that I can grasp!
Based on your vast knowledge of Mother Earth and h faults- -what do you think possibilities/scenarios are?
Thanks for being our 'underground' eyes!
reply to post by nugget1
I am of the belief that this is the calm, but not before the storm - at least not for a while. I think things will be quiet for sometime, by which I mean there will not be a mag 9 quake for possibly 40 years UNLESS the Cascadia fault produces one in the next 3 to 5 years which is a possibility.
But the truth of the matter is that I know no better than anyone else. I base my feelings on solar cycles and think that IF we plunge into a maunder type minimum them things will be quiet. Having said that there is a big one out there somewhere waiting to happen - always. It is the way of the planet and our time spans are too short to adequately grasp what has been let alone what will come.
Historically we have very little to go on so I guess I can only guess like everyone else. I thank you for your faith in my abilities but I am no better at this than anyone else.
new topics
-
They Know
Aliens and UFOs: 4 hours ago -
Drones (QUESTION) TERMINATOR (QUESTION)
General Chit Chat: 5 hours ago -
Canada Banning more Shovels
General Chit Chat: 9 hours ago
7
