It looks like you're using an Ad Blocker.
Please white-list or disable AboveTopSecret.com in your ad-blocking tool.
Thank you.
Some features of ATS will be disabled while you continue to use an ad-blocker.

Volcano Watch 2014
page: 57share:
I do other stuff you know!
but it seems just to roll on at Bardarbunga
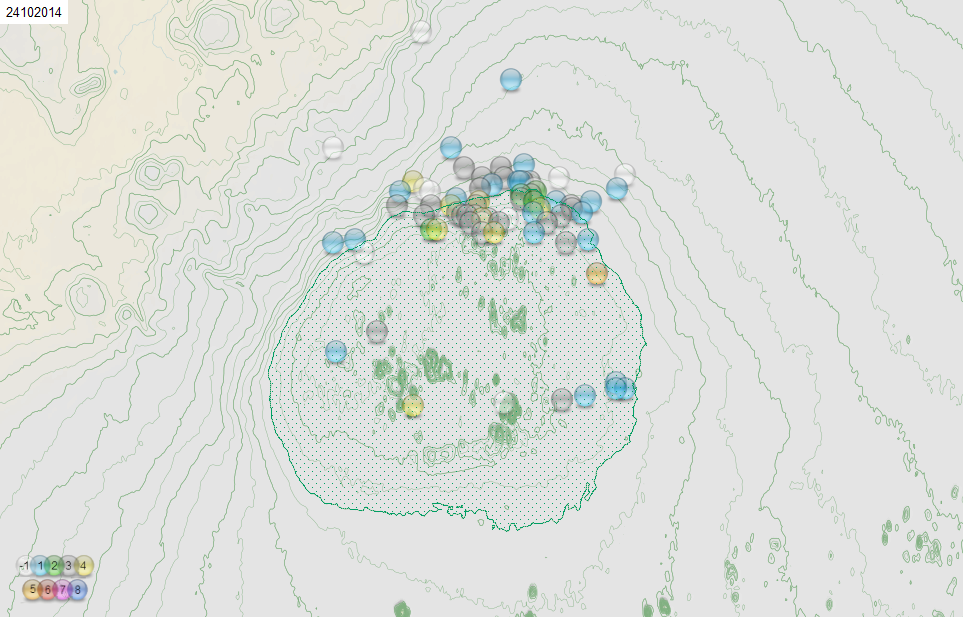
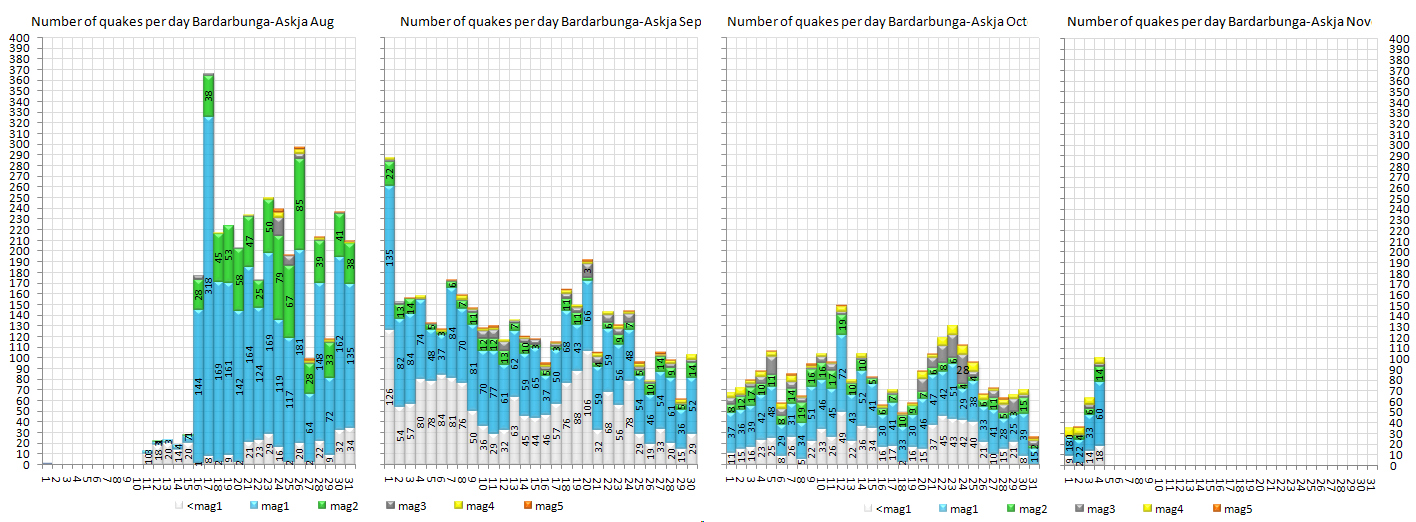
New Record for M3's yesterday (24th Oct) at the Caldera
mag3= 28 , mag4= 8 , mag5= 1
previous record was 24th August with 17 x M3's (older graphs here)
this latest image didn't make the animation. I will post them to the CalderaTopoImage page anyway, at the bottom
 rightclick"viewimage"forfullsize
but it seems just to roll on at Bardarbunga
New Record for M3's yesterday (24th Oct) at the Caldera
mag3= 28 , mag4= 8 , mag5= 1
previous record was 24th August with 17 x M3's (older graphs here)
this latest image didn't make the animation. I will post them to the CalderaTopoImage page anyway, at the bottom
edit on 1000000029729714 by muzzy because: oops forgot to put the image on
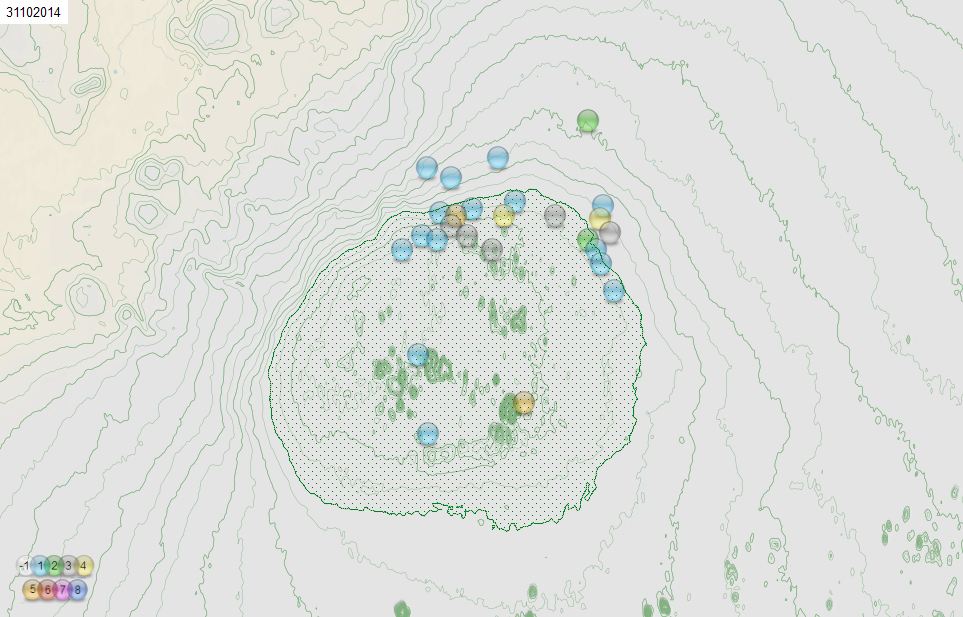
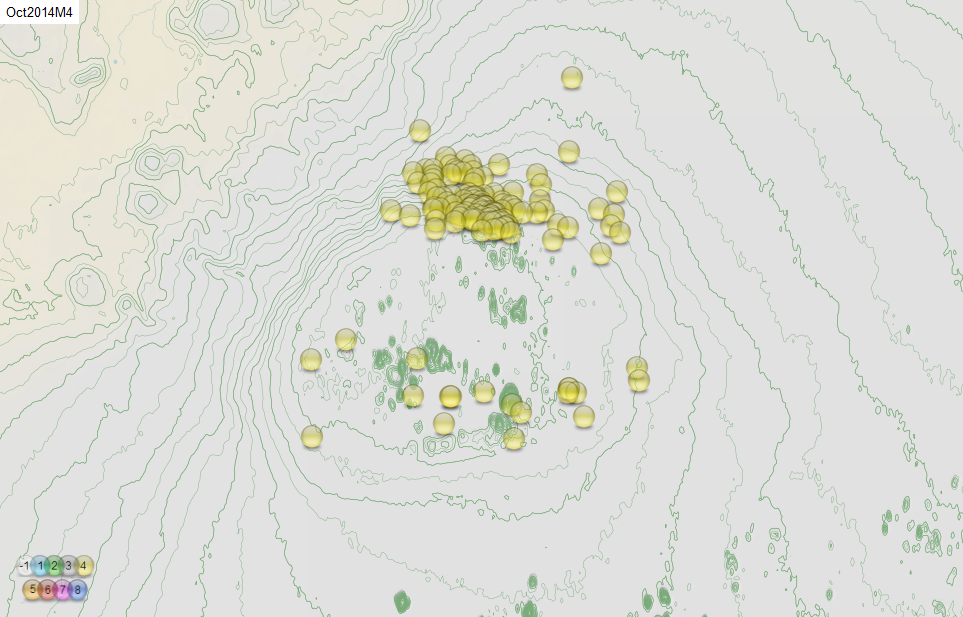
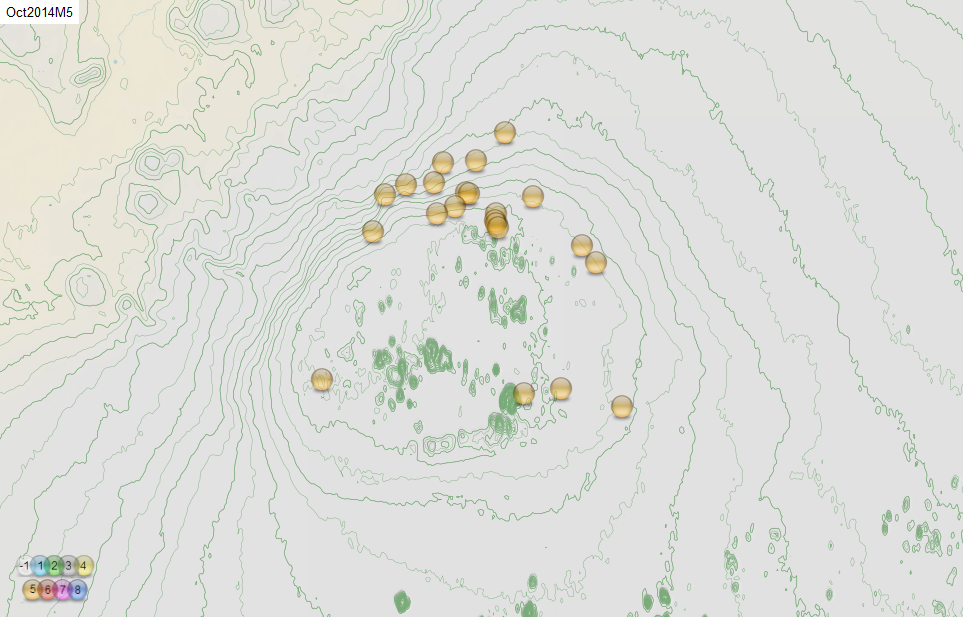
Bardarbunga Caldera
This animation is interesting
see how all the seismic activity has shifted east between Sept and October, or at least contracted to the shape of the Caldera
I didn't put the Caldera Rim Outline in, that seems to improve the quality
the Oct marbles pretty much shows where its at anyway
 rightclick"viewimage"forfullsize
This animation is interesting
see how all the seismic activity has shifted east between Sept and October, or at least contracted to the shape of the Caldera
I didn't put the Caldera Rim Outline in, that seems to improve the quality
the Oct marbles pretty much shows where its at anyway
edit on 10u29729714 by muzzy because: (no reason given)
The animations keep rolling off the laptop
i started out doing Herdubreid-Herdubreidartogl but got sidetracked to Upptyppingar
I like the name Upptyppingar, its like something out of a Lewis Carrol Alice in Wonderland story, actually a lot of Icelandic placenames do.
Where is the Cheshire Cat? in Upptyppingar? ha ha
anyway, a blast from the past
Upptyppingar Swarm 2007
I see an opportunity for more animations featuring Iceland, especially from Eyjafjallajokull-Katla in 2011 and of course all these can be broken down further from monthly images into weeks or days, depending on what kind of detail you want.
spent a lot of today trying to figure out the quality of the images. It seems when I start off with GIFs they can vary in colour between images, particularly the white icons lose their brightness, and the landscape changes dark to light sometimes, makes the animation seem splotchy, if I start with PNG images and convert them to GIF before creating the animation, they can look grainy on the animation.
Bit of a compromise necessary, I prefer consistent colour, so my animations may appear a bit grainy.
i started out doing Herdubreid-Herdubreidartogl but got sidetracked to Upptyppingar
I like the name Upptyppingar, its like something out of a Lewis Carrol Alice in Wonderland story, actually a lot of Icelandic placenames do.
Where is the Cheshire Cat? in Upptyppingar? ha ha
anyway, a blast from the past
Upptyppingar Swarm 2007
I see an opportunity for more animations featuring Iceland, especially from Eyjafjallajokull-Katla in 2011 and of course all these can be broken down further from monthly images into weeks or days, depending on what kind of detail you want.
edit on 1000000029829814 by muzzy because: (no
reason given)
spent a lot of today trying to figure out the quality of the images. It seems when I start off with GIFs they can vary in colour between images, particularly the white icons lose their brightness, and the landscape changes dark to light sometimes, makes the animation seem splotchy, if I start with PNG images and convert them to GIF before creating the animation, they can look grainy on the animation.
Bit of a compromise necessary, I prefer consistent colour, so my animations may appear a bit grainy.
edit on 1000000029829814 by muzzy because:
(no reason given)
web cams are on, and it looks like it has stopped snowing
looking forward to daylight to see whats new...........
www.livefromiceland.is...
that is if the weather holds
forecast is for Partly Cloudy/Cloudy through to Thursday
en.vedur.is...
edit:
doh, its going into nightime there! I forgot
Oh well there is always tomorrow (tonight) arggh, timezones!
looking forward to daylight to see whats new...........
www.livefromiceland.is...
that is if the weather holds
forecast is for Partly Cloudy/Cloudy through to Thursday
en.vedur.is...
edit:
doh, its going into nightime there! I forgot
Oh well there is always tomorrow (tonight) arggh, timezones!
edit on 10u29829814 by muzzy because: (no reason given)
Holuhraun has some competition - Kīlauea's lava flow fast approaching Pāhoa
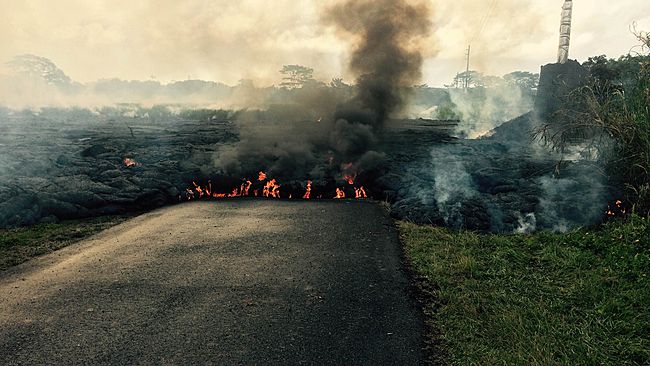 (Photo/USGS)
www.accuweather.com...
updating status reports from HVO
www.accuweather.com...
updating status reports from HVO
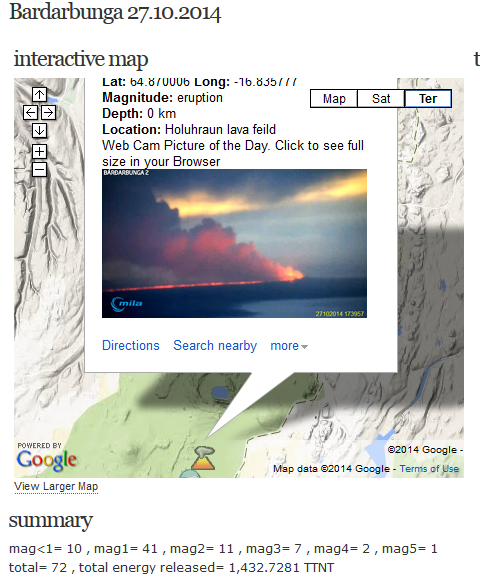
Bardarbunga-Holuhraun
Does anyone ever click on the little Volcano icon on the interactive maps?
Up till IMO stopped the daily reports I had a summary of those in there.
Now, a new feature, "Mila Web Cam Image of the Day"
Because there isn't much to see now with the snow covering the cameras, there isn't much to work with to put up separate Web Cam Images pages like I did earlier.
I have a few days stored that need editing, but really there has been nothing to see of any value since 19th Oct
So instead I have put the best pic inside the popup tag of the eruption icon
Starting today.
volcanictremor.wordpress.com...
edit on 1000000030030014 by muzzy because: (no reason given)
that's 2 days in a row the M5 for the day has been on the south of the Caldera Rim,
SE on the 26th, SW on the 27th
SE on the 26th, SW on the 27th
edit on 10u30030014 by muzzy because: (no reason given)
originally posted by: muzzy
anyway, a blast from the past
Upptyppingar Swarm 2007
On that page there is a summary of the 2007 swarm series and it mentions
"At the end of 2007, over 5,300 earthquakes had been detected and the region remained seismically active into 2008"
I got that from a pdf I found called
EARTHQUAKE SWARMS AT UPPTYPPINGAR, NORTH-EAST ICELAND: A SIGN OF MAGMA INTRUSION?
but wasn't sure how long this went on until just now, doing 2008.
holy smokes! March 2008
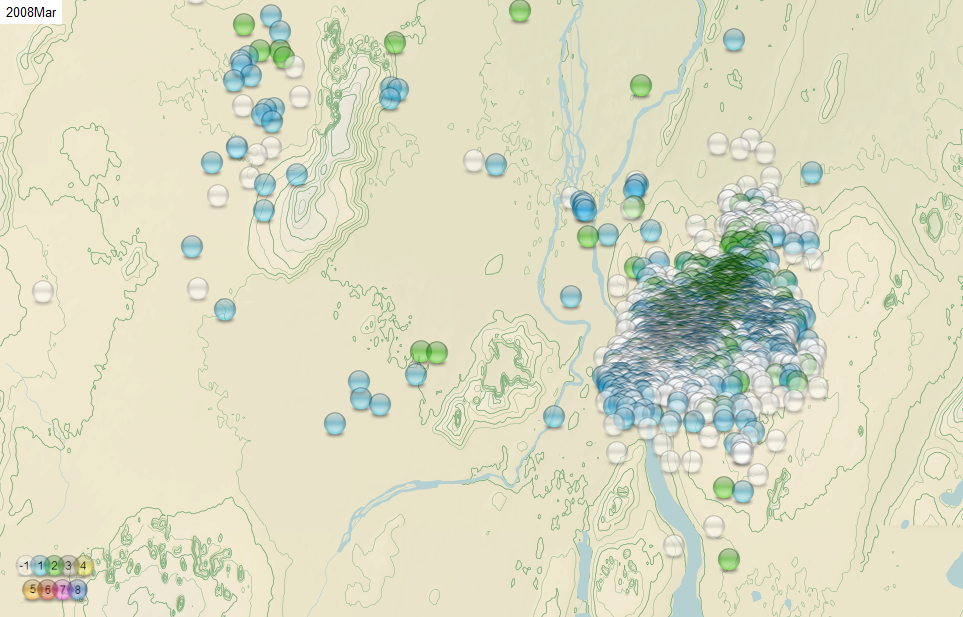
this is why researching earthquakes is so addictive, I have always been the type of person who wants to see whats just over the hill. I guess I won't be done until I get all the IMO data processed, this is a massive project, over half a million quakes in the database.
This Bardarbunga-Holuhraun series appears to be seismically unique for Iceland, so many M5's!!
a reply to: muzzy
That tapered away after March 2008, to be replaced with the aftershocks of the Mt.Ingolfsfjall M5.67 on 29/05/2008 at 15:45:58, which produced 10,647 aftershocks in the next 7 months to the end of 2008, in the area between Hveragerdi and Selfoss, also known as Olfus
That had 42 foreshocks on the 29th at 4.3-6.4km depth so there was some warning (if anyone has been watching) and in some papers have described it as a doublet with a composite magnitude of 6.1Mw
But that's another story, worth its own page
I see it only got 3 posts on Quake Watch 2008, Rabbit Chaser (post link) who is no longer a member, Hellmut and Apex(who still post)
edit on 1000000030030014 by muzzy because: (no reason given)
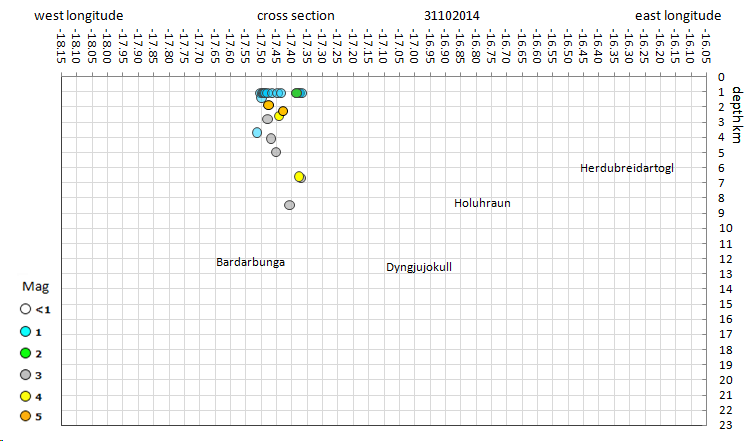
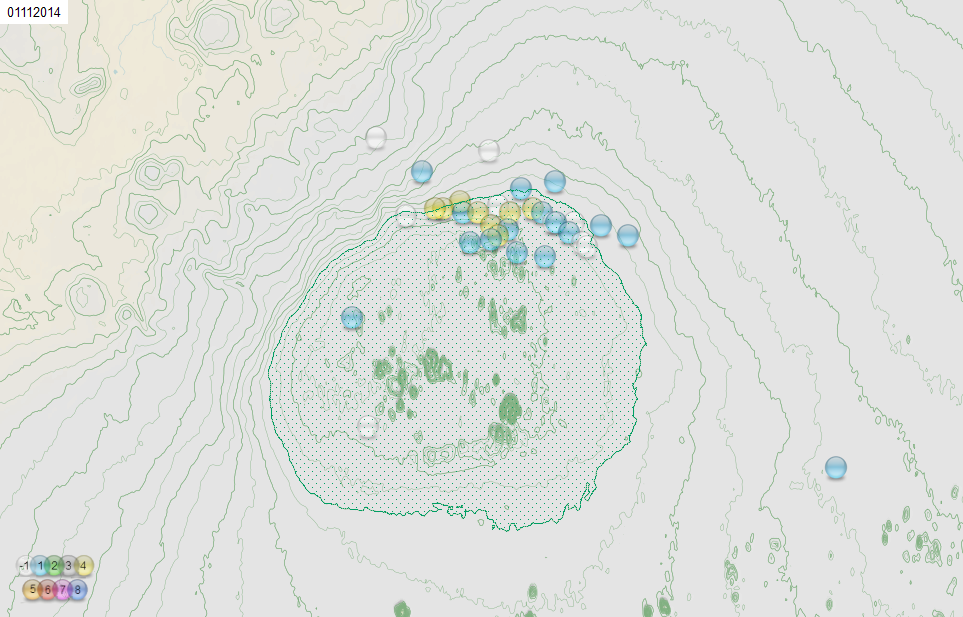
Situation Report from the Far Field Bardarbunga-Vatnajokull-Holuhraun Observatory (me) for 30.10.2014UTC
Seismic activity is consentrated on the North Rim of the Bardarbunga Caldera
with only 4 micro earthquakes, of less than M1, outside this area in Vatnajokull-Holuhraun
no activity in Askja or Herdubreid-Herdubreidartogl
summary for the 24 hours
mag less than mag1= 8 , mag1= 39 , mag2= 15 , mag3= 3 , mag4= 5 , mag5= 0
total= 70 , total energy released= 413.8328 TTNT
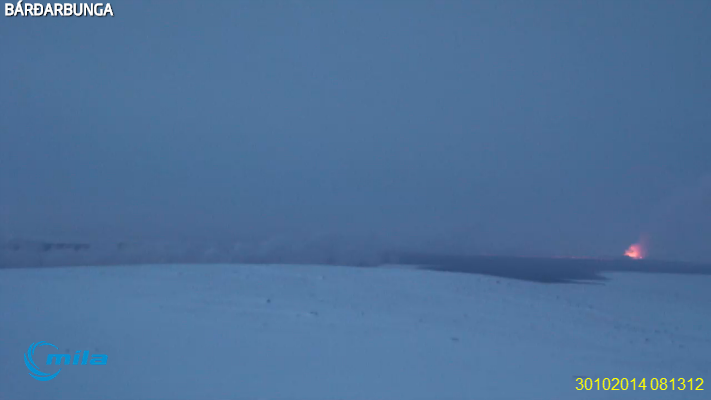
The eruption at Holuhraun continues
according to GPS measurments the Caldera Roof subsided a further 250mm overall in the 24 hour period, with a sharp drop around 6am UTC and then a rise between 9am and noon which gradually tapered back down again to just slightly above the level at 6am
Bardarbunga Caldera Map
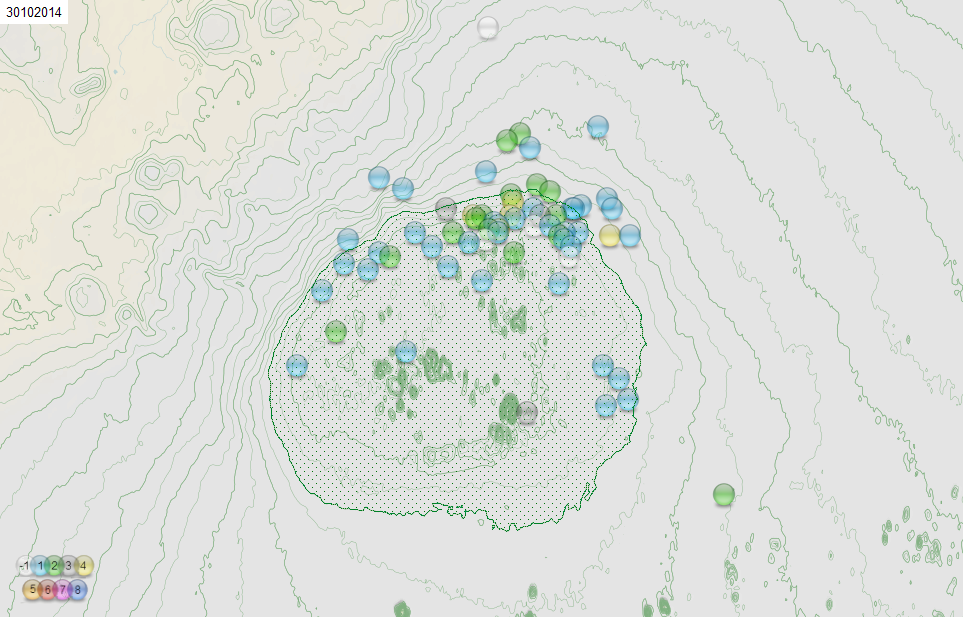
Mila Web Cams were working most of the morning before being obscured by weather
rightclick"viewimage"forfullsizes
Seismic activity is consentrated on the North Rim of the Bardarbunga Caldera
with only 4 micro earthquakes, of less than M1, outside this area in Vatnajokull-Holuhraun
no activity in Askja or Herdubreid-Herdubreidartogl
summary for the 24 hours
mag less than mag1= 8 , mag1= 39 , mag2= 15 , mag3= 3 , mag4= 5 , mag5= 0
total= 70 , total energy released= 413.8328 TTNT
The eruption at Holuhraun continues
according to GPS measurments the Caldera Roof subsided a further 250mm overall in the 24 hour period, with a sharp drop around 6am UTC and then a rise between 9am and noon which gradually tapered back down again to just slightly above the level at 6am
Bardarbunga Caldera Map
Mila Web Cams were working most of the morning before being obscured by weather
rightclick"viewimage"forfullsizes
edit on 10u30330314 by muzzy because: (no reason given)
edit on 1000000030330314 by muzzy
because: (no reason given)
Daily status report 31. October 2014 - compiled by IMO (Icelandic Met Office) and IES (Institute of Earth Sciences)
The volcanic eruption in Holuhraun continues with similar intensity. The lava field is now 65,7 square kilometres.
The GPS station in the centre of Bardarbunga show that the subsidence of the caldera continues with similar rate as it has done over the last few weeks. The total depression in the caldera is now about 42 meters.
abridged
earthice.hi.is...
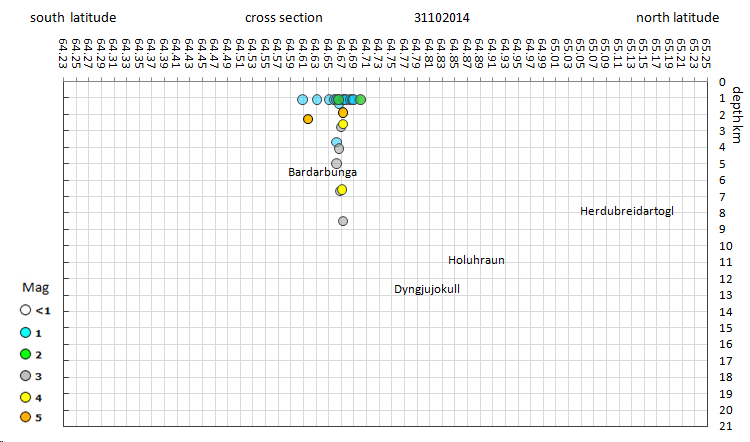
Situation Report from the VT (me) for 31.10.2014UTC
* Todays map and graphs should be treated with caution, possibly due to Gale Force Easterly winds very few total and no earthquakes below M1 have been recorded.
summary
mag less than 1= 0 , mag1= 15 , mag2= 2 , mag3= 5 , mag4= 2 , mag5= 2
total= 26 , total energy released= 2,412.5360 TTNT
VT page with that and more
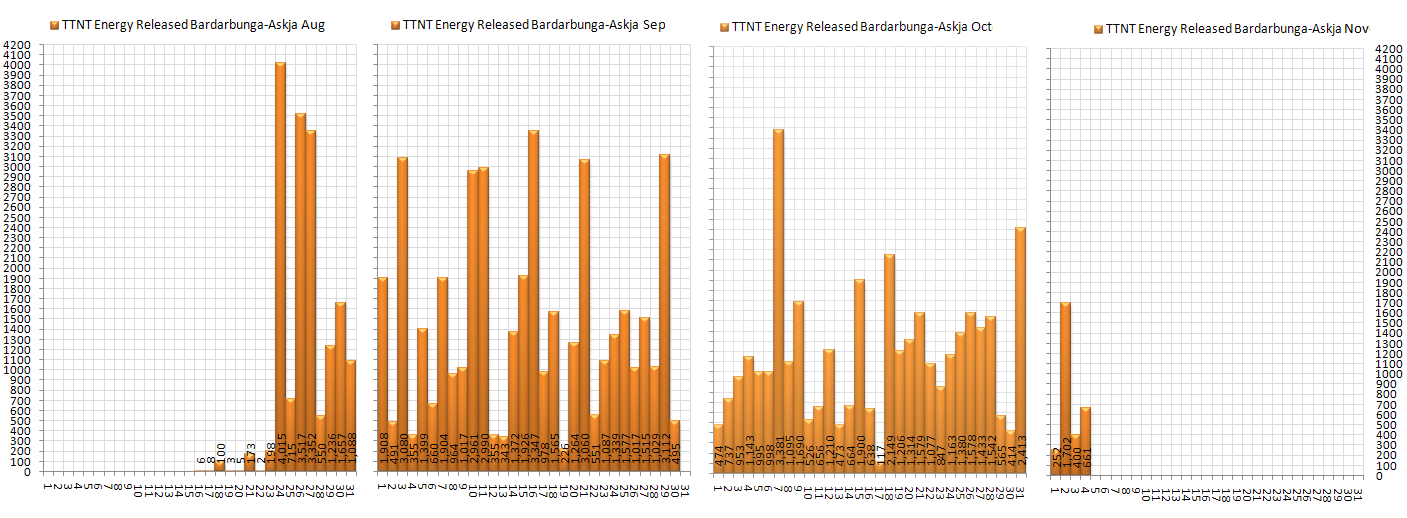
Month of October Summary
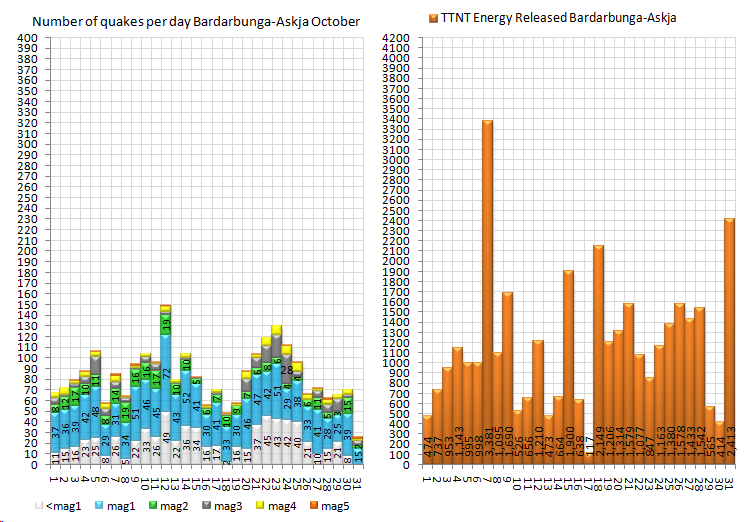
mag less than 1= 699 , mag1= 1214 , mag2= 301
mag3= 203 , mag4= 127 , mag5= 25
total= 2,569 total energy released= 36,311.021 TTNT
rightclick"viewimage"forfullsizeversions
edit on 11u30430414 by muzzy because: (no reason given)
edit on 11u30430414 by muzzy because: (no reason given)
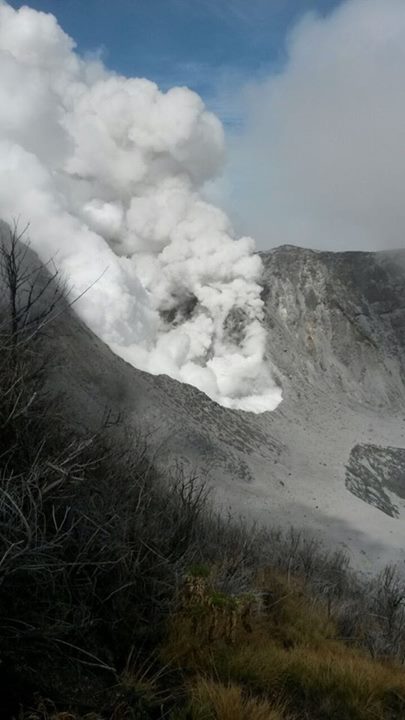
Costa Rica emergency officials on alert following explosions, ash spewing at Turrialba Volcano
more
Smithsonian info on Turrialba
oh yeah
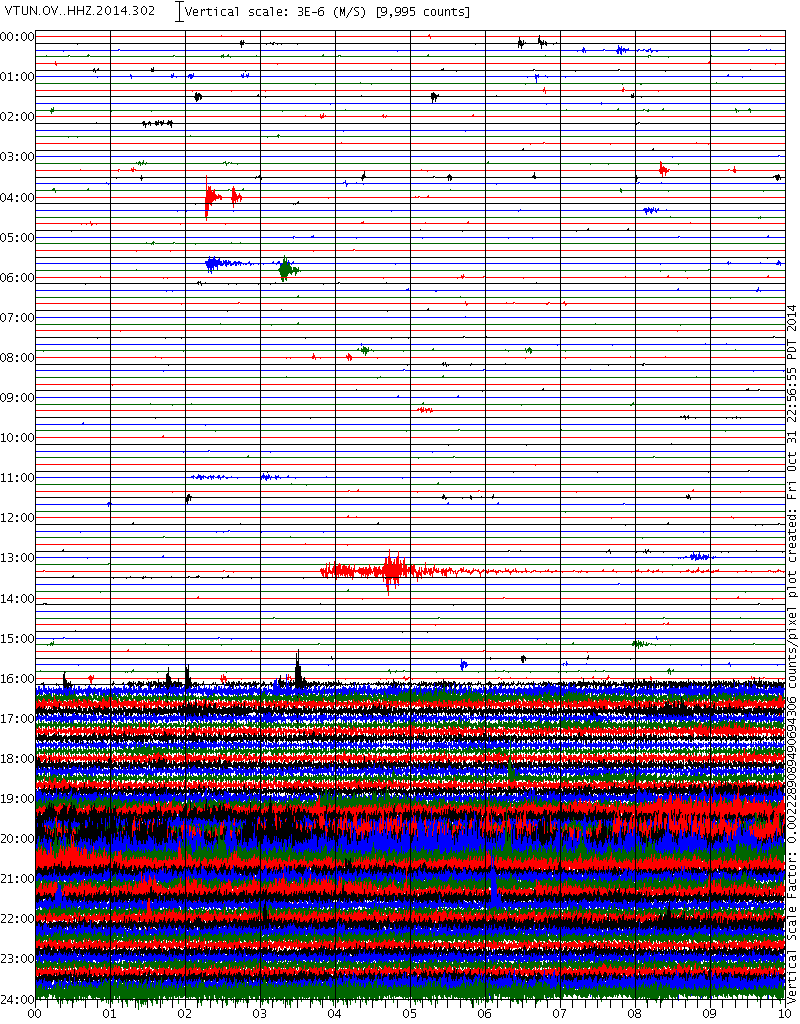
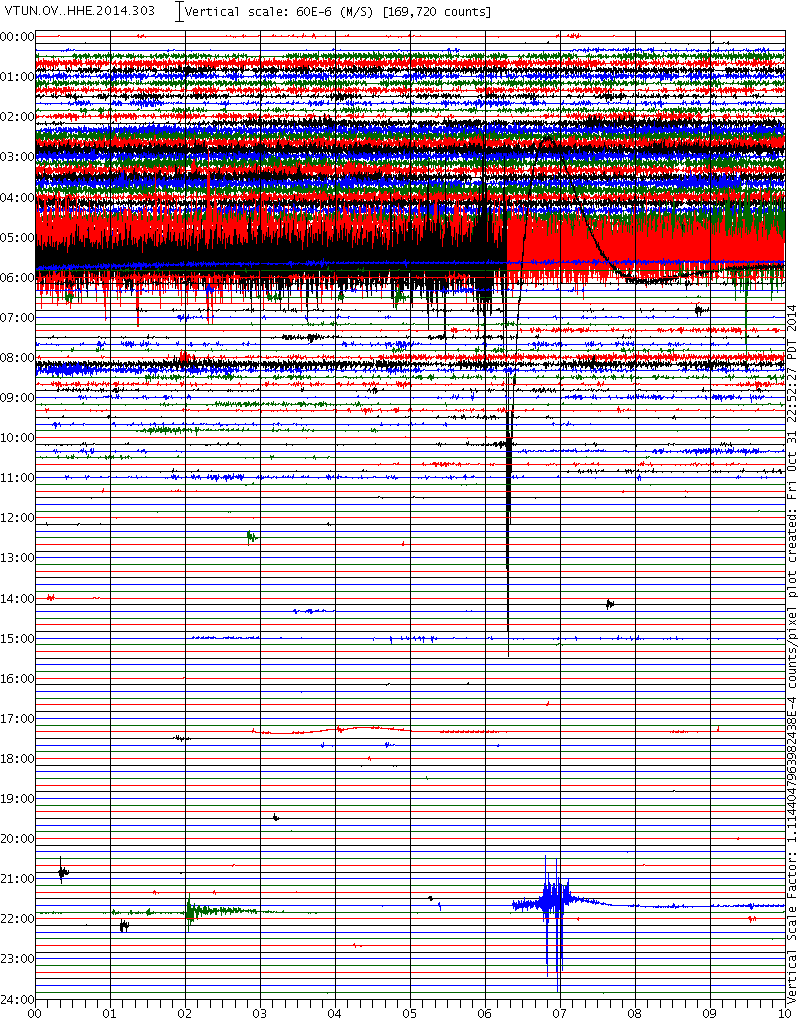
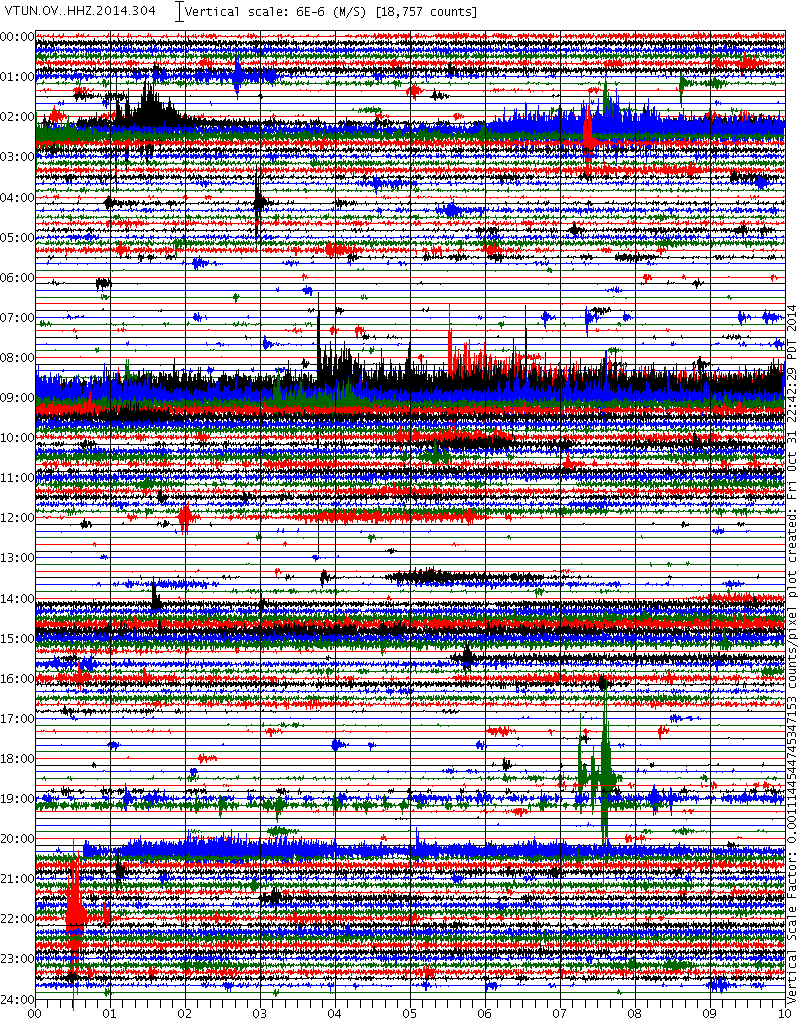
Station VTUN :: CRATER CENTRAL, Volcan Turrialba, Cartago
ds.iris.edu...
ds.iris.edu...
ds.iris.edu...
(links good for 15 days)
more helicorders from OVSICORI-A won't be there for long
Loud rumblings and ash covering roofs, gardens, roads and cars are the first results of increased activity at Turrialba Volcano, located northeast of the province Cartago, that started late Wednesday evening. According to the National Seismological Network (RSN), the eruption is the volcano’s largest in 150 years.
Experts from the University of Costa Rica (UCR) and National University (UNA) reported increased seismic activity on Wednesday afternoon, and at 11:10 p.m. they recorded a phreatic explosion at the volcano. The fumarole from the explosion reached several hundred meters, Carlos Ramírez, a vulcanologist at the crater, told The Tico Times. Ramírez said that the eruption involved ash, rocks and possibly magma.
more
edit on 1100000030430414 by muzzy because: go the tags mixed up
Smithsonian info on Turrialba
oh yeah
Station VTUN :: CRATER CENTRAL, Volcan Turrialba, Cartago
ds.iris.edu...
ds.iris.edu...
ds.iris.edu...
(links good for 15 days)
more helicorders from OVSICORI-A won't be there for long
edit on 11u30430414 by muzzy because: the way the ATS format is set up the links below the graphs look like they belong to the one below
the text, when in fact they are for the one above, so I had to take time to go back and alter it so it makes sense. That needs fixing Mr. ATS
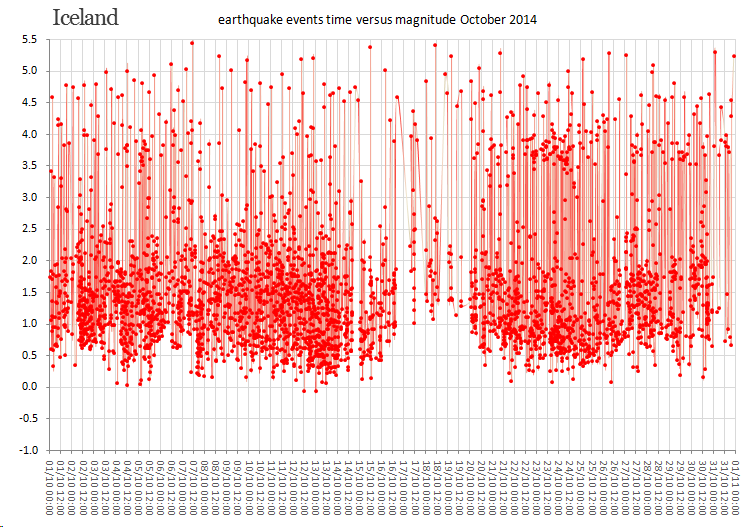
Iceland October 2014
Fat Lady can't sing on October yet, bit of a anomally Oct 16-20 on the graph, needs further investigation.
Keeping in mind this data is reviewed and supposedly has 99% quality.
Figures for Preliminary data from IMO were;
17th - 70
18th - 48
19th - 58
Reviewed data from IMO shows for all of Iceland
17th - 17
18th - 26
19th - 17
unless I did something wrong in the processing
I'll have a look into it
In the meantime here are some new Caldera maps to look at for October
I can't give you the figures for the Caldera (or even the whole Vatnajokull area) yet as I need to break those out of the overall Iceland data.
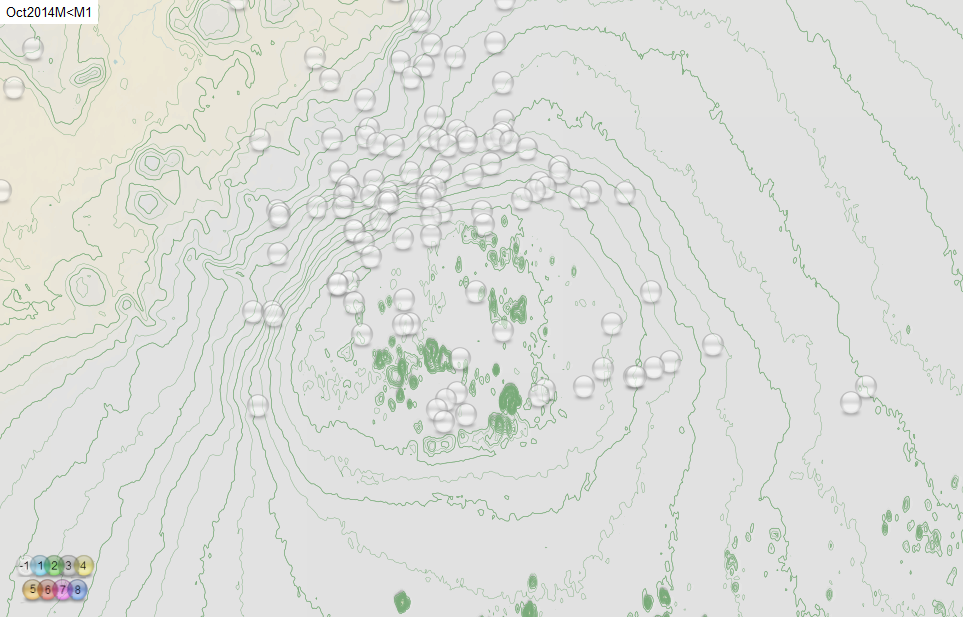
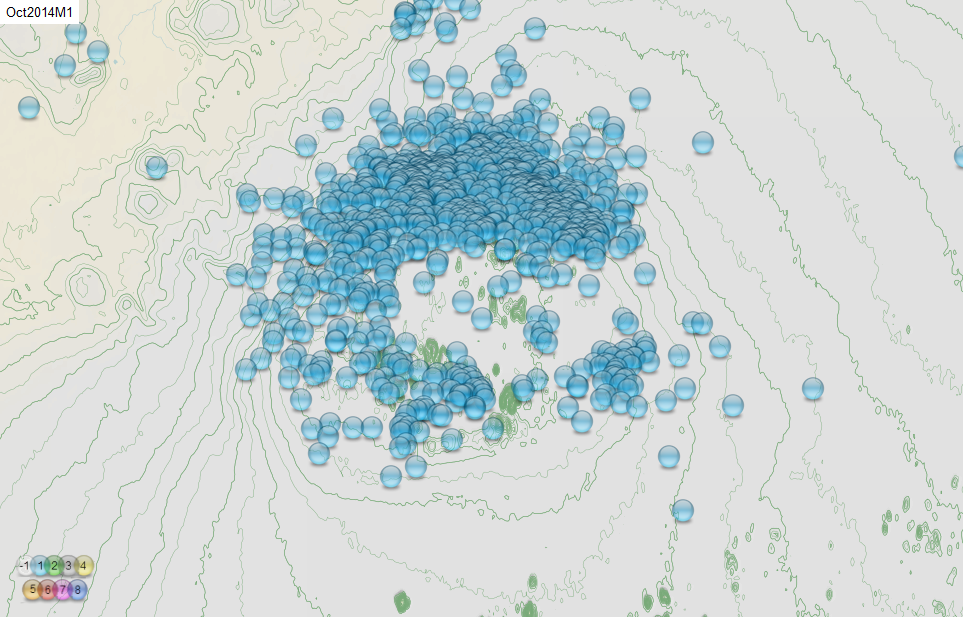
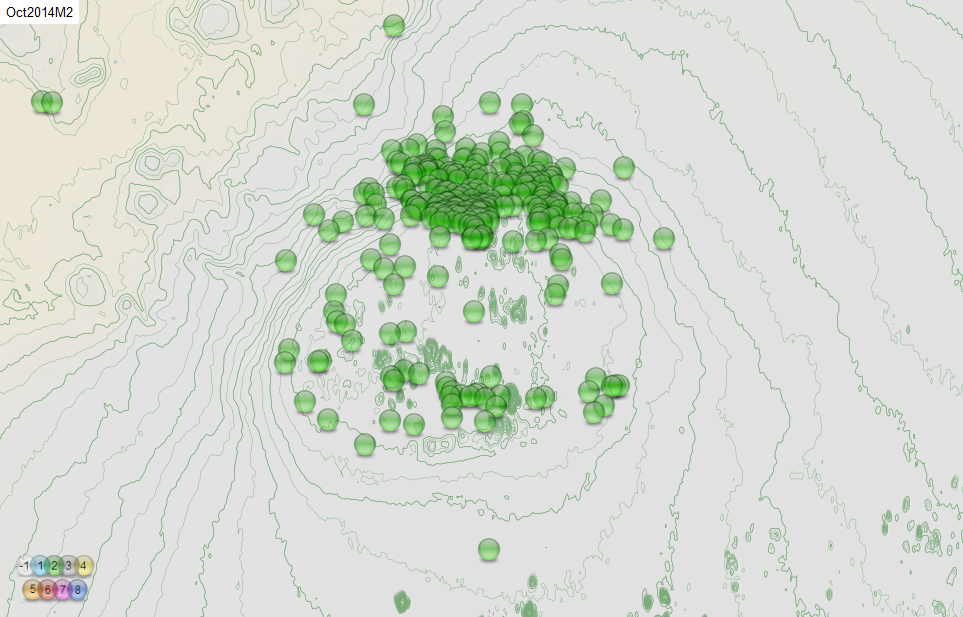
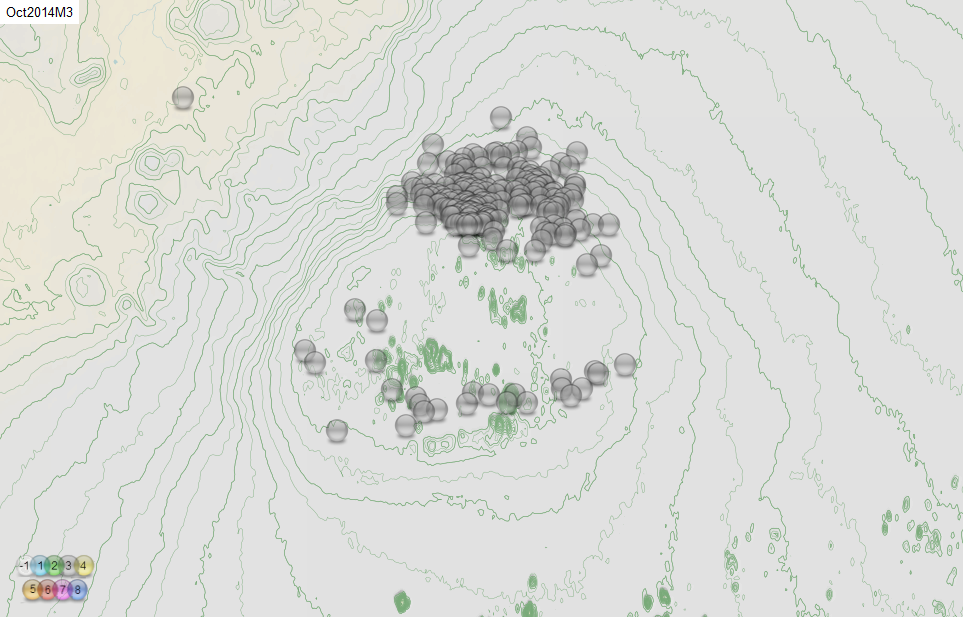
combined
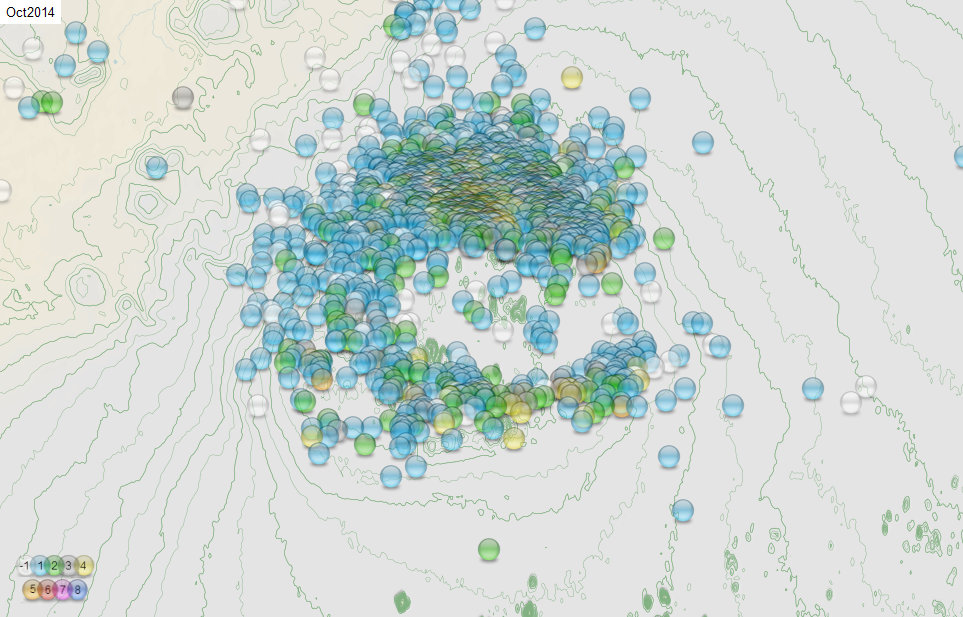
and finally, all magnitudes since Aug 1st
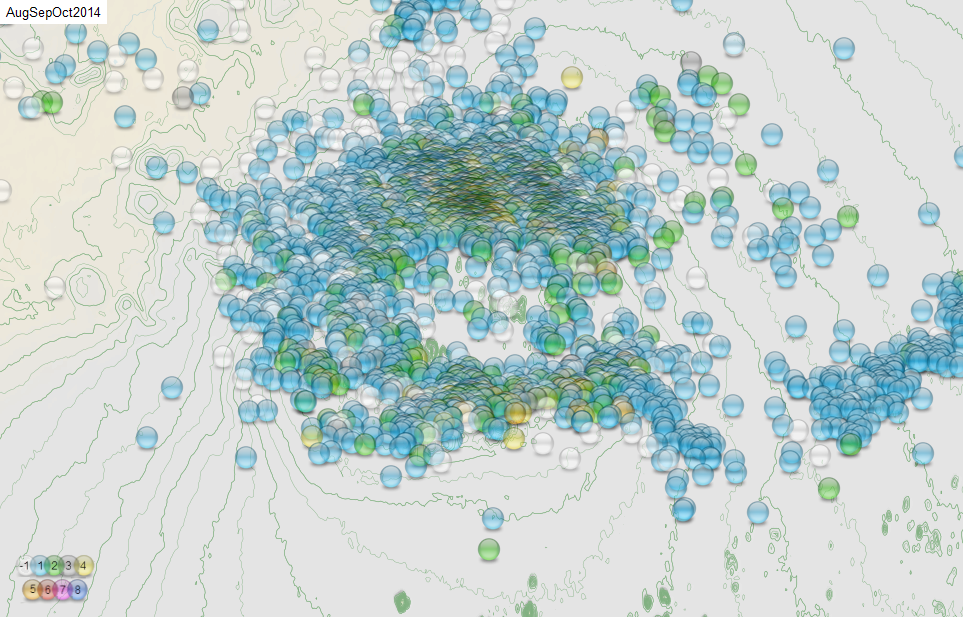
rightclick"viewimage"forfullsizeversions
maybe I should start a new topic just on Bardarbunga Caldera?, there are so many things you can do with the IMO data
I may be flooding Volcano Watch 2014 with too much Bardarbunga stuff???
on review reviewed data vesrus the preliminary data;
Border Search Co-ordinates for the area IMO call Vatnajokull
65.302642, -18.304362
64.115824, -15.565144
October 2014
Reviewed data
magless1= 767 , mag1= 1198 , mag2= 318 , mag3= 217 , mag4= 137 , mag5= 22
total= 2659 , total energy released= 38,745.5394 TTNT
Preliminary data
magless1= 699 , mag1= 1214 , mag2= 301 , mag3= 203 , mag4= 127 , mag5= 25
total= 2,569 , total energy released= 36,311.021 TTNT
In conclusion;
more less than M1's, less M1's, more M2's, less M3's, more M4's, less M5's
more energy released
Fat Lady can't sing on October yet, bit of a anomally Oct 16-20 on the graph, needs further investigation.
Keeping in mind this data is reviewed and supposedly has 99% quality.
Figures for Preliminary data from IMO were;
17th - 70
18th - 48
19th - 58
Reviewed data from IMO shows for all of Iceland
17th - 17
18th - 26
19th - 17
unless I did something wrong in the processing
I'll have a look into it
In the meantime here are some new Caldera maps to look at for October
I can't give you the figures for the Caldera (or even the whole Vatnajokull area) yet as I need to break those out of the overall Iceland data.
combined
and finally, all magnitudes since Aug 1st
rightclick"viewimage"forfullsizeversions
maybe I should start a new topic just on Bardarbunga Caldera?, there are so many things you can do with the IMO data
I may be flooding Volcano Watch 2014 with too much Bardarbunga stuff???
edit on 11u30430414 by muzzy because: rightclick"viewimage"forfullsizeversions
on review reviewed data vesrus the preliminary data;
Border Search Co-ordinates for the area IMO call Vatnajokull
65.302642, -18.304362
64.115824, -15.565144
October 2014
Reviewed data
magless1= 767 , mag1= 1198 , mag2= 318 , mag3= 217 , mag4= 137 , mag5= 22
total= 2659 , total energy released= 38,745.5394 TTNT
Preliminary data
magless1= 699 , mag1= 1214 , mag2= 301 , mag3= 203 , mag4= 127 , mag5= 25
total= 2,569 , total energy released= 36,311.021 TTNT
In conclusion;
more less than M1's, less M1's, more M2's, less M3's, more M4's, less M5's
more energy released
edit on 1100000030430414 by muzzy because: re: more less than M1's. Its a mouthfull, but I can't use the < here because its a html tag and
cuts off whatever is after it
originally posted by: muzzy
Iceland October 2014
Figures for Preliminary data from IMO were;
17th - 70
18th - 48
19th - 58
Reviewed data from IMO shows for all of Iceland
17th - 17
18th - 26
19th - 17
I checked it out again and the results are correct.
This is where one must treat the Conclusions of the Scientific Advisory Board of the Icelandic Civil Protection with caution, for example they say in the 31st October report;
200 earthquakes have been detected in the caldera over the last 48 hours. Just over ten earthquakes were bigger then magnitude M4,0. The largest one was M5,3 tonight at 01:30.
Around 20 smaller earthquakes are detected in the dyke and at the eruption site in Holuhraun, all around magnitude M1,0 and smaller.
So they are talking in terms of 48 hour period, in this case covering the 30th and 31st Oct (because the 31st is the day of the 5.3 @ 1:30)
The IMO data only shows 96 earthquakes total for the 48 hours.
So they are quoting automatic preliminary data, including below 90% quality
that doesn't stack up on review.
Call me Mr. 90.01%+ then
Every day has a surprise
01.11.2014
mag les than 1= 9
mag1= 18
mag2= 0
mag3= 0
mag4= 8
mag5= 0
total= 35
TTNT= 251.503
Every day has a surprise
01.11.2014
mag les than 1= 9
mag1= 18
mag2= 0
mag3= 0
mag4= 8
mag5= 0
total= 35
TTNT= 251.503
This Bardarbunga activity has been ongoing longer than anyone expected, and there is no signs of stopping, the activity has remained similar for quite
a long time. This activity is quite rare, sign of something changing. If this still continues, there is increasing change of big changes in
Vatnajökull glacier. I'm surprised how long the caldera has stayed intact with that deflation, common sense says at some point it should break.
a reply to: Thebel
The Scientific Advisory Board of the Icelandic Civil Protection said the other day total deflation of the caldera was 42metres, yet the graph IMO puts out only shows 20metres.
Even so depends where the main magma chamber roof is at, Bardarbunga is 2000 metres high, 42 metres is nothing.
They say nothing about Baugar (the new cone down on Holuhraun lava field created by the fissure eruption) it must be at least 42 metres high now.
edit on 11u30530514 by muzzy because: (no reason given)
a reply to: muzzy
They placed the GPS in the caldera after it had already deflated by 20 meters or so (the initial deflation prompted them to place a gps) they include it in the total deflation when mentioning it in updates.
I can't remember how they could tell it had dropped though or how accurate there estimates were.
a reply to: LadyTrick
Yeah that makes sense, I see the first date on the GPS graph is 12/09/2014, almost a month from when the quakes started. Thanks for clearing that up.
I would have thought it would be better to include that 20m in the graph i.e. instead of starting at 0m, start the blue line at 20m.
Perhaps the line wouldn't look so steep then, as time goes on it will get steeper, as the Y axis compresses.
Tungnafellsjokull-Bardarbunga-Dyngjujokull-Holuhraun-Askja-Herdubreid-Herdubreidartogl area
also known on IMO as Vatnajökull
Some Numbers and Graphs
rightclick"viewimage"forfullsize
summary (preliminary data)
mag~1 = 2,743
mag1 = 5,634
mag2 = 1,335
mag3 = 372
mag4 = 230
mag5 = 64
total = 10,378
TTNT = 99,838
also known on IMO as Vatnajökull
Some Numbers and Graphs
rightclick"viewimage"forfullsize
summary (preliminary data)
mag~1 = 2,743
mag1 = 5,634
mag2 = 1,335
mag3 = 372
mag4 = 230
mag5 = 64
total = 10,378
TTNT = 99,838
new topics
-
Michigan school district cancels lesson on gender identity and pronouns after backlash
Education and Media: 1 minutes ago -
When an Angel gets his or her wings
Religion, Faith, And Theology: 54 minutes ago -
Comparing the theology of Paul and Hebrews
Religion, Faith, And Theology: 1 hours ago -
Pentagon acknowledges secret UFO project, the Kona Blue program | Vargas Reports
Aliens and UFOs: 2 hours ago -
Boston Dynamics say Farewell to Atlas
Science & Technology: 2 hours ago -
I hate dreaming
Rant: 3 hours ago -
Man sets himself on fire outside Donald Trump trial
Mainstream News: 5 hours ago -
Biden says little kids flip him the bird all the time.
Politicians & People: 5 hours ago -
The Democrats Take Control the House - Look what happened while you were sleeping
US Political Madness: 6 hours ago -
Sheetz facing racial discrimination lawsuit for considering criminal history in hiring
Social Issues and Civil Unrest: 6 hours ago
top topics
-
The Democrats Take Control the House - Look what happened while you were sleeping
US Political Madness: 6 hours ago, 16 flags -
In an Historic First, In N Out Burger Permanently Closes a Location
Mainstream News: 8 hours ago, 14 flags -
A man of the people
Medical Issues & Conspiracies: 13 hours ago, 8 flags -
Biden says little kids flip him the bird all the time.
Politicians & People: 5 hours ago, 8 flags -
Man sets himself on fire outside Donald Trump trial
Mainstream News: 5 hours ago, 7 flags -
Pentagon acknowledges secret UFO project, the Kona Blue program | Vargas Reports
Aliens and UFOs: 2 hours ago, 5 flags -
4 plans of US elites to defeat Russia
New World Order: 15 hours ago, 4 flags -
Sheetz facing racial discrimination lawsuit for considering criminal history in hiring
Social Issues and Civil Unrest: 6 hours ago, 3 flags -
Boston Dynamics say Farewell to Atlas
Science & Technology: 2 hours ago, 3 flags -
Are you ready for the return of Jesus Christ? Have you been cleansed by His blood?
Religion, Faith, And Theology: 10 hours ago, 3 flags
active topics
-
Israeli Missile Strikes in Iran, Explosions in Syria + Iraq
World War Three • 102 • : DumbNut -
Michigan school district cancels lesson on gender identity and pronouns after backlash
Education and Media • 0 • : Consvoli -
The Democrats Take Control the House - Look what happened while you were sleeping
US Political Madness • 61 • : Threadbarer -
I hate dreaming
Rant • 5 • : ScarletDarkness -
Man sets himself on fire outside Donald Trump trial
Mainstream News • 32 • : cherokeetroy -
Pentagon acknowledges secret UFO project, the Kona Blue program | Vargas Reports
Aliens and UFOs • 5 • : Ophiuchus1 -
-@TH3WH17ERABB17- -Q- ---TIME TO SHOW THE WORLD--- -Part- --44--
Dissecting Disinformation • 546 • : MetalThunder -
Boston Dynamics say Farewell to Atlas
Science & Technology • 4 • : Terpene -
12 jurors selected in Trump criminal trial
US Political Madness • 111 • : WeMustCare -
Election Year 2024 - Interesting Election-Related Tidbits as They Happen.
2024 Elections • 68 • : WeMustCare