It looks like you're using an Ad Blocker.
Please white-list or disable AboveTopSecret.com in your ad-blocking tool.
Thank you.
Some features of ATS will be disabled while you continue to use an ad-blocker.

Seismicity 2012 so far – Earthquakes Mag 6+ to 31 Oct
page: 115
share:
Seismicity 2012 so far – Earthquakes Mag 6+ to October 31st
As we trundle on to destruction on 21st December 2012 (NOT!) I thought it would be a good time to look at the year so far (To October 31).
The charts below are for Magnitude 6 or greater earthquakes using data from the ANSS catalog. Each chart can viewed full-size by clicking on the thumbnail image. They are just too big to show in line.
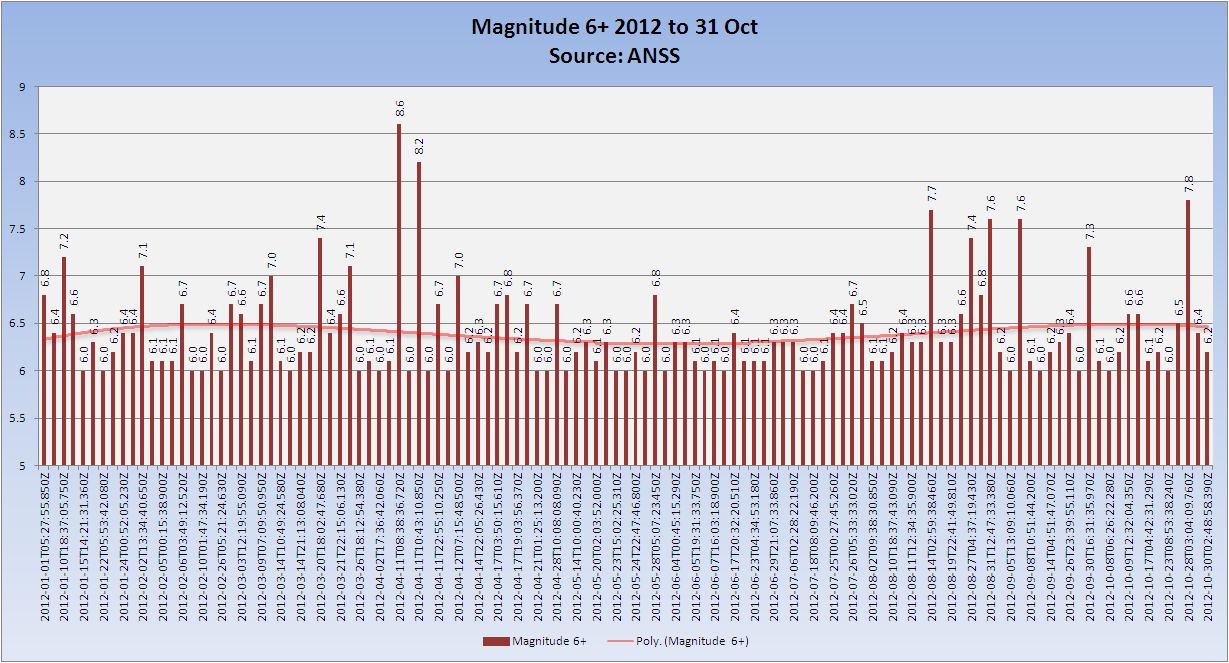
Earthquakes 2012 to 31st Oct for Magnitude
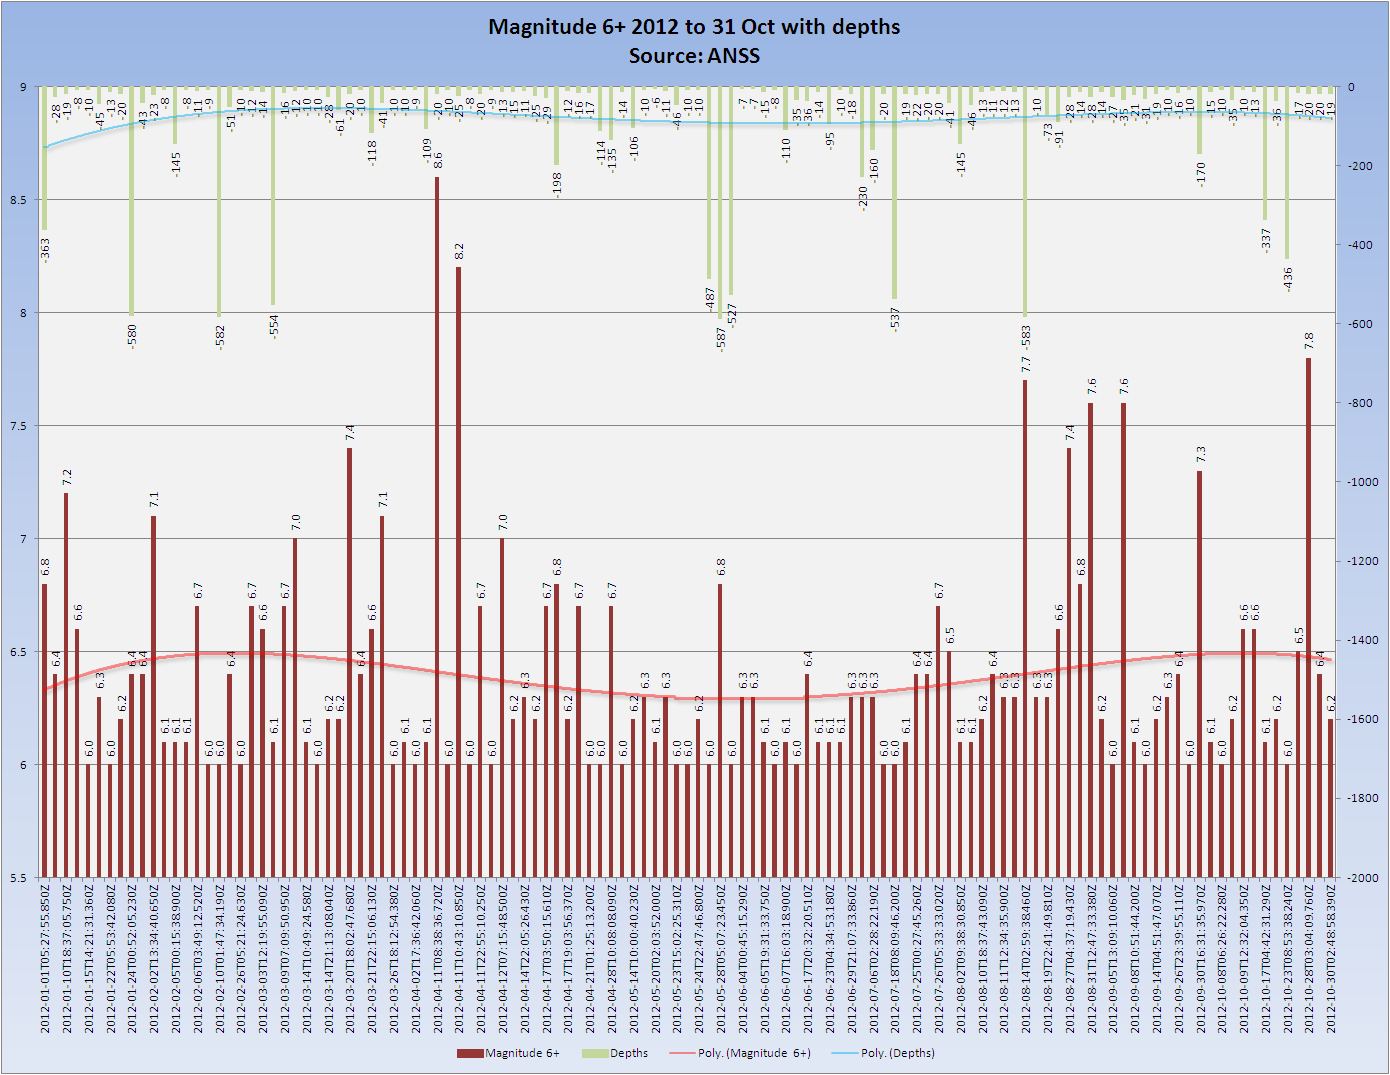
The next chart shows the same figures, but with depths above the earthquakes. What is particularly curious is that the polynomial trend line of the magnitudes pretty much matches the polynomial trendline of the depths. I find that somewhat odd and have no explanation for it. By the way as a linear trend both are completely flat.
Earthquakes 2012 to 31st Oct for Magnitude with depths
Finally the energy output. To be honest tis chart is difficult to read as not only are the numbers very large but the two Magnitude 8+ earthquakes swamp everything else. I have tried to make it display some part of a bar for every earthquake by setting the bottom of the scale to a negative number.
Earthquakes 2012 to 31st Oct for Energy
(PS this one is in reverse order)
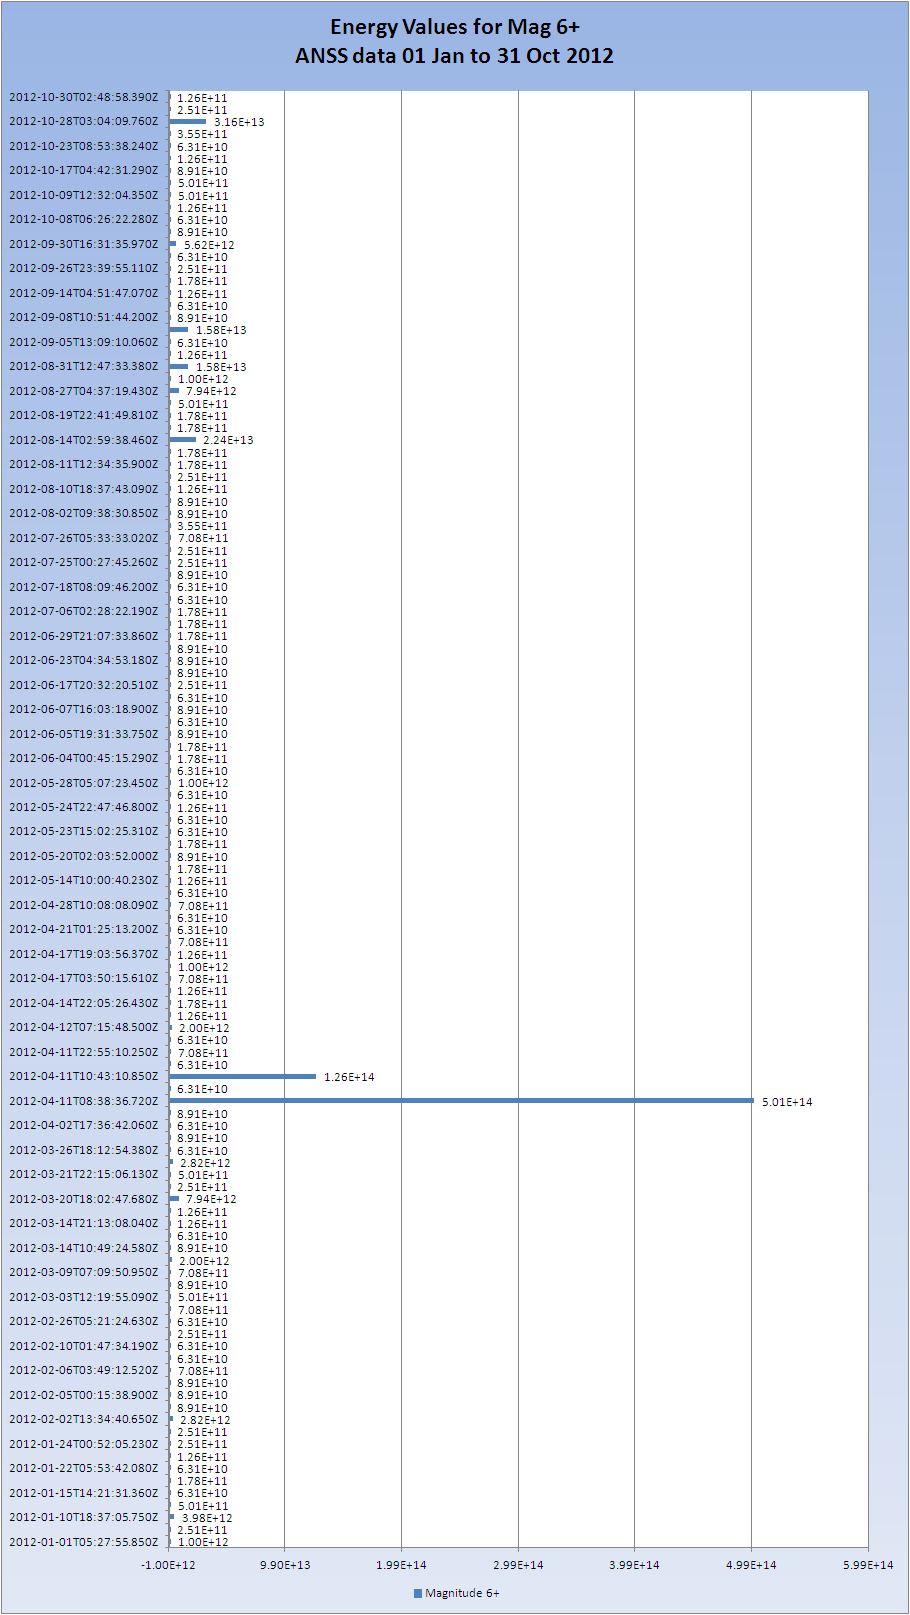
Converting that energy back to a magnitude the total so far for 2012 is Magnitude 8.72 if it all happened as one single earthquake.
There is a distinctly quieter period in the 'middle' and of later it has got busier, but this is NOT unprecedented. The Northern hemisphere often produces more earthquakes in the autumn/winter/spring months than it does in the summer. Since the bulk of the world's land mass is in the northern hemisphere this does skew the figures slightly.
At the end of October we have 119 earthquakes of Mag 6 or greater
12 were Magnitude 7 range and 2 were Magnitude 8 range giving 105 of Magnitude 6 range. I would just add that it is not clear if at least 2 of the magnitude 6 earthquakes in the list are in fact duplicated from different network sources so the Magnitude 6 range number MAY be 103.
My original estimate for 2012 was
1 x ~8.5
16 x 7.0-7.99
120 x 6.0-6.99
and a total energy output of 600 Petajoules.
Well so far we have 2 Mag 8 so I was wrong on that and this has skewed the energy figure which stands at 771.7 Petajoules. I guess that was a failure as far as predictions go then! Other than that we may see a small shortfall on the Mag 7 (I hope) and possibly also a small shortfall on the Mag 6 band.
Thank you Puterman,
Very informative information. I have to be off to work, but when I get home tonite I will look at more closely.
Very informative information. I have to be off to work, but when I get home tonite I will look at more closely.
reply to post by PuterMan
Hey you going to update this again come december 1st as this months looks to be pretty active
Hey you going to update this again come december 1st as this months looks to be pretty active
reply to post by lurksoften
Yes I may well. It certainly is interesting this little burst of activity getting us prepared for the 21st
Yes I may well. It certainly is interesting this little burst of activity getting us prepared for the 21st
Thanks Puterman..
Your contributions to ATS are outstanding..
Shock of shocks - 2012 is following the statistical averages for earthquakes. Numbers don't lie.
earthquake.usgs.gov...
earthquake.usgs.gov...
reply to post by redtic
no they don't, but you would not have said that last year when there were 19 Mag 7, 1 Mag 9.1 and 204 Mag 6
And, just as a by the way, this was not intended as anything other than a statement of facts since that is what I deal in, in case you were thinking I was implying something else.
Shock of shocks - 2012 is following the statistical averages for earthquakes. Numbers don't lie.
no they don't, but you would not have said that last year when there were 19 Mag 7, 1 Mag 9.1 and 204 Mag 6
And, just as a by the way, this was not intended as anything other than a statement of facts since that is what I deal in, in case you were thinking I was implying something else.
edit on 12/11/2012 by PuterMan because: (no reason given)
Originally posted by PuterMan
And, just as a by the way, this was not intended as anything other than a statement of facts since that is what I deal in, in case you were thinking I was implying something else.
Nope, I didn't take the OP any other way - in my (perhaps awkward) response, I was directing mainly at the chicken littles that point to "increased seismic activity" as a sign of the end of the world..
Oh, and yes I would say that about 2011 - I suspect that the count was well within the margin of error.. Now, if we start having 1000s of 6+ quakes a year, then we can start panicking.
edit on 12-11-2012 by redtic because: (no reason given)
Hey Puterman. Love your stuff. Was wondering if you could comment on what you think about this video.
www.youtube.com...
Also the gentlemen states he believes there is some relationship with sun activity towards the middle of the video.
Your thoughts?
Thanks.
www.youtube.com...
Also the gentlemen states he believes there is some relationship with sun activity towards the middle of the video.
Your thoughts?
Thanks.
new topics
-
God's Righteousness is Greater than Our Wrath
Religion, Faith, And Theology: 2 hours ago -
Electrical tricks for saving money
Education and Media: 6 hours ago -
VP's Secret Service agent brawls with other agents at Andrews
Mainstream News: 7 hours ago -
Sunak spinning the sickness figures
Other Current Events: 8 hours ago -
Nearly 70% Of Americans Want Talks To End War In Ukraine
Political Issues: 8 hours ago -
Late Night with the Devil - a really good unusual modern horror film.
Movies: 10 hours ago -
Cats Used as Live Bait to Train Ferocious Pitbulls in Illegal NYC Dogfighting
Social Issues and Civil Unrest: 11 hours ago
top topics
-
VP's Secret Service agent brawls with other agents at Andrews
Mainstream News: 7 hours ago, 9 flags -
Cats Used as Live Bait to Train Ferocious Pitbulls in Illegal NYC Dogfighting
Social Issues and Civil Unrest: 11 hours ago, 8 flags -
Electrical tricks for saving money
Education and Media: 6 hours ago, 4 flags -
HORRIBLE !! Russian Soldier Drinking Own Urine To Survive In Battle
World War Three: 15 hours ago, 3 flags -
Nearly 70% Of Americans Want Talks To End War In Ukraine
Political Issues: 8 hours ago, 3 flags -
Sunak spinning the sickness figures
Other Current Events: 8 hours ago, 3 flags -
Late Night with the Devil - a really good unusual modern horror film.
Movies: 10 hours ago, 2 flags -
The Good News According to Jesus - Episode 1
Religion, Faith, And Theology: 13 hours ago, 1 flags -
God's Righteousness is Greater than Our Wrath
Religion, Faith, And Theology: 2 hours ago, 0 flags
active topics
-
New whistleblower Jason Sands speaks on Twitter Spaces last night.
Aliens and UFOs • 55 • : baablacksheep1 -
VP's Secret Service agent brawls with other agents at Andrews
Mainstream News • 40 • : ThatSmellsStrange -
Cats Used as Live Bait to Train Ferocious Pitbulls in Illegal NYC Dogfighting
Social Issues and Civil Unrest • 20 • : Asher47 -
Nearly 70% Of Americans Want Talks To End War In Ukraine
Political Issues • 12 • : Asher47 -
Electrical tricks for saving money
Education and Media • 4 • : Lumenari -
DONALD J. TRUMP - 2024 Candidate for President - His Communications to Americans and the World.
2024 Elections • 514 • : WeMustCare -
The Acronym Game .. Pt.3
General Chit Chat • 7744 • : bally001 -
Truth Social goes public, be careful not to lose your money
Mainstream News • 128 • : Astyanax -
Sunak spinning the sickness figures
Other Current Events • 5 • : glen200376 -
SETI chief says US has no evidence for alien technology. 'And we never have'
Aliens and UFOs • 44 • : MikeDeGrasseTyson
15