It looks like you're using an Ad Blocker.
Please white-list or disable AboveTopSecret.com in your ad-blocking tool.
Thank you.
Some features of ATS will be disabled while you continue to use an ad-blocker.

When a scientist say,"WTF=Where're the Flares?",do you think the Big One is coming?..Next Days.
page: 15share:
source(www.lmsal.com...
gev_20120307_0002 2012/03/07 00:02:00 00:40:00 00:24:00 X5.4 N18E31 ( 1429 ) 40
gev_20120307_0105 2012/03/07 01:05:00 01:23:00 01:14:00 X1.3 N15E26 ( 1429 )
source(solarham.com...
Major X5.4 Solar Flare + X1.3 Flare The second strongest solar flare of Cycle 24 in terms of X-Ray Flux, just peaked around Active Sunspot 1429. This major event measured X5.4 at 00:24 UTC and triggered a strong R3 Level Radio Blackout. This was followed shortly thereafter by an X1.3 event at 01:14 UTC. A coronal mass ejection will likely result and due to the sunspots more geoeffective position, there will be a chance for some sort of impact. Stay Tuned to SolarHam.com for images, video and more details should a CME be produced. Remember, You can also follow the latest updates on SolarHam Facebook and by clicking "LIKE".
isnt it every 11 years? and if the sun aready shot off flares of some sort, dont we have another 11 years to go......? Or does it not count unless
its some kind of catastrophe since its 2000 ****in 12
We can have another 11 years if we understand,but very hard to say as long as the acceptance of some things is impossible,though I try.
Originally posted by dayve
isnt it every 11 years? and if the sun aready shot off flares of some sort, dont we have another 11 years to go......? Or does it not count unless its some kind of catastrophe since its 2000 ****in 12
That tittle of the Law is the key to everything.
Strange words.
"X5.4 Eruption
Ar 1429
CME/EUVME
Double Wave
Heading toward a
Planet near you"
source(www.lmsal.com...
"X5.4 Eruption
Ar 1429
CME/EUVME
Double Wave
Heading toward a
Planet near you"
source(www.lmsal.com...
As the words they have spoken before were real,I hope it's all about humor as it is not.
Originally posted by Suspiria
I suspect scientists are allowed a sense of humour too.
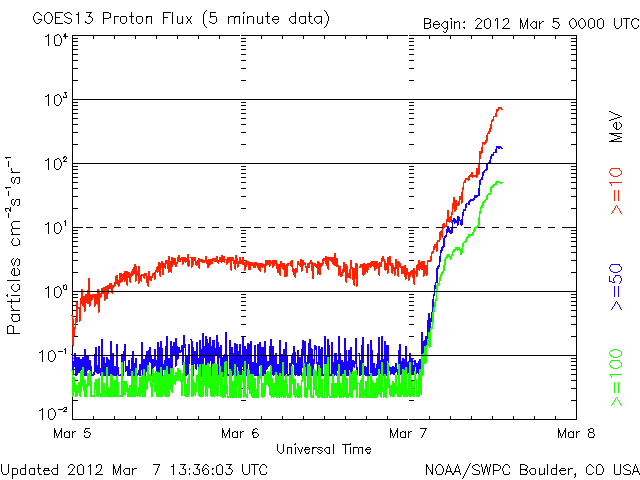
source(solarham.com...
The high energy proton levels continue to rise following the strong solar flare from very early this morning.
A moderate S2 Level Radiation Storm is in progress andcontinues to rise. Strong S3 Level Radiation Storm levels are imminent.
The increase in proton levels are a direct result of the major solar flare activity from early Wednesday morning around Sunspot 1429.
Originally posted by Jerisa
reply to post by diamondsmith
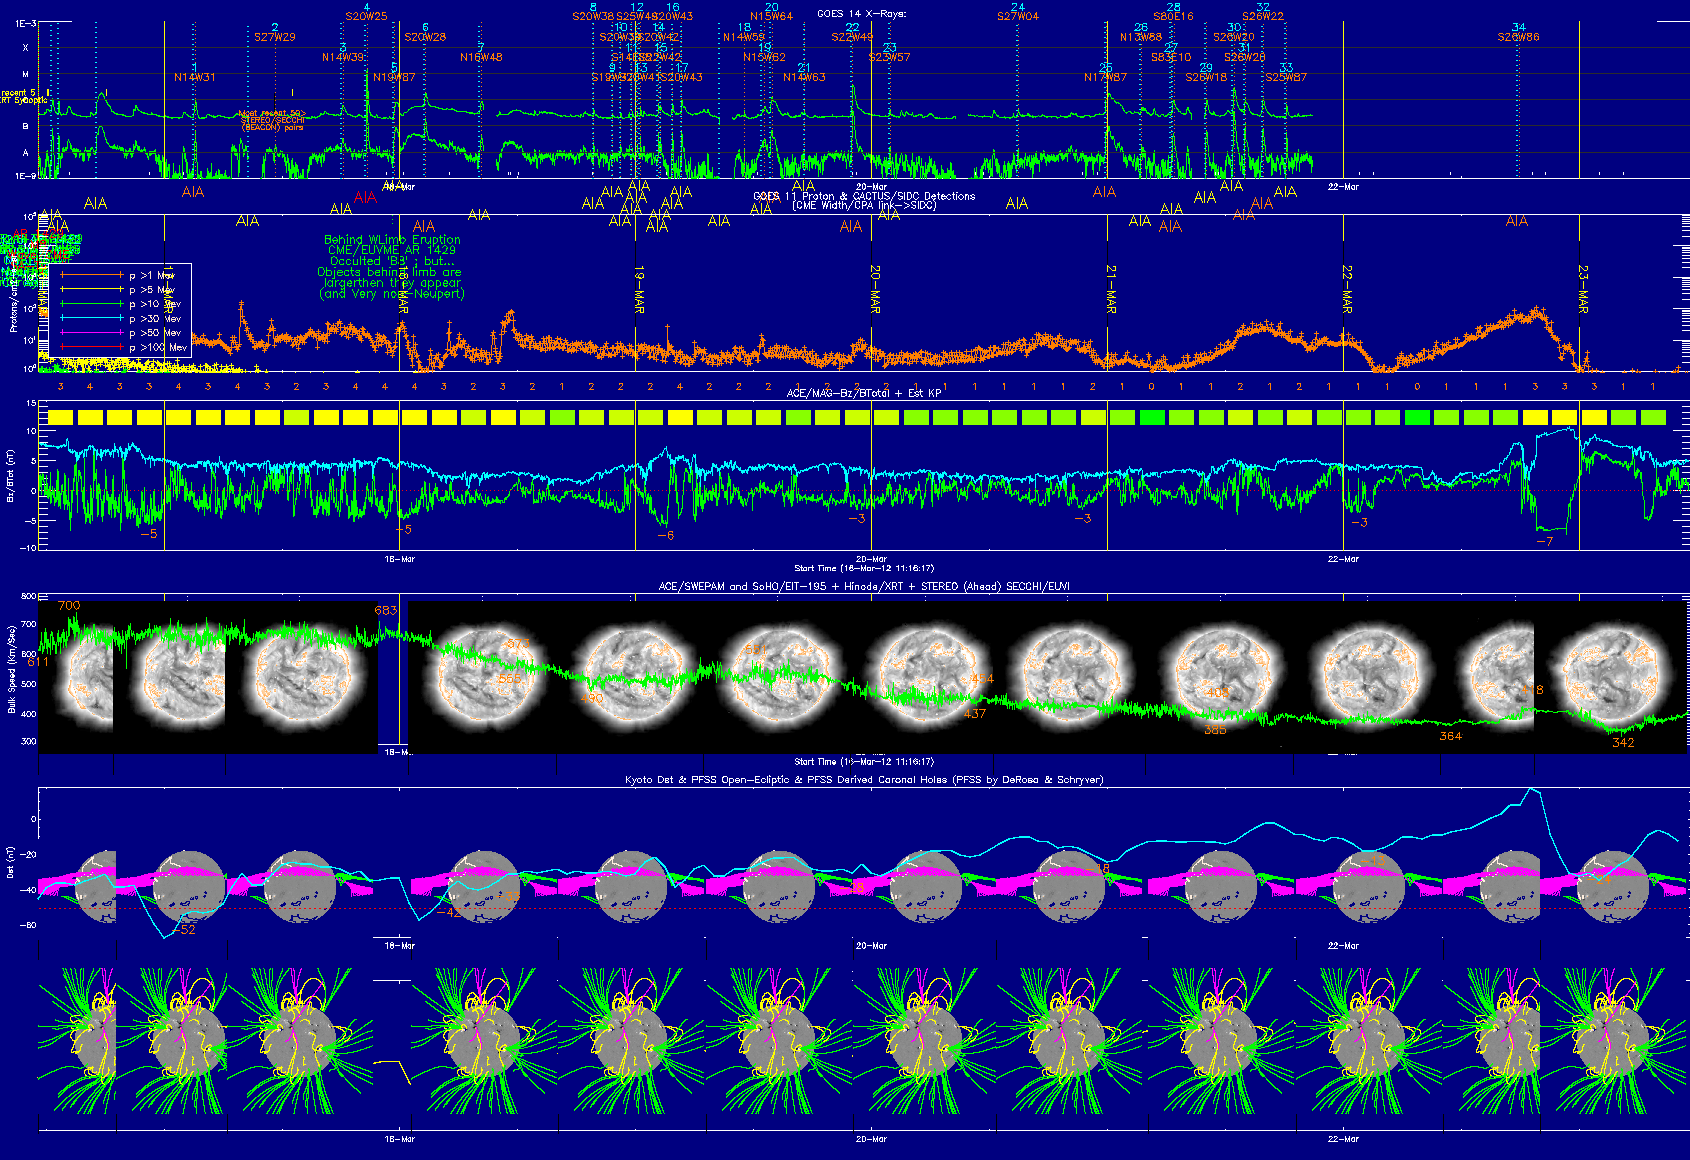
Thats pretty and all but what do those diagrams mean?
Explained here,
www.abovetopsecret.com...
new topics
-
In an Historic First, In N Out Burger Permanently Closes a Location
Mainstream News: 44 minutes ago -
MH370 Again....
Disaster Conspiracies: 1 hours ago -
Are you ready for the return of Jesus Christ? Have you been cleansed by His blood?
Religion, Faith, And Theology: 3 hours ago -
Chronological time line of open source information
History: 4 hours ago -
A man of the people
Diseases and Pandemics: 6 hours ago -
Ramblings on DNA, blood, and Spirit.
Philosophy and Metaphysics: 6 hours ago -
4 plans of US elites to defeat Russia
New World Order: 7 hours ago -
Thousands Of Young Ukrainian Men Trying To Flee The Country To Avoid Conscription And The War
Other Current Events: 11 hours ago
top topics
-
Israeli Missile Strikes in Iran, Explosions in Syria + Iraq
World War Three: 14 hours ago, 17 flags -
In an Historic First, In N Out Burger Permanently Closes a Location
Mainstream News: 44 minutes ago, 8 flags -
Thousands Of Young Ukrainian Men Trying To Flee The Country To Avoid Conscription And The War
Other Current Events: 11 hours ago, 7 flags -
Iran launches Retalliation Strike 4.18.24
World War Three: 14 hours ago, 6 flags -
12 jurors selected in Trump criminal trial
US Political Madness: 14 hours ago, 4 flags -
4 plans of US elites to defeat Russia
New World Order: 7 hours ago, 4 flags -
A man of the people
Diseases and Pandemics: 6 hours ago, 3 flags -
Chronological time line of open source information
History: 4 hours ago, 2 flags -
Are you ready for the return of Jesus Christ? Have you been cleansed by His blood?
Religion, Faith, And Theology: 3 hours ago, 1 flags -
MH370 Again....
Disaster Conspiracies: 1 hours ago, 1 flags
active topics
-
MH370 Again....
Disaster Conspiracies • 3 • : Cvastar -
In an Historic First, In N Out Burger Permanently Closes a Location
Mainstream News • 1 • : DAVID64 -
12 jurors selected in Trump criminal trial
US Political Madness • 43 • : RazorV66 -
Are you ready for the return of Jesus Christ? Have you been cleansed by His blood?
Religion, Faith, And Theology • 12 • : visitedbythem -
Post A Funny (T&C Friendly) Pic Part IV: The LOL awakens!
General Chit Chat • 7125 • : imitator -
I Guess Cloud Seeding Works
Fragile Earth • 28 • : Degradation33 -
AARO/Dr Kirkpatrick-Caught Lying in UAP report.
Aliens and UFOs • 26 • : baablacksheep1 -
Thousands Of Young Ukrainian Men Trying To Flee The Country To Avoid Conscription And The War
Other Current Events • 21 • : Consvoli -
Not Aliens but a Nazi Occult Inspired and then Science Rendered Design.
Aliens and UFOs • 15 • : anthelion -
-@TH3WH17ERABB17- -Q- ---TIME TO SHOW THE WORLD--- -Part- --44--
Dissecting Disinformation • 540 • : IndieA