It looks like you're using an Ad Blocker.
Please white-list or disable AboveTopSecret.com in your ad-blocking tool.
Thank you.
Some features of ATS will be disabled while you continue to use an ad-blocker.

I have found something important. It's the Sun.
page: 1share:
Before I get into this thread I would like to note that I have, to quite some extent, tried to gather additional data to support my observations, in
particular rain day data. I have had no success. In part that is why I'm writing this. My hope is that in sharing these observations other members
and lurkers can follow up and contribute. Anyway, here we go.
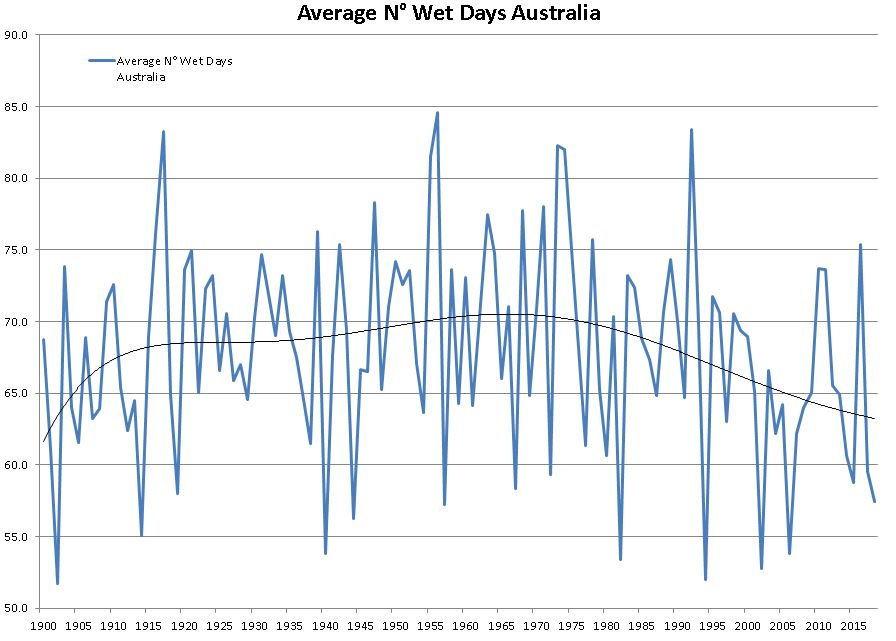
About a couple of weeks ago I came across some weather data that had an immediate visual impact on me. The data in question is the Average Number Of Rain (Wet) Days in Australia for the last 120 years or so;
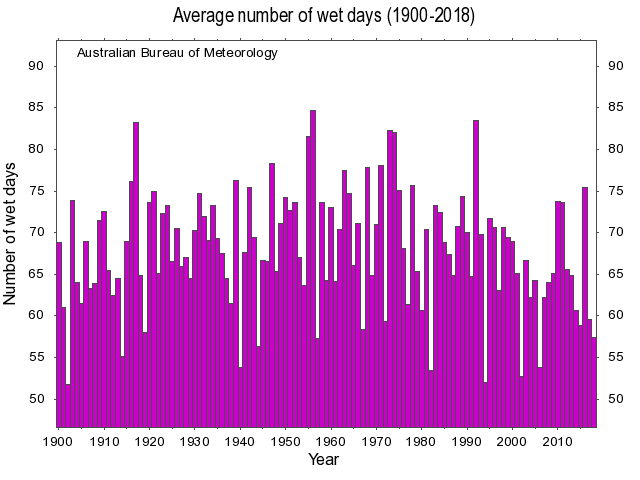
The average rain day is defined as any day with precipitation ≥1mm. The observations are collected at a CONTINENTAL SCALE.
So what's the big deal right? Well, I immediately realised that the trendline for the rain data is the same as the sunspot trendline for the same period.
Can you see it yet? Don't worry I got the data and done it myself.
But before I continue I'd like to highlight a couple of points;
Firstly, for those not aware Australia is in the midst of a massive drought. Massive is probably an understatement because there is currently, as forecast, no end in sight.
Secondly I am aware that there is plenty enough speculation about the sunspot cycle shown above and droughts. But it's just speculation, there is no connecting data, until now.
So I down loaded the rain data; Linkificationalisationing
Then the sun obs data; Sunny McSunface data
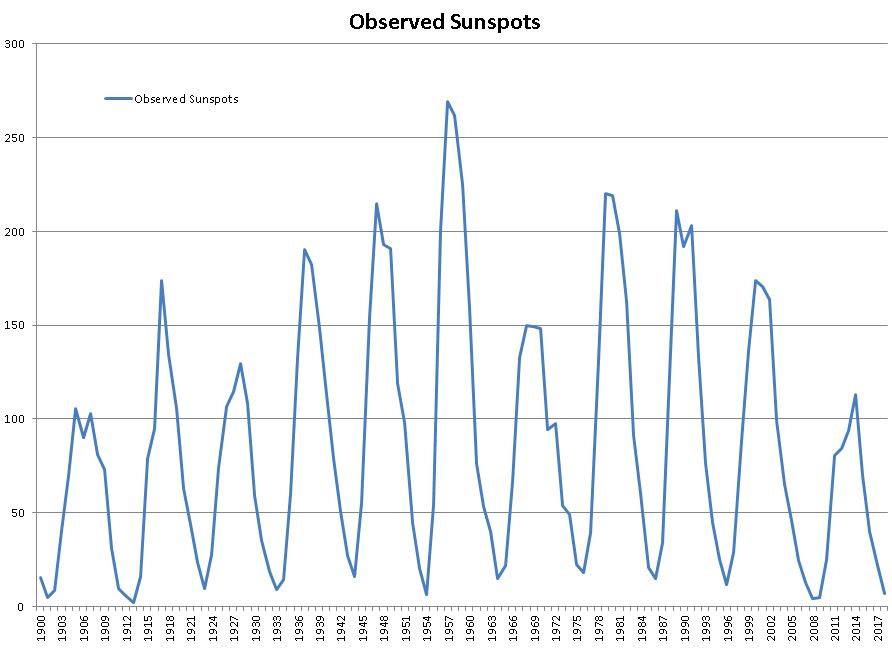
Still not seeing it?
How about a trendline I hear you scream. Here is a 6 order polynomial trendline through both sets of data.
Rain data.
Sun obs.
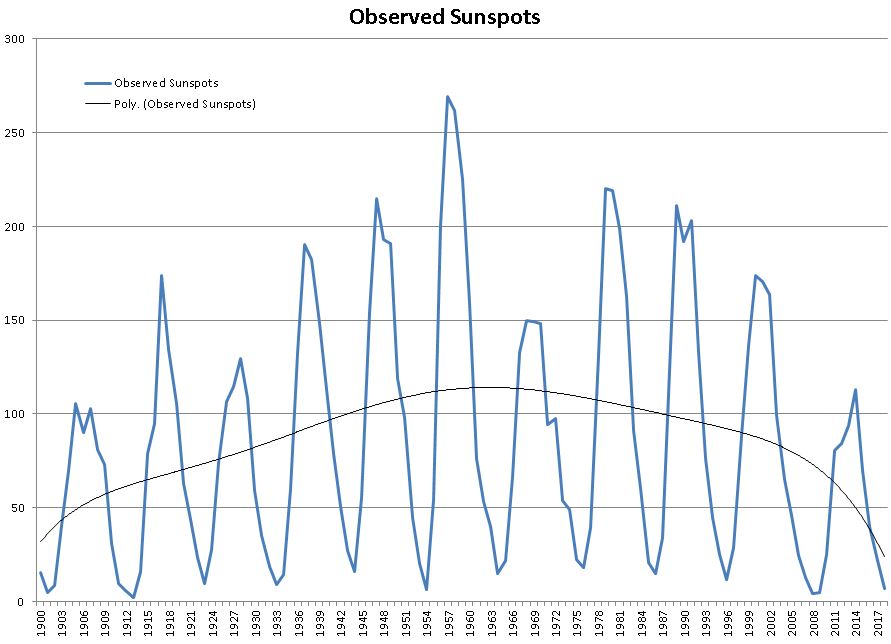
Are there differences, of course there are differences. There are difference because the sun is not the only causal effect on our climate, but it is clearly the dominant effect. It should also be noted that from about the years 2000 forward in the rain data the trendline does not track as per the sun obs data due to uncertainty in the rain data. For the preceding 100 years or there about the trendline maintains a similar track which displays a common peak around 1963.
Importantly I think, this data only reveals itself on a continental scale. There is too much weather "noise" at a local station level to be able to observe the same connection.
Anyway, there you have it for the time being. I'm bloody starving and need to make my dinner.
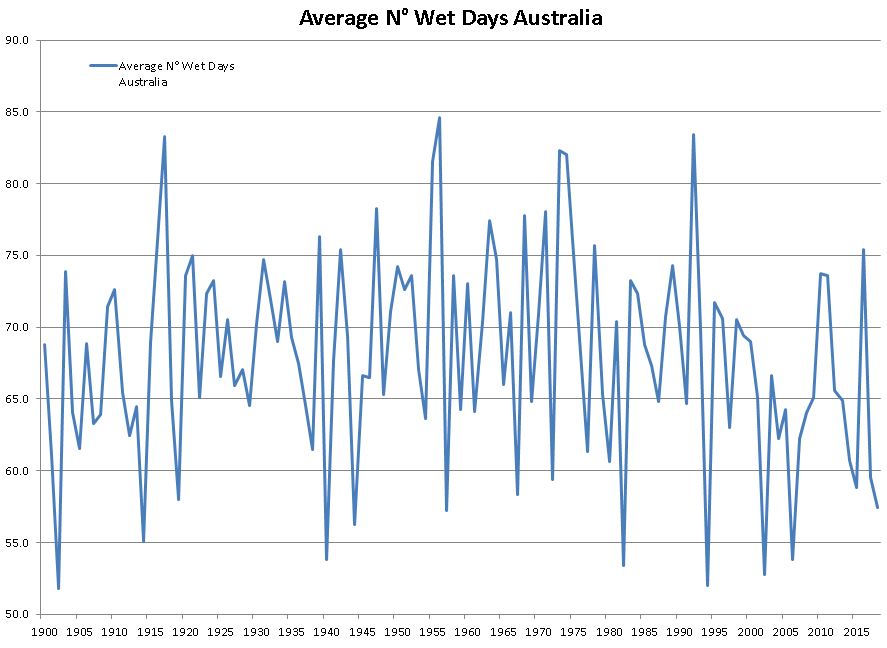
About a couple of weeks ago I came across some weather data that had an immediate visual impact on me. The data in question is the Average Number Of Rain (Wet) Days in Australia for the last 120 years or so;
The average rain day is defined as any day with precipitation ≥1mm. The observations are collected at a CONTINENTAL SCALE.
So what's the big deal right? Well, I immediately realised that the trendline for the rain data is the same as the sunspot trendline for the same period.
Can you see it yet? Don't worry I got the data and done it myself.
But before I continue I'd like to highlight a couple of points;
Firstly, for those not aware Australia is in the midst of a massive drought. Massive is probably an understatement because there is currently, as forecast, no end in sight.
Secondly I am aware that there is plenty enough speculation about the sunspot cycle shown above and droughts. But it's just speculation, there is no connecting data, until now.
So I down loaded the rain data; Linkificationalisationing
Then the sun obs data; Sunny McSunface data
Still not seeing it?
How about a trendline I hear you scream. Here is a 6 order polynomial trendline through both sets of data.
Rain data.
Sun obs.
Are there differences, of course there are differences. There are difference because the sun is not the only causal effect on our climate, but it is clearly the dominant effect. It should also be noted that from about the years 2000 forward in the rain data the trendline does not track as per the sun obs data due to uncertainty in the rain data. For the preceding 100 years or there about the trendline maintains a similar track which displays a common peak around 1963.
Importantly I think, this data only reveals itself on a continental scale. There is too much weather "noise" at a local station level to be able to observe the same connection.
Anyway, there you have it for the time being. I'm bloody starving and need to make my dinner.
here in south Carolina, along the NE coastal region... just 1 mile west of Airport and the adjoining waterway....
we have a 1000 acre topography of land which is called Forestbrook / Forestbrook Road
If there is even a 10% chance of rain forecasted for the population centers of Conway/Myrtle Beach/Socastee (around a 700 square mile area ---> It will pour down rain at the whole 10 mile length of Forestbrook-Forestbrook Road which might be 3 miles wide at it's widest parts.
nobody knows why it rains more there than other places
but I think that the swampy nature of the area & that the place might be one of those 'wetland' areas called a Carolina Bay (folklore says the Bays are topographical ellipses formed from meteor impacts in Antiquity )
www.bing.com... url=https%3A%2F%2Fupload.wikimedia.org%2Fwikipedia%2Fcommons%2Fthumb%2F7%2F71%2FSC_707_map.svg%2F1200px-SC_707_map.svg.png&exph=706&expw=1200&q=map+so castee+sc+roads&simid=608042183034801915&selectedindex=12&ajaxhist=0&vt=1
I also remember reading that deserts increased in size during ice ages, contrary to popular belief, and actually shrink during
interglacial eras ("warmer" periods).
This is due to humidity and evaporation, which actually increases during hotter periods.
This is due to humidity and evaporation, which actually increases during hotter periods.
a reply to: myselfaswell
Not sure what you want help with. What is your theory regarding sunspots & rain days exactly? That they correlate or something more?
If they do, in fact, correlate, what does that tell us? That as sunspots (and their resulting flares and CMEs) decrease, so does rain on the Australia continent? Are you looking for a correlation to predict drought?
Sunspot activity is roughly on an 11-year cycle and Australian drought is roughly on a 18 year cycle. Does this mean something?
edit on 15/12/2019 by Iamonlyhuman because: (no reason given)
originally posted by: Iamonlyhuman
a reply to: myselfaswell
Not sure what you want help with. What is your theory regarding sunspots & rain days exactly? That they correlate or something more?
If they do, in fact, correlate, what does that tell us? That as sunspots (and their resulting flares and CMEs) decrease, so does rain on the Australia continent? Are you looking for a correlation to predict drought?
Sunspot activity is roughly on an 11-year cycle and Australian drought is roughly on a 18 year cycle. Does this mean something?
I think the drought, as well as the solar minima, are going to continue. We are in a period of solar minima now and are going to be bombarded with more and more cosmic rays because our sun will not protect us.
We are also likely in the process of a geomagnetic polar switch.
Here are a couple articles that explain:
news.berkeley.edu...
www.scientificamerican.com...
originally posted by: Iamonlyhuman
a reply to: myselfaswell
what does that tell us?
That as sunspots (and their resulting flares and CMEs) decrease, so does rain on the Australia continent? Are you looking for a correlation to predict drought?
on the visual landmass.... 99.999 % of the rain measurements were on the Coastal Areas with some significant measurements in wet areas along rivers or depressions in the land.... the Sun might be significantly altering the wind patterns which bring noisture laden clouds to the band of Coastline where the ocean waters collide with the desert winds along the whole coastal perimeter of Australia
winds, cells, trade winds are all factors that might be more prominent than Sun Cycles
btw--------------- do you guys have the dark ops from government doing Chem Trail injections of metals/nanoparticles to 'cool' your ionosphere like the USA north America is doing ?
a reply to: myselfaswell
Hey there! Nice post OP.
SonoftheSun and myself researched the Sun years ago on ATS, linked below.
We are going into a mini ice age.... Many are speculating what is going to happen as the energies which are bombarding our planet and the inhabitants is creating a collective awareness. Time will tell.
www.abovetopsecret.com...
edit on 15-12-2019 by MamaJ because: (no reason given)
originally posted by: St Udio
btw--------------- do you guys have the dark ops from government doing Chem Trail injections of metals/nanoparticles to 'cool' your ionosphere like the USA north America is doing ?
I didn't think someone as smart as you bought into "chemtrails". that's a shame.
a reply to: St Udio
I live in Tennessee grew up in the country we watched storms come in talked about the clouds a lot. My grandmother is 92 and she sees the changes as well In the atmosphere and weather as well as lines in the sky which puff into cloud cover.
I woke up the other morning excited to see the full moon when I saw a hook type of line going across the sky. The planes were active all day and come night fall everyone was posting their beautiful sunset pictures.
Cloud seeding a myth? Possibly but it sure raises questions when you witness these changes over the years.
a reply to: Iamonlyhuman
I want help sourcing weather data that computed to the same continental scale. For example the entirety of the US or maybe the US & Canada, that sort of data.
In answering your other questions all I will say is that I AM NOT A CLIMATE SCIENTIST. I have found a clear connection between the sun and a component or our climate, that's it. It's now up to people who have the weather data and other things to start looking.
Not sure what you want help with.
I want help sourcing weather data that computed to the same continental scale. For example the entirety of the US or maybe the US & Canada, that sort of data.
In answering your other questions all I will say is that I AM NOT A CLIMATE SCIENTIST. I have found a clear connection between the sun and a component or our climate, that's it. It's now up to people who have the weather data and other things to start looking.
a reply to: Vasa Croe
It's interesting that you bring that up because I think our magnetosphere is also in the top couple of climate drivers.
Our magnetosphere is a a level not seem for about 4-5000 years.
Cosmic radiation is increasing rapidly and potentially creating nucleation for high altitude clouds etc.
I have to say that it's possible that the poles may not flip, we may just be in a phase of a rapidly decreasing magnetosphere, either way what's really important, with reference to the OP, is that we are in uncharted waters with respect to our climate.
We are also likely in the process of a geomagnetic polar switch.
It's interesting that you bring that up because I think our magnetosphere is also in the top couple of climate drivers.
Our magnetosphere is a a level not seem for about 4-5000 years.
Cosmic radiation is increasing rapidly and potentially creating nucleation for high altitude clouds etc.
I have to say that it's possible that the poles may not flip, we may just be in a phase of a rapidly decreasing magnetosphere, either way what's really important, with reference to the OP, is that we are in uncharted waters with respect to our climate.
a reply to: myselfaswell
I believe we are in uncharted human territory but the earth has seen this before. The solar minima combined with a geomagnetic pole swap would open the earth up to a bombardment of cosmic rays.
This is what I believe is currently driving "climate change" right now.....nothing human initiated nor anything we can do about it.
It is likely the beginning of a mini ice age, possibly a ice age in general. The articles I linked show, from very well researched and reputable scientists, that we are overdue for it and it can happen VERY quickly once in motion.
Look into solar minima when in unison with geomagnetic pole reversals.
Here is some more about the polar caps :
hmi.stanford.edu...
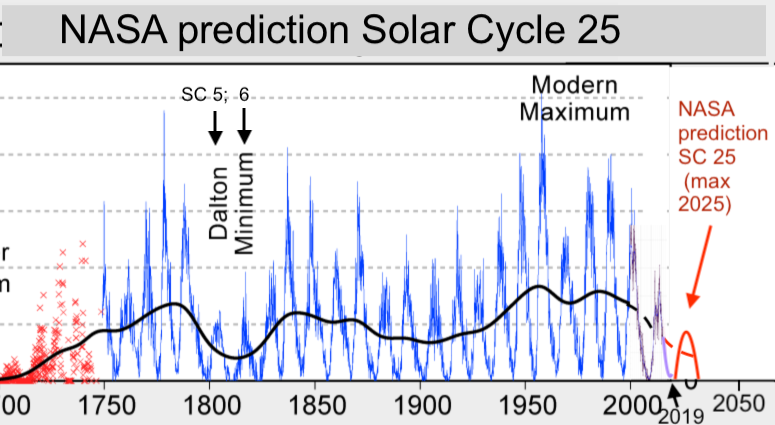
We are currently in the weakest solar cycle in the last 100 years....
Here is a research paper on the cycles and what they mean as well. It starts with cycle 21 I believe.
PDF
I believe we are in uncharted human territory but the earth has seen this before. The solar minima combined with a geomagnetic pole swap would open the earth up to a bombardment of cosmic rays.
This is what I believe is currently driving "climate change" right now.....nothing human initiated nor anything we can do about it.
It is likely the beginning of a mini ice age, possibly a ice age in general. The articles I linked show, from very well researched and reputable scientists, that we are overdue for it and it can happen VERY quickly once in motion.
Look into solar minima when in unison with geomagnetic pole reversals.
Here is some more about the polar caps :
hmi.stanford.edu...
We are currently in the weakest solar cycle in the last 100 years....
Here is a research paper on the cycles and what they mean as well. It starts with cycle 21 I believe.
a reply to: myselfaswell
Worth looking into - Inigo Owen Jones
The man who proposed the 35 year solar sunspot + solar system cycle and its influence on weather trends about a century ago. Farmers relied on his long term forecasts which turned out to be uncannily accurate at identifying drought and flood prone years far into the future. They called him 'The Weather Prophet' although the mainstream meteorological community gave him a tough time because, let's face it, his methods lean towards the mystical arts of sorcery.
originally posted by: Pilgrum
a reply to: myselfaswell
Worth looking into - Inigo Owen Jones
The man who proposed the 35 year solar sunspot + solar system cycle and its influence on weather trends about a century ago. Farmers relied on his long term forecasts which turned out to be uncannily accurate at identifying drought and flood prone years far into the future. They called him 'The Weather Prophet' although the mainstream meteorological community gave him a tough time because, let's face it, his methods lean towards the mystical arts of sorcery.
Interesting and appears to have been way ahead of his time. Thanks for the link. Will have to research some on him.
Oddly, this article just popped up in another thread....
Earth Magnetic Field
Earth Magnetic Field
The magnetic North Pole is the wandering point on the surface of Earth's Northern Hemisphere at which the planet's magnetic field - created by molten iron within the planet’s core - points vertically downwards.
The latest World Magnetic Model, which tracks the movement of the Earth’s magnetic field, shows that the magnetic north is moving at a rate of 30 miles per year.
This is the fastest recorded shift of the Earth's north since the mid-16th century and could cause havoc for aviation and navigation systems, including smartphone apps that use GPS.
a reply to: myselfaswell
Excellent thread.
I gather that your point is that
there is less rain in Australia during
Solar minimums.
So if your data is correct,and my processing of your
data is correct, it is going to get worse
(drier) before it gets better.
It will get better in the next upward cycle.
So plan accordingly.
S&F
a reply to: myselfaswell
Interesting, I wonder if the sun also has a role to play in the SSW phenomena currently affecting us.
Nice thread and just in time for this week of 40+ degree nasty.
Interesting, I wonder if the sun also has a role to play in the SSW phenomena currently affecting us.
Nice thread and just in time for this week of 40+ degree nasty.
new topics
-
Weinstein's conviction overturned
Mainstream News: 1 minutes ago -
Supreme Court Oral Arguments 4.25.2024 - Are PRESIDENTS IMMUNE From Later Being Prosecuted.
Above Politics: 1 hours ago -
Krystalnacht on today's most elite Universities?
Social Issues and Civil Unrest: 1 hours ago -
Chris Christie Wishes Death Upon Trump and Ramaswamy
Politicians & People: 2 hours ago -
University of Texas Instantly Shuts Down Anti Israel Protests
Education and Media: 4 hours ago -
Any one suspicious of fever promotions events, major investor Goldman Sachs card only.
The Gray Area: 6 hours ago -
God's Righteousness is Greater than Our Wrath
Religion, Faith, And Theology: 10 hours ago
top topics
-
VP's Secret Service agent brawls with other agents at Andrews
Mainstream News: 15 hours ago, 11 flags -
Nearly 70% Of Americans Want Talks To End War In Ukraine
Political Issues: 16 hours ago, 6 flags -
Sunak spinning the sickness figures
Other Current Events: 16 hours ago, 5 flags -
Electrical tricks for saving money
Education and Media: 14 hours ago, 4 flags -
Supreme Court Oral Arguments 4.25.2024 - Are PRESIDENTS IMMUNE From Later Being Prosecuted.
Above Politics: 1 hours ago, 4 flags -
Krystalnacht on today's most elite Universities?
Social Issues and Civil Unrest: 1 hours ago, 4 flags -
University of Texas Instantly Shuts Down Anti Israel Protests
Education and Media: 4 hours ago, 2 flags -
Any one suspicious of fever promotions events, major investor Goldman Sachs card only.
The Gray Area: 6 hours ago, 2 flags -
Chris Christie Wishes Death Upon Trump and Ramaswamy
Politicians & People: 2 hours ago, 1 flags -
God's Righteousness is Greater than Our Wrath
Religion, Faith, And Theology: 10 hours ago, 1 flags
active topics
-
University of Texas Instantly Shuts Down Anti Israel Protests
Education and Media • 93 • : marg6043 -
Weinstein's conviction overturned
Mainstream News • 1 • : FlyersFan -
Supreme Court Oral Arguments 4.25.2024 - Are PRESIDENTS IMMUNE From Later Being Prosecuted.
Above Politics • 6 • : TzarChasm -
President BIDEN Vows to Make Americans Pay More Federal Taxes in 2025 - Political Suicide.
2024 Elections • 143 • : SchrodingersRat -
SETI chief says US has no evidence for alien technology. 'And we never have'
Aliens and UFOs • 65 • : andy06shake -
Sunak spinning the sickness figures
Other Current Events • 18 • : andy06shake -
British TV Presenter Refuses To Use Guest's Preferred Pronouns
Education and Media • 155 • : Annee -
Nearly 70% Of Americans Want Talks To End War In Ukraine
Political Issues • 76 • : FlyersFan -
The Reality of the Laser
Military Projects • 49 • : 5thHead -
Chris Christie Wishes Death Upon Trump and Ramaswamy
Politicians & People • 6 • : mysterioustranger