It looks like you're using an Ad Blocker.
Please white-list or disable AboveTopSecret.com in your ad-blocking tool.
Thank you.
Some features of ATS will be disabled while you continue to use an ad-blocker.

An analysis of the Betty Hill "star map"
page: 1share:
I thought that it might be more productive to show all of you "how" I got to where I am.
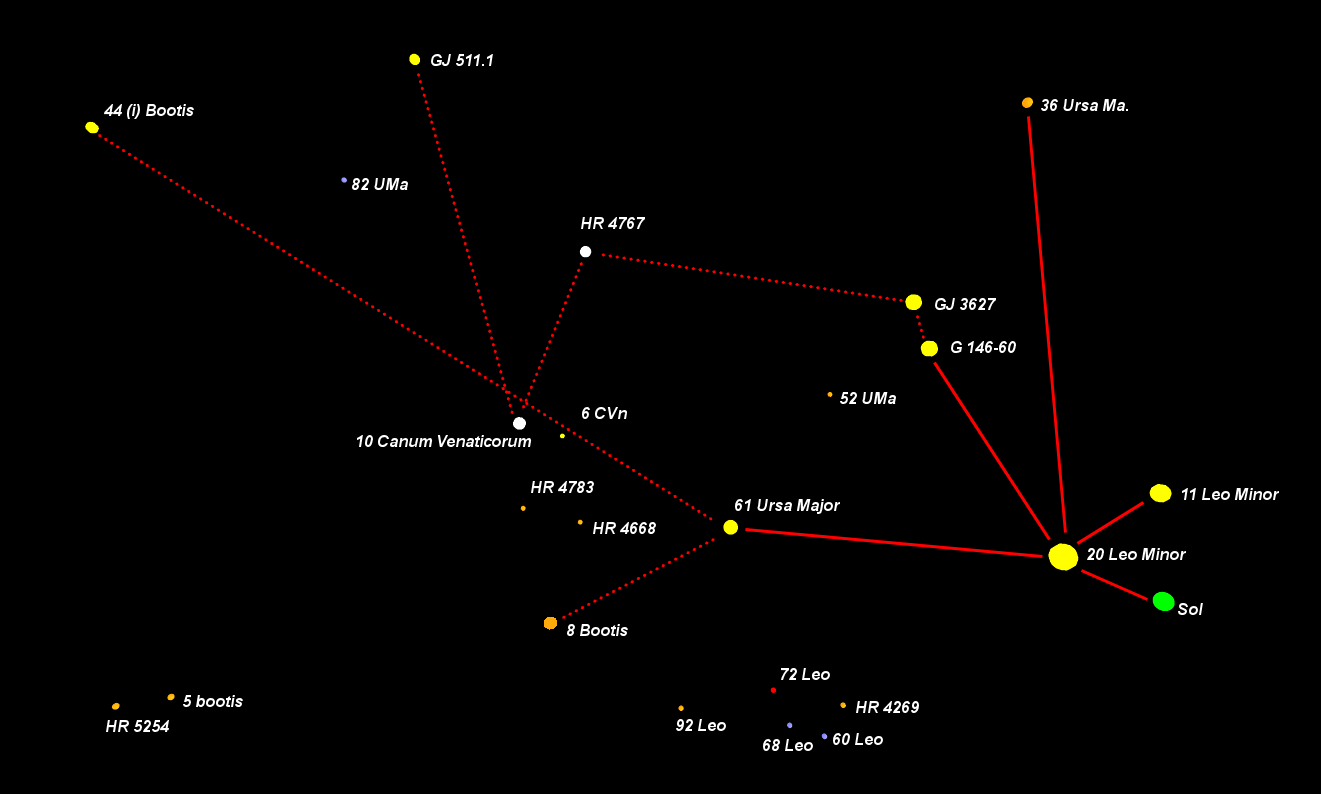
Betty was given the post-hypnotic suggestion that she could sketch a copy of the "star map". Although she said the map had many stars, she drew only those that stood out in her memory. Her map consisted of twelve prominent stars connected by lines and 13 lesser stars that form several distinctive groups. She said she was told the stars connected by solid lines formed "trade routes", and dashed lines were to less-traveled stars.
There are a total of 25 stars in the template with 13 identified by Marjorie Fish around 1968. Much of her efforts were undone by others who knew little about Astronomy, in any case, Ms. Fish’s work has served well to start this analysis.
Computer modeling and Datasets
To create our view of the stars, and make a search for a match possible we created several database tables to use with Microsoft’s SQL server.
DataSets
Hipparcos
The word "Hipparcos" is an acronym for High precision parallax collecting satellite. It was launched in 1989 by the European Space Agency and collected data on over 118,000 stars. There is also an auxiliary table called “Extended Hipparcos” that contains additional astrometric data. These tables are maintained by the University of Strasbourg, Fr.
These two tables were imported into an instance of Microsoft SQL Server Express, and used as the basis for all stellar data.
exoplanet.eu_catalog
A catalog of all known exoplanets. This table was also imported into SQL Server. However the table required some modification to allow it to accurately interface with the Hipparcos tables, and other software.
All of the data elements (columns) imported as text, and there was no record “identity”; so distance and age in a numerical format was added. Software methods were created to populate these new fields with their text counterparts’ conversions to a “double” data type. Additionally the Hipparcos index number was added by creating software methods the access “Simbad” (a web service of the University of Strasbourg, Fr.) to obtain a cross reference where possible.
These three data elements constitute the majority of data used in this query. Programming languages used in this data phase were C#, and TSQL.
Computer Modeling
Two categories of model were generated using a combination of C#, TSQL, and Python.
3D Models
Two major 3D models of local star were created. The first was stars within 33 parsec, the second expanded to 46 parsec.
A C# application was created to apply SQL search criteria (everything < 33 parsec) and create a sub table from which astrometrics of individual stars could be retrieved. Using specialized templates written in Python, the position (X, Y, Z), along with star class, and name were compiled into a Python script for use with “Poser” (a 3D modeling and animating application) to place “Bucky balls” of appropriate color, and name into the 3D space provided by Poser.
As I was using the Fish interpretation as a base of sorts I included additional instructions to highlight the stars in her “list”. This allowed me to position a “camera” somewhere that was logical to view the “Fish Stars”. It was incredibly easy to find such a location, knowing approximately where to look from. As I was refining my view I noticed that I had gone outside my 33 parsec radius. I increased the radius to 46 parsec so that I might know where I was viewing from. After adding the additional stars I found that I was near a star called “HIP-26737”, yet another class “G” star in the mix (actually G2V).
2D Models
Methods were also developed to provide 2D Models of individual Star Systems. These method produce a “PNG” file that expresses the star and the orbits of any planets along with a representation of the Stars Habitable Zone. These methods were written in C# and SQL for the Windows Desktop.
Discoveries
There were some discoveries found in these models:
1. Marjorie Fish was spot on with all stars but Kappa Fonacis. I haven’t built a model based on the Gliese dataset, so it is entirely possible that better “location” of the star moved it, what is actually, a considerable distance. And, based solely on the stars identified by Ms. Fish; her interpretation isn’t really a very good match, but, it did serve as a good starting point.
2. The identity of 13 stars that Ms. Fish didn’t identify were identified.
3. Among the newly identified stars were 5 that were not known in either 1961, or 1969; so neither Betty, nor Ms. Fish, could have “guessed” their existence and location.
4. The doubling and connecting of the two Zetas Reticuli is suggestive of a Graphical User Interface. It appears that if one were to “mouse over” or touch Zeta Reticuli; it splits into the two stars of the overall system. Just as doing the same to other stars has the same result. And of course doing that to a multi-star system might show individual solar systems.
Part 2...
Software
Developed Software
A Windows Desktop application was created using Microsoft Visual Studio, SQL Server employing C#, TSQL, and Python. This application was implemented to solve several issues;
1. Providing a method to import star locations in an arbitrary radius, and of arbitrary class, or other metric. This was solved by creating a method to query SQL Server Hipparcos table and extract RA, Decl, and Distance, which was used to compute X, Y, and Z coordinates which were placed in a Python templet. Star class encoded as color, and the star’s Hipparcos “ID”. This was repeated for each cataloged returned by the query.
The resulting Python script was then used in SmithMicro’s “Poser” (3D modeling and animating software) to construct views on “Local Space” in three dimensions.
2. When importing the European Space Agency’s Exoplanet database all data was imported as text, the creation of methods to read the text value of selected data and write the conversion to a new data column, providing a more convenient consumption of the data. Data elements that were converted are distance and age, these elements were converted into floating point numbers. The Hipparcos Identity was also added by interfacing with the “Simbad” resource at University of Strasbourg, Fr.
3. Additional tools to draw planetary orbits and habitable zones associated with arbitrary stars have also been developed.
4. A desktop tool was developed to do “ExhaustiveTempletMatching”, a method used in computer vision for optical object recognition. The method used here is from AForgeNet.com. This program allows me to input any “template” (such as Betty Hill’s map) and use it to search for a match in another arbitrary image.
Commercial Software
SmithMicro: Poser11 Pro. Allowed the creation of 3D views on any selection of stars, and viewing from anywhere, with virtually any camera.
Paint Shop Pro: Old school image processing application, like “PhotoShop”. Allowed editing of images to add, or remove lines, noise, and to accentuate selected stars for easier identification.
Microsoft SQLServer: Relational database engine used to store Astrometric data.
Computer Template Matching
To verify the quality of any apparent match between Betty’s “map” and any “snapshot” of known local stars, I searched for and found a Computer Vision “library” that contained methods to perform template matching.
Applying “ExhaustiveTemplateMatching”, a template matching method from a Computer Vision Library called “AForge” (available at GetHub, and aforgenet.com...) with a “similarityThreshold” of 99% results in a single match: 99.1%
To obtain this Betty’s original drawing was cleaned up; background made solid white, and all lines connecting the stars were removed, as well as the second “zeta Reticuli”. This template was applied to the computer generated view of the stars in question, also filtered to show only stars of interest.

Betty's map cleaned up

My map...
Software
Developed Software
A Windows Desktop application was created using Microsoft Visual Studio, SQL Server employing C#, TSQL, and Python. This application was implemented to solve several issues;
1. Providing a method to import star locations in an arbitrary radius, and of arbitrary class, or other metric. This was solved by creating a method to query SQL Server Hipparcos table and extract RA, Decl, and Distance, which was used to compute X, Y, and Z coordinates which were placed in a Python templet. Star class encoded as color, and the star’s Hipparcos “ID”. This was repeated for each cataloged returned by the query.
The resulting Python script was then used in SmithMicro’s “Poser” (3D modeling and animating software) to construct views on “Local Space” in three dimensions.
2. When importing the European Space Agency’s Exoplanet database all data was imported as text, the creation of methods to read the text value of selected data and write the conversion to a new data column, providing a more convenient consumption of the data. Data elements that were converted are distance and age, these elements were converted into floating point numbers. The Hipparcos Identity was also added by interfacing with the “Simbad” resource at University of Strasbourg, Fr.
3. Additional tools to draw planetary orbits and habitable zones associated with arbitrary stars have also been developed.
4. A desktop tool was developed to do “ExhaustiveTempletMatching”, a method used in computer vision for optical object recognition. The method used here is from AForgeNet.com. This program allows me to input any “template” (such as Betty Hill’s map) and use it to search for a match in another arbitrary image.
Commercial Software
SmithMicro: Poser11 Pro. Allowed the creation of 3D views on any selection of stars, and viewing from anywhere, with virtually any camera.
Paint Shop Pro: Old school image processing application, like “PhotoShop”. Allowed editing of images to add, or remove lines, noise, and to accentuate selected stars for easier identification.
Microsoft SQLServer: Relational database engine used to store Astrometric data.
Computer Template Matching
To verify the quality of any apparent match between Betty’s “map” and any “snapshot” of known local stars, I searched for and found a Computer Vision “library” that contained methods to perform template matching.
Applying “ExhaustiveTemplateMatching”, a template matching method from a Computer Vision Library called “AForge” (available at GetHub, and aforgenet.com...) with a “similarityThreshold” of 99% results in a single match: 99.1%
To obtain this Betty’s original drawing was cleaned up; background made solid white, and all lines connecting the stars were removed, as well as the second “zeta Reticuli”. This template was applied to the computer generated view of the stars in question, also filtered to show only stars of interest.
Betty's map cleaned up
My map...
edit on 26-2-2019 by james1947 because: (no reason given)
So that is how I performed this analysis, at least for the most part. I continue to investigate, and learn, and observe new things in the data all the
time...
This analysis does show that Betty's map is a very close match to stars viewed from HIP-26737, and probability kind of screams that this was something Betty actually saw, and that the source was extraterrestrial.
This analysis does show that Betty's map is a very close match to stars viewed from HIP-26737, and probability kind of screams that this was something Betty actually saw, and that the source was extraterrestrial.
Except that her map may not be all that accurate to begin with.
If that is the case then it could "match" to a different place.
edit:
But that is a great effort in research.
If that is the case then it could "match" to a different place.
edit:
But that is a great effort in research.
edit on 2/26/2019 by roadgravel because: (no reason given)
originally posted by: alldaylong
a reply to: james1947
There are billions of stars in our Milky Way.
Surely no matter what stars you draw on a map, something is going to match up somewhere.
Perhaps, however, our search is limited to local space...within 33 parsec.
I keep the distance short simply because of the vast distances involved...we are more probable to meet extraterrestrials from close by.
There is also the probability of finding a match; which is very slim...the more stars we add to the mix, the lower the probability of a match of any quality.
originally posted by: roadgravel
Except that her map may not be all that accurate to begin with.
If that is the case then it could "match" to a different place.
edit:
But that is a great effort in research.
Actually, I was working under the premise that Betty's map wasn't very accurate, but only an approximation of what she saw. Which is why I used it only as a template, and base most decisions on the quality of the match. 99.1%
Theorizing on basic star navigation, the ET's should work with 2 star maps, first the star map as they see it from their planet showing their
destination star system and second the star map as it would be seen from our sun to their star system.
originally posted by: Blue Shift
originally posted by: james1947
[...] and that the source was extraterrestrial.
That's quite an assumption.
Please explain "why" you think that's an assumption.
After all that view cannot be seen from Earth, and I could only "see it" by virtue of modern technology.
a reply to: manuelram16
Because a single three dimensional map where one's position could be indicated would be beyond their capability to deal with?
Yeah, makes much more sense to use flat maps for travel from star to star.
the ET's should work with 2 star maps
Because a single three dimensional map where one's position could be indicated would be beyond their capability to deal with?
Yeah, makes much more sense to use flat maps for travel from star to star.
edit on 2/26/2019 by Phage because: (no reason given)
originally posted by: Phage
a reply to: manuelram16
the ET's should work with 2 star maps
Because a single three dimensional map would be beyond their capability to deal with?
Are you saying that I have a technology better than ET? I only used a single 3D model of local space...well actually two, the second was a larger radius (33 and 46 parsec).
Your experiment is incomplete.
If you want this to be convincing you need a standard population and probability control.
You need to have people attempt to draw star maps, randomly.
Then try to match those "star maps" and see if you can get matches with any reasonable probability that approaches the Betty Hill percentage.
If random population sample pulls are not even close,then your argument is convincing.
Until you do that, this is just a neat idea.
a reply to: james1947
Do you think you could draw a star map free hand from a real star map picture and have it come up in any of your tests?
That's my biggest problem with this.
I could easily be wrong but I don't think it's possible to draw an accurate star map free hand, and that's not even mentioning the fact it was done from memory.
If Betty Hill's is 99% how close can you get?
originally posted by: Archivalist
Your experiment is incomplete.
If you want this to be convincing you need a standard population and probability control.
You need to have people attempt to draw star maps, randomly.
Then try to match those "star maps" and see if you can get matches with any reasonable probability that approaches the Betty Hill percentage.
If random population sample pulls are not even close,then your argument is convincing.
Until you do that, this is just a neat idea.
Here are a couple of attempts:
This is the "Hill Wilson" interpretation. it is 98.6%
This is a New York Times attempt...it only has 8 points, so is no match at all.
There is another where Betty's map is projected onto a map of England; it too is a 98.6% match.
That is as close as I currently have. Also, it appears, after a second reading, this wouldn't be a practical test. The probability of generating a match between local stars, and a random grouping of points is extremely small.
-- from my white paper draft
We want the first 25 terms of 2826 factorial (2826 is the number of stars returned for our search): result = 1.7102778772488529E+86. So there are 1.71e+86 combinations of 25 stars, there are also 46,656,000 possible angles to view from. The probability of the match is: 1 chance in 7.978176e+93 or 1.25e-94.
This is what makes Betty's map so remarkable.
edit on 26-2-2019 by james1947 because: (no reason given)
new topics
-
George Knapp AMA on DI
Area 51 and other Facilities: 2 hours ago -
Not Aliens but a Nazi Occult Inspired and then Science Rendered Design.
Aliens and UFOs: 2 hours ago -
Louisiana Lawmakers Seek to Limit Public Access to Government Records
Political Issues: 5 hours ago -
The Tories may be wiped out after the Election - Serves them Right
Regional Politics: 6 hours ago -
So I saw about 30 UFOs in formation last night.
Aliens and UFOs: 8 hours ago -
Do we live in a simulation similar to The Matrix 1999?
ATS Skunk Works: 9 hours ago -
BREAKING: O’Keefe Media Uncovers who is really running the White House
US Political Madness: 9 hours ago -
Biden--My Uncle Was Eaten By Cannibals
US Political Madness: 10 hours ago -
"We're All Hamas" Heard at Columbia University Protests
Social Issues and Civil Unrest: 10 hours ago
top topics
-
BREAKING: O’Keefe Media Uncovers who is really running the White House
US Political Madness: 9 hours ago, 23 flags -
Biden--My Uncle Was Eaten By Cannibals
US Political Madness: 10 hours ago, 18 flags -
George Knapp AMA on DI
Area 51 and other Facilities: 2 hours ago, 16 flags -
African "Newcomers" Tell NYC They Don't Like the Free Food or Shelter They've Been Given
Social Issues and Civil Unrest: 15 hours ago, 12 flags -
"We're All Hamas" Heard at Columbia University Protests
Social Issues and Civil Unrest: 10 hours ago, 7 flags -
Russia Flooding
Fragile Earth: 17 hours ago, 7 flags -
Russian intelligence officer: explosions at defense factories in the USA and Wales may be sabotage
Weaponry: 14 hours ago, 6 flags -
Louisiana Lawmakers Seek to Limit Public Access to Government Records
Political Issues: 5 hours ago, 6 flags -
So I saw about 30 UFOs in formation last night.
Aliens and UFOs: 8 hours ago, 5 flags -
Not Aliens but a Nazi Occult Inspired and then Science Rendered Design.
Aliens and UFOs: 2 hours ago, 3 flags
active topics
-
Biden--My Uncle Was Eaten By Cannibals
US Political Madness • 39 • : Zanti Misfit -
The Tories may be wiped out after the Election - Serves them Right
Regional Politics • 18 • : alldaylong -
Silent Moments --In Memory of Beloved Member TDDA
Short Stories • 43 • : Naftalin -
"We're All Hamas" Heard at Columbia University Protests
Social Issues and Civil Unrest • 120 • : DBCowboy -
Alabama Man Detonated Explosive Device Outside of the State Attorney General’s Office
Social Issues and Civil Unrest • 56 • : DBCowboy -
What do you do to get to sleep and stay asleep ??
Health & Wellness • 108 • : TheGoondockSaint -
Russian intelligence officer: explosions at defense factories in the USA and Wales may be sabotage
Weaponry • 164 • : Enduro -
George Knapp AMA on DI
Area 51 and other Facilities • 9 • : nerbot -
MULTIPLE SKYMASTER MESSAGES GOING OUT
World War Three • 28 • : Astrocometus -
Russia Flooding
Fragile Earth • 14 • : andy06shake