It looks like you're using an Ad Blocker.
Please white-list or disable AboveTopSecret.com in your ad-blocking tool.
Thank you.
Some features of ATS will be disabled while you continue to use an ad-blocker.

Real Numbers for Gobal Warming - Some Surprises!
page: 11share:
a reply to: Phage
Good.
So you dispute my conjecture, but not my results. Is that correct?
In 15 minutes? Surely you jest!
It will take some time. Apparently they are using a proprietary file extension (.nc) for some pretty large files (>450 MB). I will need to download those to a computer with more processing power than this laptop and examine them. The .nc extension is typically a CNC output file extension, which I doubt is applicable in this case. But at least that holds out hope, for I would expect a dataset so large to produce large file sizes. Perhaps the code will give me some clues as to how the files are to be read, and I can use MatLab to read them if so.
Proprietary files are not unexpected. Many organizations use them, unfortunately. That's one reason I used Excel... .xlsx files are easy to open and read. I doubt Excel could handle the dataset they have, though. It is barely handling mine.
I have the link bookmarked.
TheRedneck
I agree that attributing specific weather events to global warming is problematic.
Good.
Your results indicate that Huntsville has warmed. It is your projections which I find problematic because they are based solely on a single location and only two variables.
So you dispute my conjecture, but not my results. Is that correct?
Have you reviewed the data and code?
In 15 minutes? Surely you jest!
It will take some time. Apparently they are using a proprietary file extension (.nc) for some pretty large files (>450 MB). I will need to download those to a computer with more processing power than this laptop and examine them. The .nc extension is typically a CNC output file extension, which I doubt is applicable in this case. But at least that holds out hope, for I would expect a dataset so large to produce large file sizes. Perhaps the code will give me some clues as to how the files are to be read, and I can use MatLab to read them if so.
Proprietary files are not unexpected. Many organizations use them, unfortunately. That's one reason I used Excel... .xlsx files are easy to open and read. I doubt Excel could handle the dataset they have, though. It is barely handling mine.
I have the link bookmarked.
TheRedneck
a reply to: TheRedneck
No reason to doubt the data, it seems to be from the NCDC dataset? www.ncdc.noaa.gov...
So you dispute my conjecture, but not my results. Is that correct?
So much data. So little time.
I doubt Excel could handle the dataset they have, though. It is barely handling mine.
a reply to: Phage
I believe it is. I didn't ask about the data, though. Do you dispute my results?
Do you know the difference between data, methodology, results, and conclusions?
TheRedneck
No reason to doubt the data, it seems to be from the NCDC dataset?
I believe it is. I didn't ask about the data, though. Do you dispute my results?
Do you know the difference between data, methodology, results, and conclusions?
TheRedneck
edit on 12/6/2018 by TheRedneck because: (no reason given)
a reply to: TheRedneck
No. I agree that the data shows that Huntsville is experiencing a warming trend.
Do you dispute my results?
Yes. And I think that a prediction based on a 50% curve fit of a limited dataset is...questionable. Particularly so when it is implied (or explicitly claimed by a headline) that it applies to a global scale.
Do you know the difference between data, methodology, results, and predictions?
a reply to: Phage
Good. Then you accept my analysis. That wasn't so hard, now, was it?
A conclusion is an interpretation of the results. My conclusions are that
My prediction is that the temperature will continue to increase until sometime between 2025 and 2030, at which time it will start to decrease again. I have little confidence in that prediction, however, because of the uncertainty in my conclusions. Because I have so little confidence in that prediction, I am not going to waste time with you trying to debate it. My future plans for the analysis will likely change my prediction somewhat anyway, so why waste time on it?
The conclusions are up for debate. Do you agree or disagree with my conclusions?
TheRedneck
No. I agree that the data shows that Huntsville is experiencing a warming trend.
Good. Then you accept my analysis. That wasn't so hard, now, was it?
A conclusion is an interpretation of the results. My conclusions are that
- The overall trend of the results show a long-term periodic cycle
during the period studied.
- Growing season as defined is not dependent on temperatures within the range shown.
- There appears to be a substantial amount of noise which lowers confidence in the period and amplitude of the long-term periodic cycle and requires additional analysis.
My prediction is that the temperature will continue to increase until sometime between 2025 and 2030, at which time it will start to decrease again. I have little confidence in that prediction, however, because of the uncertainty in my conclusions. Because I have so little confidence in that prediction, I am not going to waste time with you trying to debate it. My future plans for the analysis will likely change my prediction somewhat anyway, so why waste time on it?
The conclusions are up for debate. Do you agree or disagree with my conclusions?
TheRedneck
a reply to: TheRedneck
1) Your analysis shows a warming trend for Huntsville.
2) You have little confidence that a cooling trend will ensue on a decadal time frame.
Is that the point of this thread?
I contend that the time span of the data and a 50% fit to a polynomial regression does not warrant said conclusion regarding any long term cycle.
The overall trend of the results show a long-term periodic cycle during the period studied.
Okay.
Growing season as defined is not dependent on temperatures within the range shown.
Which analysis, has indeed, been done by various entities. Analysis which includes instrumental and observational biases.
There appears to be a substantial amount of noise which lowers confidence in the period and amplitude of the long-term periodic cycle and requires additional analysis.
Thank you for the clarification.
Because I have so little confidence in that prediction, I am not going to waste time with you trying to debate it.
The conclusions are up for debate. Do you agree or disagree with my conclusions?
1) Your analysis shows a warming trend for Huntsville.
2) You have little confidence that a cooling trend will ensue on a decadal time frame.
Is that the point of this thread?
edit on 12/6/2018 by Phage because: (no reason given)
a reply to: Phage
You seem fixated on that trend line. Ignore that; it was only put in to make the prediction. It is not a conclusion; it is part of a prediction I stated clearly the first time I made it I had little confidence in.
It is becoming evident you do not understand the differences between the various parts of an analysis. That's nothing to be ashamed of, Phage. Just read what I wrote without trying to shoehorn it into what you want it to say.
Now, ignoring the prediction for the moment, do you agree the trend indicates a periodic cycle?
The point was to show how to actually conduct an analysis. I see with you I have failed miserably.
TheRedneck
I contend that the time span of the data and a 50% fit to a polynomial regression does not warrant said conclusion.
You seem fixated on that trend line. Ignore that; it was only put in to make the prediction. It is not a conclusion; it is part of a prediction I stated clearly the first time I made it I had little confidence in.
It is becoming evident you do not understand the differences between the various parts of an analysis. That's nothing to be ashamed of, Phage. Just read what I wrote without trying to shoehorn it into what you want it to say.
Now, ignoring the prediction for the moment, do you agree the trend indicates a periodic cycle?
Is that the point of this thread?
The point was to show how to actually conduct an analysis. I see with you I have failed miserably.
TheRedneck
a reply to: TheRedneck
Your simplistic approach does not support this claim.
You have repeatedly asked and I have repeatedly answered.
It is becoming evident you do not understand the differences between the various parts of an analysis.
No. The regression analysis is insufficient for such a conclusion. (48% ? Really?)
Now, ignoring the prediction for the moment, do you agree the trend indicates a periodic cycle?
No. It is those who rallied behind what you claimed who have failed, not I.
The point was to show how to actually conduct an analysis. I see with you I have failed miserably.
The observed warming is likely simply a portion of a long-term sinusoidal variation which is quite likely natural. Any carbon dioxide based increase appears to be minuscule compared to this cycle.
Your simplistic approach does not support this claim.
edit on 12/6/2018 by Phage because: (no reason given)
a reply to: Phage
I have repeatedly asked because, despite your assurance that you do, you continue to confuse things.
I ask about results, and you respond you agree with the data.
I ask about conclusions and you fixate on predictions.
I ask about conclusions and you complain about a headline.
No, Phage, you do not understand analysis.
One more time... in condensed form, not really for you any more but for those who do want to understand the point of the thread:
An analysis is divided into 5 major parts:
Data
Methodology:
Results:
Conclusions:
Predictions:
And finally, although not part of an analysis, there is the reported story... which is nothing more than an opinion on the conclusions or the predictions. Thus, it is actually an opinion on an interpretation, or an opinion on a guess based on an interpretation. This is what CNN, ABC, CBS, NBC, FOX, MSNBC, Al Jazeera, and any other news outlets give.
Hopefully, some will pick this up easier than Phage.
TheRedneck
You have repeatedly asked and I have repeatedly answered.
I have repeatedly asked because, despite your assurance that you do, you continue to confuse things.
I ask about results, and you respond you agree with the data.
I ask about conclusions and you fixate on predictions.
I ask about conclusions and you complain about a headline.
No, Phage, you do not understand analysis.
One more time... in condensed form, not really for you any more but for those who do want to understand the point of the thread:
An analysis is divided into 5 major parts:
Data
- This is the quantified information that is gathered. Disputing the data means one also disputes everything that follows, since the data
integrity is the beginning point of the analysis.
Methodology:
- This is how the data is manipulated. It includes any calculations, coding, and adjustments made to the data in order to get results.
The methodology may be disputed without disputing the data, but a dispute of the methodology is a dispute of the results, conclusions, and
predictions.
Results:
- This is what the analysis says. The only way to dispute a result is by disputing the data or the methodology, since the results are
directly controlled by the data and methodology. It typically includes graphical information.
Conclusions:
- Conclusions are interpretations of the results. They are typically very conservative and are based on the analyst's examination of
the results. Conclusions may be disputed without disputing the analysis itself since they are interpretations.
Predictions:
- A prediction is an extended interpolation of the results, usually colored by the conclusions, and in reality is little more than an
educated guess. Predictions may contain varying levels of confidence. The accuracy of the predictions will either lend credence to or dispute in
themselves the conclusions. The amount of credence or dispute depends on the level of confidence; a prediction with low confidence has little bearing
on the veracity of the conclusions, but a prediction with high confidence has a great effect on the veracity of the conclusions. Predictions are
typically based on trend lines, statistical analysis of the results based on assumptions in the conclusions, or sometimes just a gut
feeling.
And finally, although not part of an analysis, there is the reported story... which is nothing more than an opinion on the conclusions or the predictions. Thus, it is actually an opinion on an interpretation, or an opinion on a guess based on an interpretation. This is what CNN, ABC, CBS, NBC, FOX, MSNBC, Al Jazeera, and any other news outlets give.
Hopefully, some will pick this up easier than Phage.
TheRedneck
a reply to: TheRedneck
Thank you for all your work. It took me some time to work me through it. I'm not so good in English.
So it could be true: The whole solar system is warming up. Everything goes in cycles.
BTW if ignorance knocks you must keep the door closed. But maybe I'm wrong .. my English ... you know
Thank you for all your work. It took me some time to work me through it. I'm not so good in English.
So it could be true: The whole solar system is warming up. Everything goes in cycles.
BTW if ignorance knocks you must keep the door closed. But maybe I'm wrong .. my English ... you know
a reply to: TheRedneck
Why bother?
From the Times article...
And we can stop right there. Even temp records from as recent as 50 years ago are highly dubious, and you're going to tell me the conclusions are based on temp data including that from the 1700's? I'm sorry, but I'll have to call "poppycock" on the whole damn thing. A glowing example of why peer-reviewed isn't always the hallmark of being legit.
Why bother?
From the Times article...
The careful analysis by our team is laid out in five scientific papers now online at BerkeleyEarth.org. That site also shows our chart of temperature from 1753 to the present,
And we can stop right there. Even temp records from as recent as 50 years ago are highly dubious, and you're going to tell me the conclusions are based on temp data including that from the 1700's? I'm sorry, but I'll have to call "poppycock" on the whole damn thing. A glowing example of why peer-reviewed isn't always the hallmark of being legit.
edit on 6-12-2018 by Gazrok because: (no reason given)
a reply to: zandra
You are quite welcome! I hope you learned something in the process of going through it.
I do believe the trends we have seen are at least primarily due to a sinusoidal function. In the picture below, I show a sine wave in the left-hand section, and a selected portion of that same sine wave in the right-hand section. That right-hand section, to my eye anyway, bears an uncanny resemblance to to the results of my analysis.
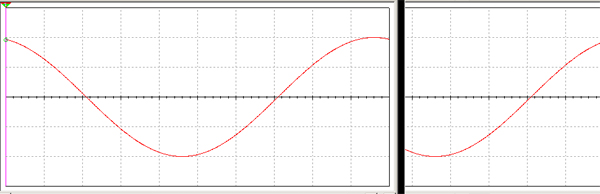
As I have explained multiple times now, the trend line is an approximation only. If the result is showing part of a sinusoidal function, it will take the form of (Y/2)(e^iwt +/- e^-iwt), where Y is the amplitude, w is the angular momentum, and of course t is time. That's the normal, expected solution to most natural differential equations, of which the climate, being a control system, would likely follow. The trend lines are not logarithmic; they are polynomial. A high order polynomial expression can simulate a logarithmic expression for a short period, but it will always diverge after that.
Of course, as chaotic as the atmosphere is, I expect I will also see many higher-frequency wave components mixed into the longer one, which are manifesting themselves as noise. If there is an underlying increase due to carbon dioxide, it would show up as an even longer period wave underlying the rest of the wave forms, probably with an exaggerated bandwidth due to the extremely long period.
TheRedneck
You are quite welcome! I hope you learned something in the process of going through it.
I do believe the trends we have seen are at least primarily due to a sinusoidal function. In the picture below, I show a sine wave in the left-hand section, and a selected portion of that same sine wave in the right-hand section. That right-hand section, to my eye anyway, bears an uncanny resemblance to to the results of my analysis.
As I have explained multiple times now, the trend line is an approximation only. If the result is showing part of a sinusoidal function, it will take the form of (Y/2)(e^iwt +/- e^-iwt), where Y is the amplitude, w is the angular momentum, and of course t is time. That's the normal, expected solution to most natural differential equations, of which the climate, being a control system, would likely follow. The trend lines are not logarithmic; they are polynomial. A high order polynomial expression can simulate a logarithmic expression for a short period, but it will always diverge after that.
Of course, as chaotic as the atmosphere is, I expect I will also see many higher-frequency wave components mixed into the longer one, which are manifesting themselves as noise. If there is an underlying increase due to carbon dioxide, it would show up as an even longer period wave underlying the rest of the wave forms, probably with an exaggerated bandwidth due to the extremely long period.
TheRedneck
a reply to: Gazrok
Why not?
I will admit I have many questions about the veracity of the data going so far back into history, but I will still do due diligence in examining their analysis. I just can't do it on Phage's time schedule... the previous analysis I spread out over a couple months of medically necessary idle time, so expecting me to examine data and methodology and provide an answer in under an hour is simply ludicrous. This is something I will do a bit at a time over a time period, during those times when I need a quick break from my main project.
I am glad, though, to see you have understood my little lesson above... the first step is always to verify the data; if the data is not verifiable from a trusted source, the entire analysis is useless. I won't make my call on that yet, but I will soon.
TheRedneck
Why bother?
Why not?
I will admit I have many questions about the veracity of the data going so far back into history, but I will still do due diligence in examining their analysis. I just can't do it on Phage's time schedule... the previous analysis I spread out over a couple months of medically necessary idle time, so expecting me to examine data and methodology and provide an answer in under an hour is simply ludicrous. This is something I will do a bit at a time over a time period, during those times when I need a quick break from my main project.
I am glad, though, to see you have understood my little lesson above... the first step is always to verify the data; if the data is not verifiable from a trusted source, the entire analysis is useless. I won't make my call on that yet, but I will soon.
TheRedneck
That's just it. If you have flawed data from jump (like from the 1700's), then even doing the statistical analysis flawlessly, is going to net you an
outcome that is just as flawed as the original data.
In essence, garbage in, garbage out.
Add in that we really have no solid knowledge of why we've had such dramatic climate change in Earth's history (just theories), and no matter how educated the guess is, it is still just guesswork.
At least you used more reliable data in your localized example. But really, to rule out the factors of urbanization on changing the temp in the urban area, you'd have to have had sensors in remote areas, over the same time frame, and we can't go back and put them there in the past. So in the end, we really can't rule out those being the sole factors (urbanization increasing the temp in that local observed area)....or conclude that the temps in the rural areas have changed at all.
a reply to: Gazrok
Agreed. I just don't like to immediately toss out a study based on an assumption. There are other ways to gather data on temperature other than direct measurement; they are just less accurate. As long as that inaccuracy is considered in the study, it can still be considered sound within a certain tolerance.
If the data is accurate to within, say 5 degrees, and a conclusion is made that there is a certainty of 2 degrees of warming... well, that would be an issue.
TheRedneck
Our new Google sheets does 1 million rows of data but I hate Sheets so I stick to Excel. 30000 rows in google I go to lunch Excel take a drink of
coffee and keep working. The cloud doesn't help speed.
a reply to: TheRedneck
Nice thread TheRedNeck. I think the warming from CO2 is trivial as well and think changes in cloud-cover might be able to explain a large part of the observed warming. Looking forward to see what your other projects are.
Nice thread TheRedNeck. I think the warming from CO2 is trivial as well and think changes in cloud-cover might be able to explain a large part of the observed warming. Looking forward to see what your other projects are.
a reply to: SRPrime
First of all, I have to say that it is rather arrogant for puny man (driven by the Satanic forces of Rothschild Zionism) to think that they can take a few hundred or thousand positions on the earth (usually in cities with urban heat island distortions in the data), measure them for a hundred years (more or less), then declare that they can surmise the weather patterns and cycles on earth, a planet thought to be 4+ billion years old. This is extreme arrogance and simply laughable...
Secondly, why would the Satanic forces of Rothschild Zionism which are said to own 95% of the world's media, be incessantly pushing the notion that man-made, human caused global warming of the planet will destroy us if we do not do something, through their control of the global media? Anyone with a brain out there, think about this!
Thirdly, since the Satanic forces of Rothschild Zionism were founded in the 18th century by a cabal of Mayer Amschel Rothschild, Adam Weishaupt & Jacob Frank, and that these men openly practiced the Sabbatean-Frankist apostosy of Judaism with the creed, "redemption through sin", aren't the new generations of Rothschild Zionists just redeeming themselves through the sin of lying through their teeth about global warming and that humans can actually do something to thwart the natural cycles of the earth? Aren't they just lying to create a stolen revenue stream based on a lie? Just consider all the govts. around the world today arranging the carbon taxes which will eventually be paid for from the revenue stolen mainly from the masses?
Then there is the question, why carbon? Why not water vapour or methane which are thought to be 20X or more potent as greenhouse gases than C02?
The obvious reason is that this hoax has been conjured up to loot the public and CO2, despite being an essential molecule in the production of oxygen, forests, oceans and hence naturally cooling the planet, has been identified as the molecule to be taxed because it is unanimously and abundantly produced by almost every human on the planet by their activity. The other "real" greenhouse gases would render much less revenue to be stolen!
Final conclusion:
Blaming the naturally cycling climate change on planet earth on human activity, is a long-thought out plan to loot the public by inventing the perception that this continued activity will render humanity and the planet extinct, "If we don't do something". THIS IS A CAREFULLY CRAFTED HOAX!!! The main authors of this HOAX, I name above, are in collusion with other unnamed others also proliferating the HOAX across worldwide society, and governments around the world are the puppets to this agenda. This issue also demonstrates the great power of collective mind control by the monolithic control of the media.
new topics
-
Thousands Of Young Ukrainian Men Trying To Flee The Country To Avoid Conscription And The War
Other Current Events: 3 hours ago -
12 jurors selected in Trump criminal trial
US Political Madness: 6 hours ago -
Iran launches Retalliation Strike 4.18.24
World War Three: 6 hours ago -
Israeli Missile Strikes in Iran, Explosions in Syria + Iraq
World War Three: 6 hours ago
top topics
-
George Knapp AMA on DI
Area 51 and other Facilities: 12 hours ago, 25 flags -
Israeli Missile Strikes in Iran, Explosions in Syria + Iraq
World War Three: 6 hours ago, 15 flags -
Louisiana Lawmakers Seek to Limit Public Access to Government Records
Political Issues: 14 hours ago, 7 flags -
Iran launches Retalliation Strike 4.18.24
World War Three: 6 hours ago, 6 flags -
Not Aliens but a Nazi Occult Inspired and then Science Rendered Design.
Aliens and UFOs: 12 hours ago, 5 flags -
12 jurors selected in Trump criminal trial
US Political Madness: 6 hours ago, 4 flags -
The Tories may be wiped out after the Election - Serves them Right
Regional Politics: 16 hours ago, 3 flags -
Thousands Of Young Ukrainian Men Trying To Flee The Country To Avoid Conscription And The War
Other Current Events: 3 hours ago, 3 flags
active topics
-
It has begun... Iran begins attack on Israel, launches tons of drones towards the country
World War Three • 888 • : DISRAELI2 -
African "Newcomers" Tell NYC They Don't Like the Free Food or Shelter They've Been Given
Social Issues and Civil Unrest • 18 • : GENERAL EYES -
-@TH3WH17ERABB17- -Q- ---TIME TO SHOW THE WORLD--- -Part- --44--
Dissecting Disinformation • 537 • : brewtiger123 -
Graham Hancock being proven right all along about ancient humans in America.
Ancient & Lost Civilizations • 105 • : bluesfreak2 -
Thousands Of Young Ukrainian Men Trying To Flee The Country To Avoid Conscription And The War
Other Current Events • 2 • : DerBeobachter2 -
The Tories may be wiped out after the Election - Serves them Right
Regional Politics • 23 • : andy06shake -
Mandela Effect - It Happened to Me!
The Gray Area • 109 • : ArMaP -
Mood Music Part VI
Music • 3058 • : Hellmutt -
Fossils in Greece Suggest Human Ancestors Evolved in Europe, Not Africa
Origins and Creationism • 60 • : whereislogic -
Scarface does Tiny Desk Concert
Music • 7 • : sitrose