It looks like you're using an Ad Blocker.
Please white-list or disable AboveTopSecret.com in your ad-blocking tool.
Thank you.
Some features of ATS will be disabled while you continue to use an ad-blocker.

North Carolina Chose to Ignore Its Dangerous Sea Levels Years Before Hurricane Florence Hit
page: 2share:
originally posted by: pointessa
a reply to: FredT
I have lived across the street from an ocean beach for a long time and have never seen any changes at all except for the tides levels changing. Not at all.
Its a fairly slow process from 1994 to 2014 It was 2.6 inches. At that kind of rise its hard to notice as you live with it every day and its hard to notice minute changes. Couple that with the ongoing erosion that waves cause its hard to notice.
originally posted by: FredT
originally posted by: pointessa
a reply to: FredT
I have lived across the street from an ocean beach for a long time and have never seen any changes at all except for the tides levels changing. Not at all.
Its a fairly slow process from 1994 to 2014 It was 2.6 inches. At that kind of rise its hard to notice as you live with it every day and its hard to notice minute changes. Couple that with the ongoing erosion that waves cause its hard to notice.
Show me the numbers. From the NOAA links I posted for Duck, NC (picked at random... feel free to use any NOAA station location if you wish) the Mean High Water elevation for the 1960-1978 epoch was 3.43 feet. From the 1983 to present epoch it is 3.37 feet. The Sea level datum had a Mean Sea Level of 1.81 feet in the pre-1978 epoch, and presently has a 1.77 feet Mean Sea Level.
Where are these 2,4 inch rise numbers coming from, because they sure as hell aren't from NOAA recorded data.
edit on 13-9-2018 by burdman30ott6
because: (no reason given)
a reply to: burdman30ott6
www.climate.gov...
and this is post Trump white washing
Go to the end of the article and it has enough data sources for you to shake a piece of coal at.
Also
also tidesandcurrents.noaa.gov... which gives you a local trend vs the rest of the planet.
www.climate.gov...
and this is post Trump white washing
Go to the end of the article and it has enough data sources for you to shake a piece of coal at.
Also
Sea level rise at specific locations may be more or less than the global average due to local factors such as land subsidence from natural processes and withdrawal of groundwater and fossil fuels, changes in regional ocean currents, and whether the land is still rebounding from the compressive weight of Ice Age glaciers.
edit on 9/13/18 by FredT because: (no reason given)
also tidesandcurrents.noaa.gov... which gives you a local trend vs the rest of the planet.
edit on 9/13/18 by
FredT because: (no reason given)
a reply to: FredT
I said numbers, you linked me to the narrative, not the science.
I linked to actual recorded data which shows that these little graphs and the narrative are bogus.
I'll also comment on one of the graphics from the first link you posted... "Nuisance flooding is 300-900% more frequent than 50 years ago." It absolutely is, but they're misattributing the reason to AGW. It's more common because we've paved a lot more of the continent in the last 50 years while installing thousands of flood diversion and control devices which were designed for runoff coefficients equal to the relatively unpaved land mass of a half century ago. Pavement sheds 100% of the rain that falls on it, gravel lots shed 85-90%, landscaped lawns and fields (unless designed using very recent Low Impact Development standards) shed 60-70% of the rain that hits them. Undisturbed, native soil with natural cover has a runoff coefficient dependent on the soil type, but in many coastal areas and waterways it would naturally be absorbing most rainfall, shedding only 35% or less of the rainfall that hits it. What I'm saying there is that if you had 10% of a watershed which was developed and 90% natural fifty years ago, you'd have had a LOT less runoff following a normal event than you see today where some watershed in places like Houston and Phoenix are 80%+ developed. In fact, one could predict that an area which sees 800% more developed land versus 50 years ago (10% developed versus 80%) would experience an 800% increase in runoff which would easily overtop any flood dike structure designed for the runoffs of 50 years ago.
This is engineering, man. I'm telling you you're falling for a ponzi scheme. The actual data and the science don't lead to what the agenda driven narrative has convinced you is the case. I work with these numbers extensively on transportation, land development, and restoration projects... sea levels aren't rising.
originally posted by: burdman30ott6
This is engineering, man. I'm telling you you're falling for a ponzi scheme. The actual data and the science don't lead to what the agenda driven narrative has convinced you is the case. I work with these numbers extensively on transportation, land development, and restoration projects... sea levels aren't rising.
I could easily say the same but its kind of like arguing against a Climate version of the Tobacco Institute.
I looked at your favorite Buoy Station, 8651370 Duck, NC and when you plot out the water level it CLEARLY shows from 1954 (I also plugged in 1994) to 2018 a rise in average level. In 1954 the average was 1.5 feet and now that baseline is over 2
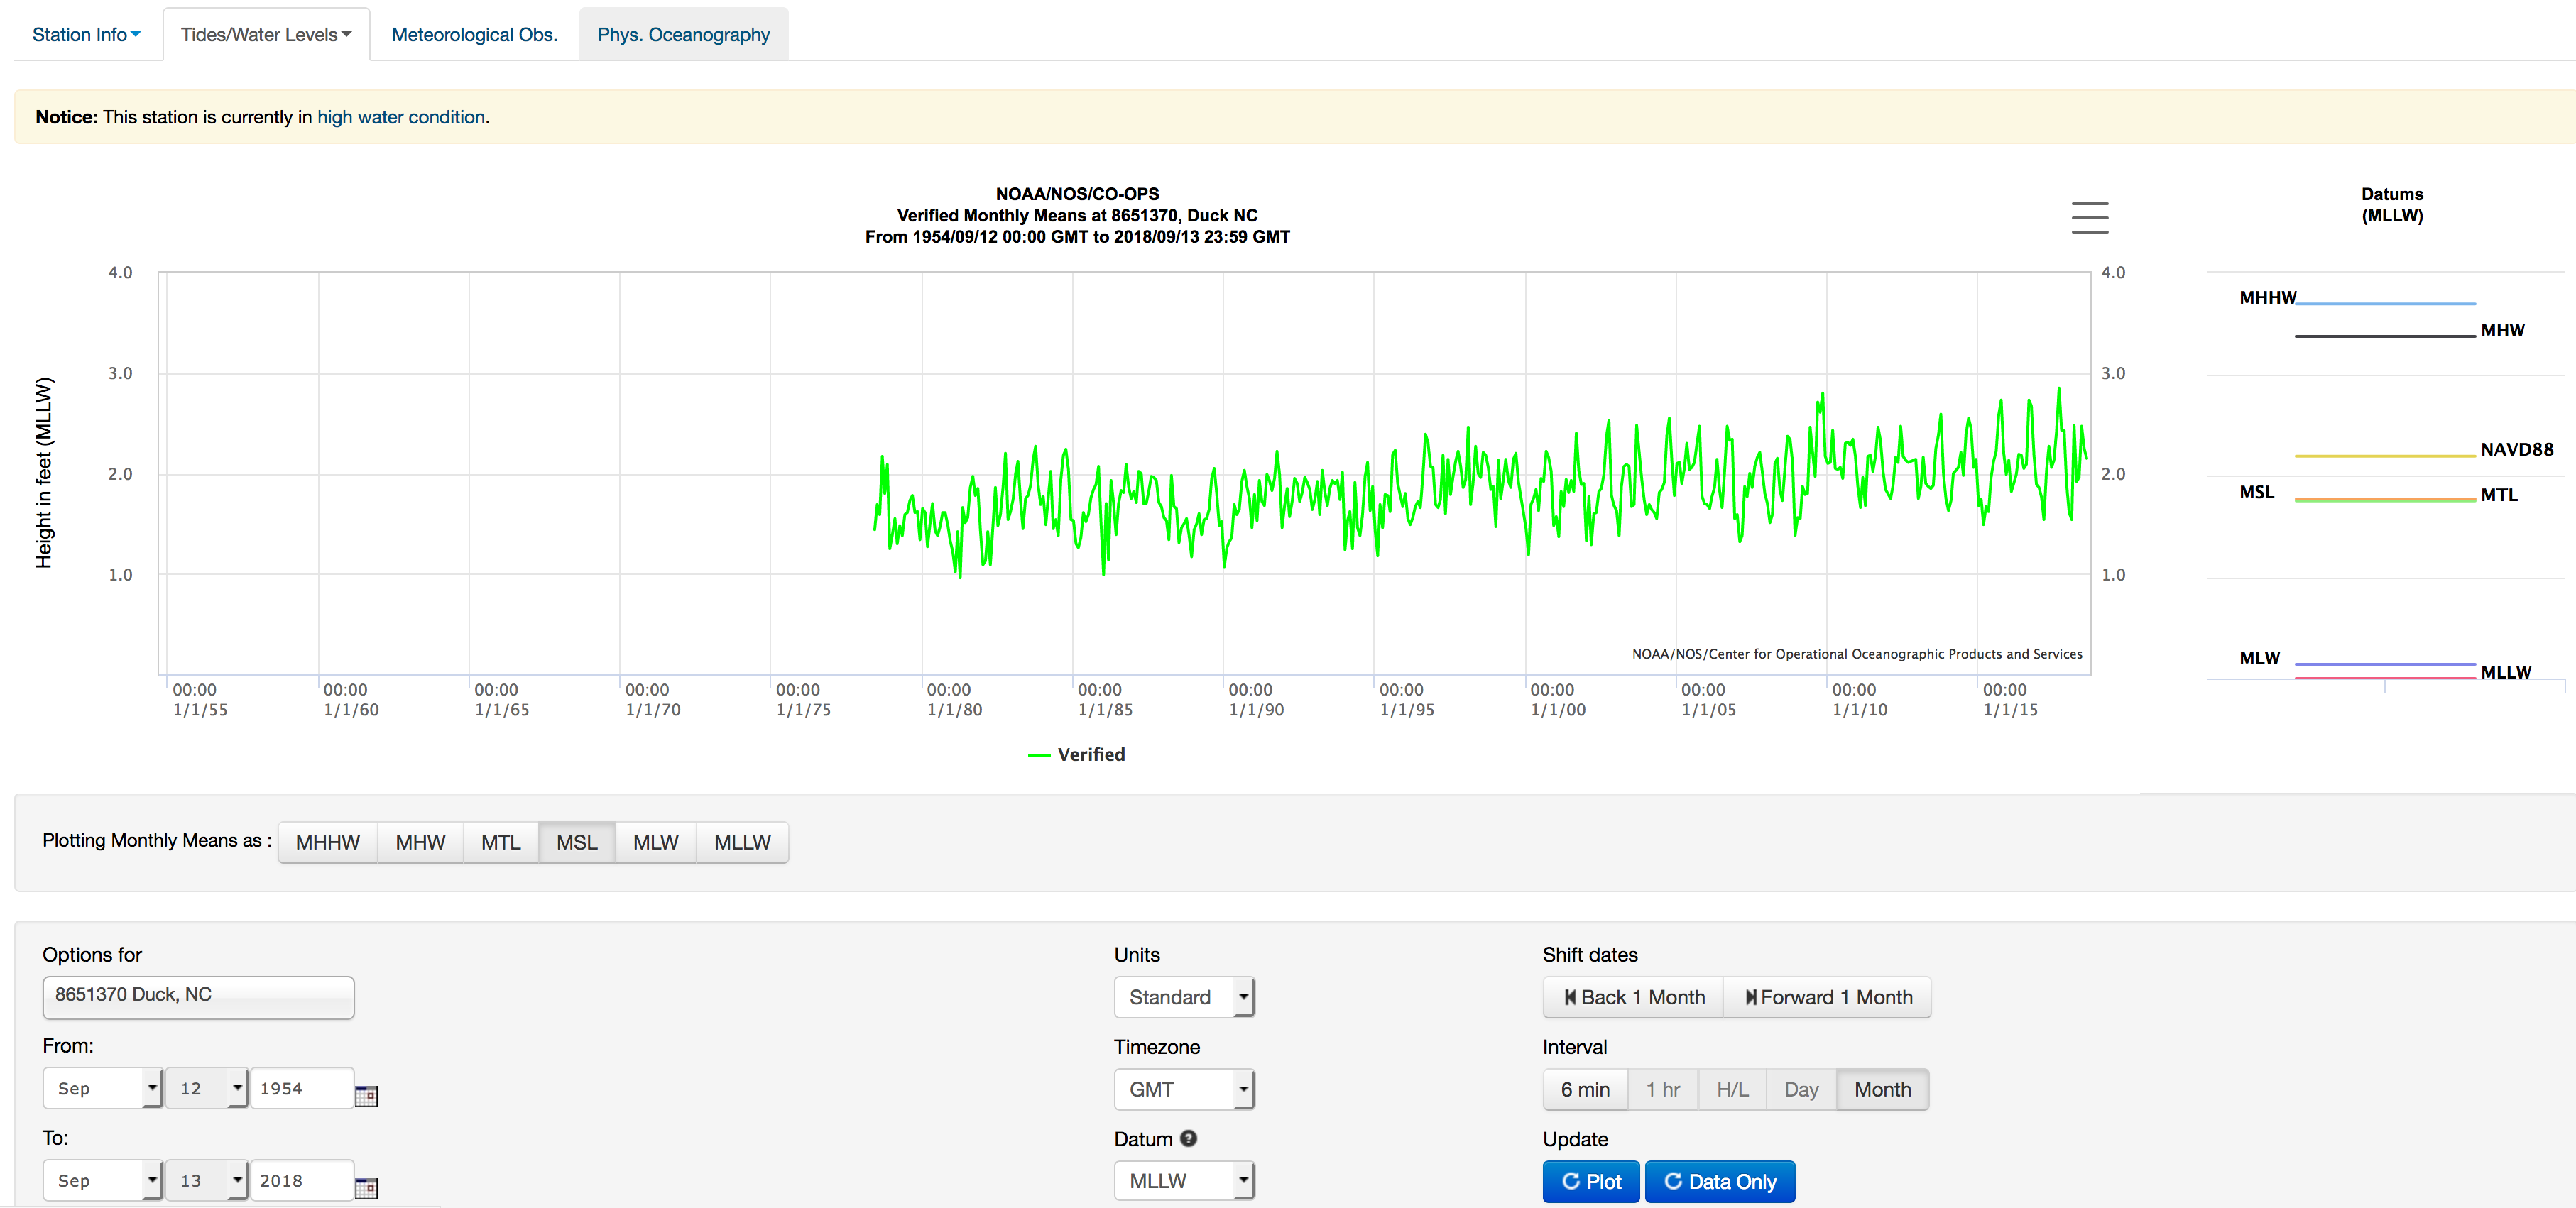
So not sure what your seeing.......
a reply to: FredT
That's the rabbit in the tophat. Notice on that chart it says
"The plot shows the monthly mean sea level without the regular seasonal fluctuations due to coastal ocean temperatures, salinities, winds, atmospheric pressures, and ocean currents."
In other words, they've manipulated the data to generate something which is not there. For the surface elevation to have increased like that, the water level elevations (MLW, MLLW MHW, and MHHW, as well as MSL) would display the same increases. There are two vertical datums used in this type of data... the NGVD 1929 and the NAVD 1988. NAVD 1088 was actually adopted because it was discovered that using a mean sea level datum introduced local variations in the elevation used for the datum. NOAA is manipulating the data for their graph, (which is admitted in their disclaimer( while providing the raw data for engineers to use... the raw data isn't showing this sea level rise.
Can you? Can you speak as an engineer who physically uses and depends on the data sets to ensure he doesn't find himself on the defense end of a massive lawsuit if the data isn't used properly in the engineering design? I'm not going to argue most medical issues with you because that's your wheelhouse, you're standing in my wheelhouse on this one, however.
That's the rabbit in the tophat. Notice on that chart it says
"The plot shows the monthly mean sea level without the regular seasonal fluctuations due to coastal ocean temperatures, salinities, winds, atmospheric pressures, and ocean currents."
In other words, they've manipulated the data to generate something which is not there. For the surface elevation to have increased like that, the water level elevations (MLW, MLLW MHW, and MHHW, as well as MSL) would display the same increases. There are two vertical datums used in this type of data... the NGVD 1929 and the NAVD 1988. NAVD 1088 was actually adopted because it was discovered that using a mean sea level datum introduced local variations in the elevation used for the datum. NOAA is manipulating the data for their graph, (which is admitted in their disclaimer( while providing the raw data for engineers to use... the raw data isn't showing this sea level rise.
I could easily say the same
Can you? Can you speak as an engineer who physically uses and depends on the data sets to ensure he doesn't find himself on the defense end of a massive lawsuit if the data isn't used properly in the engineering design? I'm not going to argue most medical issues with you because that's your wheelhouse, you're standing in my wheelhouse on this one, however.
Next up: The ice cap is going to melt and the Northwest Passage will be open for shipping in less than 10 years...oh wait..they said that in
1998...still not possible.
Oh well, it won't matter because according to climate cultists, the arctic will be ice free by or before 2020...or 2030...or 2040...or maybe by 2050?
It's real easy to predict stuff when you can move the goal posts everytime your prediction is wrong.
Kind of like the religious whackjobs that release a new date for Armageddon every couple of years...
Yet somehow, people who don't buy the AGW climate change narrative are the "deniers" who are equivalent to flat earthers and holocaust deniers...
Why don't you rollout the old "scientific consensus" chestnut?
Clearly in the world of goal post moving, somewhere between 2018 and 2050 is a "consensus", lol...
Ridiculous.
a reply to: burdman30ott6
LOL I may be an a expert but that does not mean I don't make mistakes.
From an engineering standpoint (My father was a civil engineer) you use data to design, model etc. In this case North Carolina instructed state agencies to use data that painted a rosy picture to allow sketchy coastal development because they were bought and paid for. You can engineer the heck out of something but if the data that its based on is flawed then that design is compromised.
While this thread has morphed into a larger climate change argument, The facts show that North Carolina Legislators did this specifically to protect an industry that paid for that protection despite the conclusions of their own commission
originally posted by: MightyDillHole
Next up: The ice cap is going to melt and the Northwest Passage will be open for shipping in less than 10 years...oh wait..they said that in 1998...still not possible.
Oh well, it won't matter because according to climate cultists, the arctic will be ice free by or before 2020...or 2030...or 2040...or maybe by 2050?
Thank you. We're all refreshed and challenged by your unique point of view.
Maersk sends first container ship through Arctic route
www.reuters.com...
DO you have anything but rhetoric to bring to the discussion?
edit on 9/13/18 by FredT because: (no reason given)
a reply to: FredT
You're welcome, and I agree that you are certainly challenged.
By the way...one ship proves exactly zilch.
Many ships have managed a dangerous passage through there.
Doesn't classify it as open.
As far as I have read, even scientists say if the arctic ocean goes ice free in the summer, the Northwest Passage will remain commercially unviable.
Submarines have surfaced at or near the North Pole in open water since the early '50's...doesn't classify it as ice free either.
Do YOU have anything other than debunked faulty data to bring to the discussion, or are you just looking for a new place to put the goal posts to make you look like you have a valid data set (you don't, no matter how you manipulate the graphs).
Rhetoric indeed.
Countered with a huge dash of pseudo-intellectualism...
new topics
-
Russian intelligence officer: explosions at defense factories in the USA and Wales may be sabotage
Weaponry: 2 hours ago -
African "Newcomers" Tell NYC They Don't Like the Free Food or Shelter They've Been Given
Social Issues and Civil Unrest: 2 hours ago -
Russia Flooding
Other Current Events: 4 hours ago -
MULTIPLE SKYMASTER MESSAGES GOING OUT
World War Three: 4 hours ago -
Two Serious Crimes Committed by President JOE BIDEN that are Easy to Impeach Him For.
US Political Madness: 5 hours ago -
911 emergency lines are DOWN across multiple states
Breaking Alternative News: 5 hours ago -
Former NYT Reporter Attacks Scientists For Misleading Him Over COVID Lab-Leak Theory
Education and Media: 8 hours ago -
Why did Phizer team with nanobot maker
Medical Issues & Conspiracies: 8 hours ago -
Pro Hamas protesters at Columbia claim hit with chemical spray
World War Three: 8 hours ago -
Elites disapearing
Political Conspiracies: 10 hours ago
top topics
-
Go Woke, Go Broke--Forbes Confirms Disney Has Lost Money On Star Wars
Movies: 12 hours ago, 13 flags -
Pro Hamas protesters at Columbia claim hit with chemical spray
World War Three: 8 hours ago, 11 flags -
Elites disapearing
Political Conspiracies: 10 hours ago, 9 flags -
Freddie Mercury
Paranormal Studies: 13 hours ago, 7 flags -
Nirvana - Immigrant Song
Music: 17 hours ago, 5 flags -
A Personal Cigar UFO/UAP Video footage I have held onto and will release it here and now.
Aliens and UFOs: 10 hours ago, 5 flags -
African "Newcomers" Tell NYC They Don't Like the Free Food or Shelter They've Been Given
Social Issues and Civil Unrest: 2 hours ago, 5 flags -
Two Serious Crimes Committed by President JOE BIDEN that are Easy to Impeach Him For.
US Political Madness: 5 hours ago, 5 flags -
911 emergency lines are DOWN across multiple states
Breaking Alternative News: 5 hours ago, 4 flags -
Former NYT Reporter Attacks Scientists For Misleading Him Over COVID Lab-Leak Theory
Education and Media: 8 hours ago, 4 flags
active topics
-
God is watching.
Politicians & People • 27 • : PrivateAngel -
Russian intelligence officer: explosions at defense factories in the USA and Wales may be sabotage
Weaponry • 21 • : Terpene -
Mood Music Part VI
Music • 3051 • : BrucellaOrchitis -
I Guess Cloud Seeding Works
Fragile Earth • 21 • : BrucellaOrchitis -
Elites disapearing
Political Conspiracies • 20 • : HerbertWest -
What Time is it on the Moon ?
Space Exploration • 50 • : wildespace2 -
Why did Phizer team with nanobot maker
Medical Issues & Conspiracies • 6 • : annonentity -
Israel ufo shoot down drones?
Aliens and UFOs • 26 • : GENERAL EYES -
African "Newcomers" Tell NYC They Don't Like the Free Food or Shelter They've Been Given
Social Issues and Civil Unrest • 4 • : GENERAL EYES -
The Acronym Game .. Pt.3
General Chit Chat • 7722 • : bally001