It looks like you're using an Ad Blocker.
Please white-list or disable AboveTopSecret.com in your ad-blocking tool.
Thank you.
Some features of ATS will be disabled while you continue to use an ad-blocker.

Trump sums up Global Warming in one Savage Tweet
page: 4share:
originally posted by: TerryMcGuire
i bet this one is not a real Trump Tweet, but rather one of his staff tweeting under his name. We know now that this happens all the time. The words are too clear, there are no punctuation errors , the sentences are constructed properly and there are no miss-spellings.
you must just hate your life right now...lol
Trump tweets about the weather.
.... and ATS jumps on their soapboxes to argue about climate.
Priceless.
.... and ATS jumps on their soapboxes to argue about climate.
Priceless.
originally posted by: EvidenceNibbler
originally posted by: djz3ro
originally posted by: EvidenceNibbler
[
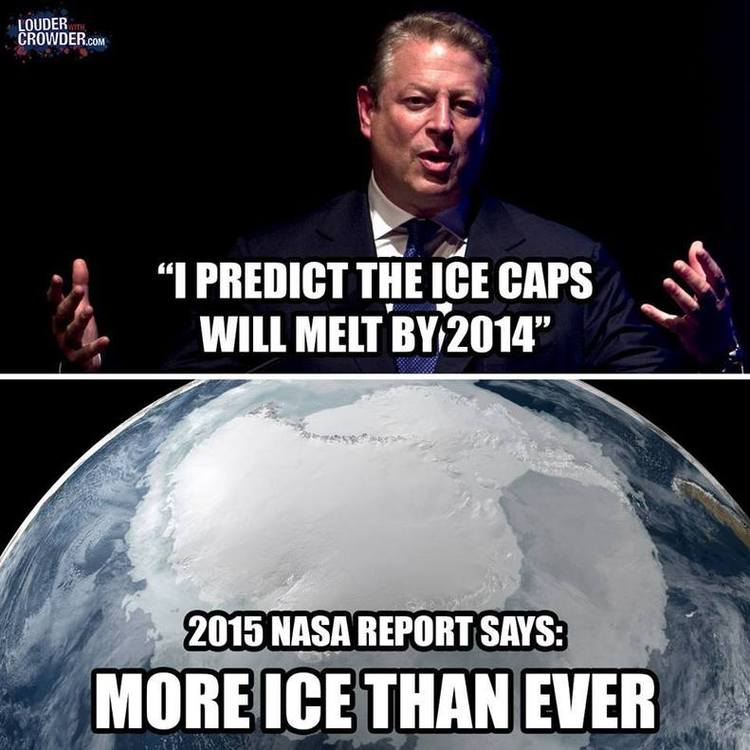
Do you have any actual data or is this meme the limit of your evidence? Because the ice caps are getting smaller, there's satellite imagery that backs this up but it's 7.40am and I have a 3 year old and a 5 year old to contend with...
www.nasa.gov...
Oct. 30, 2015
A new NASA study says that an increase in Antarctic snow accumulation that began 10,000 years ago is currently adding enough ice to the continent to outweigh the increased losses from its thinning glaciers.
Thank you, I'll have a look at that on my way to work.
a reply to: EvidenceNibbler
Trump’s tweet, and your OP, make no mention of human involvement...
But sure... here you go...
climate.nasa.gov...
Trump’s tweet, and your OP, make no mention of human involvement...
But sure... here you go...
Since the beginning of the Industrial Revolution, the acidity of surface ocean waters has increased by about 30 percent.11,12 This increase is the result of humans emitting more carbon dioxide into the atmosphere and hence more being absorbed into the oceans. The amount of carbon dioxide absorbed by the upper layer of the oceans is increasing by about 2 billion tons per year.
The planet's average surface temperature has risen about 2.0 degrees Fahrenheit (1.1 degrees Celsius) since the late 19th century, a change driven largely by increased carbon dioxide and other human-made emissions into the atmosphere.5 Most of the warming occurred in the past 35 years, with 16 of the 17 warmest years on record occurring since 2001. Not only was 2016 the warmest year on record, but eight of the 12 months that make up the year — from January through September, with the exception of June — were the warmest on record for those respective months.
climate.nasa.gov...
a reply to: Hazardous1408
I really wouldn't bother since Trump the moronic have taken over. They will call this time period in the future the modern dark age.
I really wouldn't bother since Trump the moronic have taken over. They will call this time period in the future the modern dark age.
originally posted by: Hazardous1408
a reply to: EvidenceNibbler
Trump’s tweet, and your OP, make no mention of human involvement...
But sure... here you go...
Since the beginning of the Industrial Revolution, the acidity of surface ocean waters has increased by about 30 percent.11,12 This increase is the result of humans emitting more carbon dioxide into the atmosphere and hence more being absorbed into the oceans. The amount of carbon dioxide absorbed by the upper layer of the oceans is increasing by about 2 billion tons per year.
The planet's average surface temperature has risen about 2.0 degrees Fahrenheit (1.1 degrees Celsius) since the late 19th century, a change driven largely by increased carbon dioxide and other human-made emissions into the atmosphere.5 Most of the warming occurred in the past 35 years, with 16 of the 17 warmest years on record occurring since 2001. Not only was 2016 the warmest year on record, but eight of the 12 months that make up the year — from January through September, with the exception of June — were the warmest on record for those respective months.
climate.nasa.gov...
Yes, but it's cold outside so science is wrong.
I mean the logic is irrefutable.
a reply to: Hazardous1408
Nasa site that you linked is where the politically motivated hit pieces come out. Just like NOAA has a site similar to that. Both sites are politically motivated and I hope the Trump Admin takes note of this soon and defunds them.
Not enough historic data to tell us what the temperature was in the 1930's globally.
There is no definitive evidence that the oceans as a whole are acidifying due to atmospheric C02.
wattsupwiththat.com...
How NOAA and Bad Modeling Invented an “Ocean Acidification” Icon: Part 1 – Sea Butterflies
Guest Blogger / March 1, 2017
Guest essay by Jim Steele
Director emeritus Sierra Nevada Field Campus, San Francisco State University and author of Landscapes & Cycles: An Environmentalist’s Journey to Climate Skepticism
If you google “ocean acidification,” the first 3 websites presented according to “Google’s truth rankings” are: 1) Wikipedia, 2) NOAA’s PMEL site featuring the graphic cartoon shown below with a dissolving pteropod shell (a sea butterfly) as the icon of ocean acidification, and 3) the Smithsonian’s Ocean Portal site similarly featuring a dissolving sea butterfly shell. However NOAA’s illustration incorrectly implies shells are dissolving near the surface due to invading anthropogenic atmospheric CO2. As will be shown, the depiction would be far more accurate if it was turned upside down, so that the downward arrows point upwards to illustrate shell dissolution happens when old carbon stored at depth is upwelled to the surface.
a reply to: EvidenceNibbler
You can also find scientists with all kinds of weird ideas about the nature of things. Just because one says so doesn't make it true. Climate doesn't equal weather and we are talking the overall rising temperature, global in a year, melting ice, sealevel changes, weather phenomena like Hurricanes, El Nino, etc the hole system, because the warmer the more water is in the system, heavier rain, effects of changes in the climate system. That's happening and one can make an educated guesstimate which might be right.
You are the problem if you think everything you hear just because it has science on it, is dogma. Might be right with a chance of 80% perhaps. Meteorologist even tell you there is a x% chance of rain today. The same is true with climate, you feed all the data you can get into a simulation and see what you can get.
edit on 29-12-2017 by Peeple because: Opposite
originally posted by: Hazardous1408
a reply to: EvidenceNibbler
Like I said...
You believe NASA when it suits you.
How surprising.
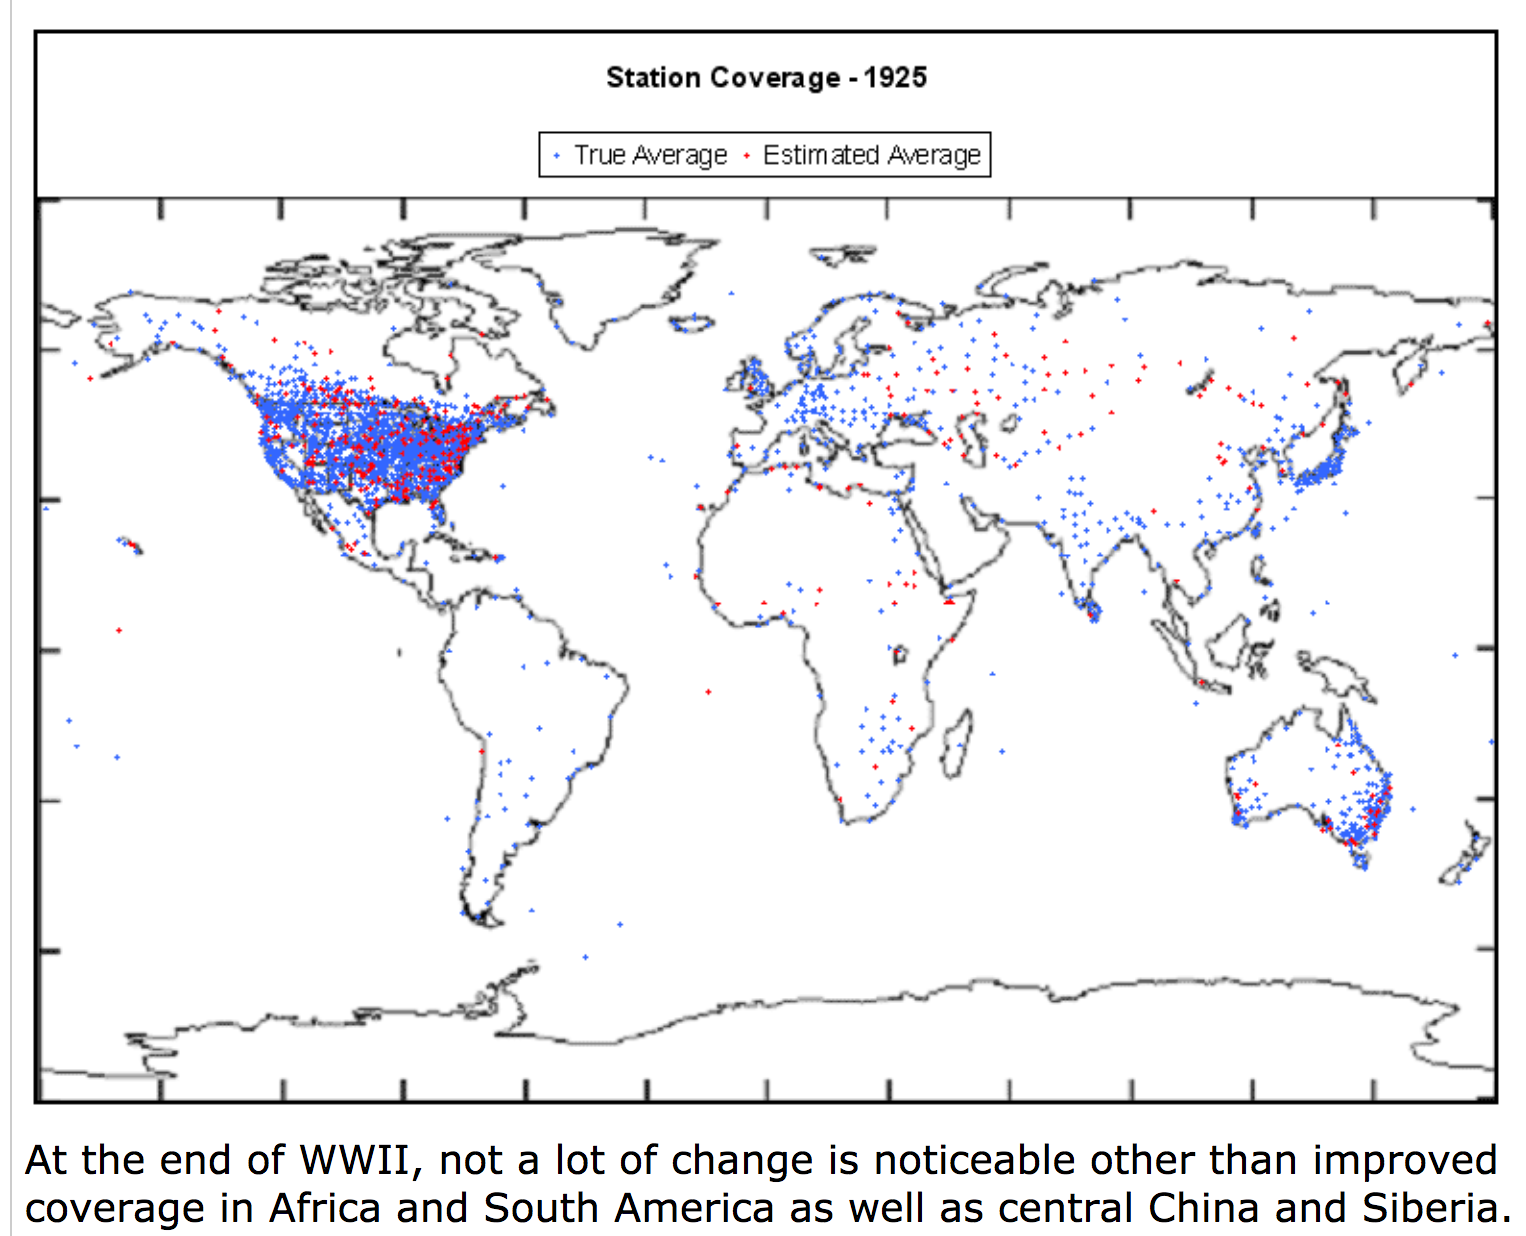
As I have indicated with evidence, there were just not enough climate monitoring stations in the 1930's to even begin to figure out the global temperature.
Do you find you have sources that are always to be believed, even if it flies in the face of logic? If so, please share, I'd love to find a source that I could agree with 100 percent of the time. NASA has been running opinion pieces for over a decade now, parroting the IPCC's position on Global Warming. I am not obligated to agree with everything they put out just because I use some of their satellite data sets that are reliable.
edit
on 29-12-2017 by EvidenceNibbler because: (no reason given)
edit on 29-12-2017 by EvidenceNibbler because: (no reason given)
a reply to: dfnj2015
The belief that less than 200 years of comprehensive data will provide meaningful insight into the long term forecast of temperature related phenomena for a testbed the size of a planet that is almost 4 billions years old and receives most of it's energy from a burning ball of hydrogen helium fusion on a scale several million magnitudes above the meager combustion conversions created by a group of creatures on said planet, is not just absurd. It takes a completely naive and ignorant viewpoint to accept as hard fact.
Saving that, intelligent people can make bad decisions based on faulty assumptions.
IE: A+ ranked mortgage loan investments with the 680 billion dollar Lehman Brother's bank. (That's too much money to only come from stupid people.)
a reply to: EvidenceNibbler
Where talking over a three degree increase in global temperature. The 35 year increase is great for now problem is if it keeps going up.It has beencalculated that a one-degree increase would eliminate fresh water from a third of the world’s land surface by 2100. Turning what is now habitable in to the Saharra dessert. Even things like the Nile would stop flowing. The American bread basket would turn into the dust bowl from the 1930s. Climate change will likely increase the risk of drought in some areas and the risk of extreme precipitation and flooding in others.
Where talking over a three degree increase in global temperature. The 35 year increase is great for now problem is if it keeps going up.It has beencalculated that a one-degree increase would eliminate fresh water from a third of the world’s land surface by 2100. Turning what is now habitable in to the Saharra dessert. Even things like the Nile would stop flowing. The American bread basket would turn into the dust bowl from the 1930s. Climate change will likely increase the risk of drought in some areas and the risk of extreme precipitation and flooding in others.
originally posted by: testingtesting
a reply to: EvidenceNibbler
You use a blog site for evidence?.
Whats your problem with that? Do you think the MSM will run pieces like that? I guess people like you that don't look anywhere but the MSM will be the last to wake up to the Great Green Swindle.
a reply to: EvidenceNibbler
In regards to oceans acidification, that's happening that's measurable the PH level in the ocean is rising because of absorbed carbon dioxide.
It's a shame we don't have more data, I guess it's what was in the libraries, observations of the world and stars. You know Alexandrian library and stuff. The height of science at this time. Imagine where we could be if all that would have been continously developed since the antics.
But we defined to first burn coal, then burn oil, the motors of our world are all literally exhausting the planet we live on. All the conflicts we see are deep down conflict because of ressources. And all that heavy machinery burns also literally a lot oil energy. Tanks, those crazy planes, rockets, drones, ... it's no coincidence that's what's going to happen oil products for rockets and batteries for the masses. That's a limited amount to rely on, you have to start to rationate it at some point.
SpaceX anyone? I like Musk but sometimes he reminds me of an evil villain with a white cat and a witch laugh.
....anyhoo sealevels are rising oceans acidifying...
originally posted by: dragonridr
a reply to: EvidenceNibbler
The 35 year increase is great for now problem is if it keeps going up.It has beencalculated that a one-degree increase would eliminate fresh water from a third of the world’s land surface by 2100.
Source?
Source?
Turning what is now habitable in to the Saharra dessert. Even things like the Nile would stop flowing.
What caused the great droughts on the prairies in the past? Not just the 1930's, but all the other? Were the indians driving SUV's?
The American bread basket would turn into the dust bowl from the 1930s.
a reply to: Archivalist
Hey, you... do you want to know when that extremely wordy and commaless gobbledygook would be relevant...
When you debate someone who doesn’t believe the Sun also plays a role.
You should bear that in mind.
The belief that less than 200 years of comprehensive data will provide meaningful insight into the long term forecast of temperature related phenomena for a testbed the size of a planet that is almost 4 billions years old and receives most of it's energy from a burning ball of hydrogen helium fusion on a scale several million magnitudes above the meager combustion conversions created by a group of creatures on said planet, is not just absurd. It takes a completely naive and ignorant viewpoint to accept as hard fact.
Hey, you... do you want to know when that extremely wordy and commaless gobbledygook would be relevant...
When you debate someone who doesn’t believe the Sun also plays a role.
You should bear that in mind.
originally posted by: Peeple
a reply to: EvidenceNibbler
....anyhoo sealevels are rising oceans acidifying...
Oceans aren't rising any faster now than they were 100 years ago if you use the actual tidal gage data, and not a flawed dataset interpreted by the University of Colorado. Even if you do use the flawed data set, you have to recognize it's measuring GMSL, not RSL. Even the University of Colorado admits there can be no correlation made between the two.
new topics
-
Biden--My Uncle Was Eaten By Cannibals
US Political Madness: 54 minutes ago -
"We're All Hamas" Heard at Columbia University Protests
Social Issues and Civil Unrest: 55 minutes ago -
The good, the Bad and the Ugly!
Diseases and Pandemics: 2 hours ago -
Russian intelligence officer: explosions at defense factories in the USA and Wales may be sabotage
Weaponry: 5 hours ago -
African "Newcomers" Tell NYC They Don't Like the Free Food or Shelter They've Been Given
Social Issues and Civil Unrest: 6 hours ago -
Russia Flooding
Other Current Events: 7 hours ago -
MULTIPLE SKYMASTER MESSAGES GOING OUT
World War Three: 7 hours ago -
Two Serious Crimes Committed by President JOE BIDEN that are Easy to Impeach Him For.
US Political Madness: 8 hours ago -
911 emergency lines are DOWN across multiple states
Breaking Alternative News: 8 hours ago -
Former NYT Reporter Attacks Scientists For Misleading Him Over COVID Lab-Leak Theory
Education and Media: 11 hours ago
top topics
-
Go Woke, Go Broke--Forbes Confirms Disney Has Lost Money On Star Wars
Movies: 15 hours ago, 13 flags -
Pro Hamas protesters at Columbia claim hit with chemical spray
World War Three: 11 hours ago, 11 flags -
Elites disapearing
Political Conspiracies: 13 hours ago, 9 flags -
African "Newcomers" Tell NYC They Don't Like the Free Food or Shelter They've Been Given
Social Issues and Civil Unrest: 6 hours ago, 8 flags -
Freddie Mercury
Paranormal Studies: 16 hours ago, 7 flags -
Two Serious Crimes Committed by President JOE BIDEN that are Easy to Impeach Him For.
US Political Madness: 8 hours ago, 6 flags -
911 emergency lines are DOWN across multiple states
Breaking Alternative News: 8 hours ago, 6 flags -
Biden--My Uncle Was Eaten By Cannibals
US Political Madness: 54 minutes ago, 6 flags -
A Personal Cigar UFO/UAP Video footage I have held onto and will release it here and now.
Aliens and UFOs: 13 hours ago, 5 flags -
Former NYT Reporter Attacks Scientists For Misleading Him Over COVID Lab-Leak Theory
Education and Media: 11 hours ago, 4 flags
active topics
-
The good, the Bad and the Ugly!
Diseases and Pandemics • 1 • : TheSingleBillie -
Russian intelligence officer: explosions at defense factories in the USA and Wales may be sabotage
Weaponry • 116 • : RussianTroll -
Canadian Forces bow out and loose interest in UFO’s
Aliens and UFOs • 16 • : baablacksheep1 -
Biden--My Uncle Was Eaten By Cannibals
US Political Madness • 13 • : CarlLaFong -
A Personal Cigar UFO/UAP Video footage I have held onto and will release it here and now.
Aliens and UFOs • 12 • : baablacksheep1 -
"We're All Hamas" Heard at Columbia University Protests
Social Issues and Civil Unrest • 3 • : FlyersFan -
911 emergency lines are DOWN across multiple states
Breaking Alternative News • 1 • : xuenchen -
Marjorie Taylor Greene Files Motion to Vacate Speaker Mike Johnson
US Political Madness • 57 • : Threadbarer -
African "Newcomers" Tell NYC They Don't Like the Free Food or Shelter They've Been Given
Social Issues and Civil Unrest • 10 • : marg6043 -
Joe Biden and Donald Trump are both traitors
2024 Elections • 62 • : Xtrozero