It looks like you're using an Ad Blocker.
Please white-list or disable AboveTopSecret.com in your ad-blocking tool.
Thank you.
Some features of ATS will be disabled while you continue to use an ad-blocker.

Times LDEO collapse seismogram of WTC-7, compared to the by NIST time-stamped Cianca 9/11 photo
page: 27share:
a reply to: LaBTop
Ever going to directly answer the simple question?
For your supposed seismic spike. What relationship between P waves, S waves, and Rayleigh waves proves beyond a doubt the seismic activity was exclusive to the detonation of a charge setting off 26 miles away?
Ever going to directly answer the simple question?
For your supposed seismic spike. What relationship between P waves, S waves, and Rayleigh waves proves beyond a doubt the seismic activity was exclusive to the detonation of a charge setting off 26 miles away?
And don't forget that NIST proposed as the initiation event of the WTC-7 collapse, in their final, one time revised, WTC-7 collapse report, the
progressive failure of ONE eastern vertical column number 75, over the height of 8 floors! Based on what.? There was no WTC-7 steel saved AT ALL, and
their bogus computer simulation data is declared secret.
Yep, very suspicious indeed, on top of their sudden scrubbing of all their seismic data after being informed about my discovered time stamps discrepancies.
So ask yourself another logical question :
Why are the second group of seismic amplitude signals at the end of that WTC-7 collapse seismogram, which indicate the global collapse of ALL the vertical AND horizontal steel in that 47 stories high WTC-7 building, a lot smaller in amplitude, thus indicating a lot less total seismic energy released to the underlying bedrock during the failure of all that massive steel, than for NIST their proposed initiation event of the failure of just ONE damn steel column over a height of 8 floors maximum.?
While the start of that second group of seismic amplitude signals thus indicate the total failure of not ONE, but ALL vertical and horizontal steel columns and beams in that WTC-7 building. Think about that for one short minute. All the vertical core and exterior steel columns, all together over 8 floors high at global collapse onset. Followed after 2.25 seconds free fall acceleration, by the rest of all its floors their total vertical and horizontal steel amount.
However, there's no sign of seismic signals that are at least as high as the first group of peaks, the ones from that first event (NIST its presumed, ONE column failure.? ).
The second group of seismic signals is however substantially SMALLER in amplitude than the first group.
And surely not the logically to be expected, massive seismic energy, expressed in a group of at least just as high in magnitude, seismic signals, as the first group, that is preceding that global collapse, showing the global collapse of a 47 stories high, steel building.
And don't you ever forget, that there was a 2.25 seconds period of proven FREE FALL ACCELERATION at the onset of that global collapse, which, according to what NIST's director, Shyam Sunder, said at his questions and answers meeting, while defending his final WTC-7 Report misinformation piece, when confronted by David Chandler with the solid and quite simple evidence for that free fall period :
"Such a free fall period as calculated by you, would indicate no resistance at all inside that 32 meter high part of the building."
For a height of 32 meters, over 8 floors spaces high, NO resistance present....at all.!
Do now read at last Dr. Rousseau's full seismic publication text, which is to my knowledge, never refuted by his academic peers. Nobody wants to touch it, they are too fond of their well paid niche in Academia while they are not yet pensioned.
By the way, all your later posted seismic questions are firmly answered in his online seismic study of the Twin Towers and WTC-7 collapses.
He explains that also the Twin Towers were brought down by explosions. And gives the reasons WHY he thinks so, after he studied and interpreted the few, officially released to the public, seismograms provided by LDEO.
a reply to: LaBTop
Ever going to directly answer the simple question?
For your supposed seismic spike. What relationship between P waves, S waves, and Rayleigh waves proves beyond a doubt the seismic activity was exclusive to the detonation of a charge setting off 26 miles away?
It's ok to say all seismic data can be explained by a building collapse or the quarry that continued operating on September 11.
REFERENCES :
This same, full thread, started by me : Times LDEO collapse seismogram of WTC-7, compared to the by NIST time-stamped Cianca 9/11 photo :
www.abovetopsecret.com...
This thread its opening post by me : WTC-7 Mysteries FINALLY Solved :
www.abovetopsecret.com...
This post in that above thread, with a few important links in there:
www.abovetopsecret.com...
652 Experts Reject Fire as Cause for 9/11 WTC Collapses. Written by Andrew Krieg.
Dr. Andre Rousseau's 9/11 WTC seismic study. Read at least his ABSTRACT text.
Gordon Ross : How the Towers were Demolished (2007) .
MacQueen, Graeme (2009). "Did the Earth Shake Before The South Tower Hit the
Ground?" Journal of 9/11 Studies, July 9, 2009.
Major_Tom, Nov. 2015. Author's Conclusions. Excellent site.
The Nov. 20, 2001 LDEO publication by Kim et al, with their seismograms and their explanation for them at that time. Title : "Seismic Waves Generated by Aircraft Impacts and Building Collapses at World Trade Center, New York City."
See page 4 of 9 for the 1993 bombing that did not register at LDEO.
A Morning That Shook the World: The Seismology of 9/11.
Some interesting seismological research into increasing accuracy and resolution of seismic signals, and its interpretation, with the latest techniques :
Seismic Time–Frequency Analysis via Empirical Wavelet Transform.
Applications of variational mode decomposition in seismic time-frequency analysis.
Appl ication of bi-Gaussian S-transform in high-resolution seismic time-frequency analysis.
Improving the S-transform for high-resolution reservoir prediction and paleochannels delineation.
I wish you all a thoughtful 2017 :
In rare and risk-full economical circumstances, when the majority of the low and middle paid working class citizens, in the end, still bear all the costs of corporate mistakes, the stimulation for capital risking individuals or parties to think about, and create honestly shared working incomes between investor or bank, and blue and white collar workers, normally massively favors self-delusion.
A system that socializes all losses, and privatizes all exorbitant gains, is inadvertently doomed to mis-manage the inherent RISKS.
We are entering dangerous times, once again.
Nevertheless, we are a daring Flock, so I still wish you all a HAPPY and PROSPEROUS 2017, adversaries and same-souls alike.!
a reply to: LaBTop
So you cannot state the type of waves generated by your supposed seismic spike. The difference in time between the waves. The difference or corresponding relationship of wave amplitudes among the wave types. Then cannot use the relationships to point to seismic activity exclusive to a detonating charge 26 miles away?
Ever going to directly answer the simple question?
For your supposed seismic spike. What relationship between P waves, S waves, and Rayleigh waves proves beyond a doubt the seismic activity was exclusive to the detonation of a charge setting off 26 miles away?
It's ok to say all seismic data can be explained by a building collapse or the quarry that continued operating on September 11.
Now we know way Gauge, Jones, Hulsey, and Szamboti don't embrace seismic activity.
No, now we know that you're not a champion in formulating precise questions, it takes multiple post for you, to even come near to a coherent question
asked.
Now I think I remember, you. You are that same guy that got me banned from posting for three days by some diligent moderator, when I asked you politely and caring, if you had a certain well known disability. I think that moderator thought I used that Latin word, to call you names.
I certainly don't ask you again, and really, I don't care anymore.
Why do you keep blabbering about one seismic spike, for gods sake.? And why is your English so damn chaotic that I can't make head nor tail of it.
We are dealing with many seismic "spikes", in fact they are called seismic wave amplitudes, as you seem to know very well.
I already gave you excerpts from the Rousseau paper at that time, so I start to suspect you have an agenda.
But since the new year is near, here it is again, let's have some fun together :
First read this 2005 post its links :
www.abovetopsecret.com...
www.ldeo.columbia.edu...
Max amplitudes recorded for the Twin Towers :
1st Impact WTC-N1 : 288 nm/s ; 2nd Impact WTC-2S : 206 nm/s.
1st collapse WTC-2S : 4,204 nm/s ; 2nd collapse WTC-1N : 5,777 nm/s.
The magnitude of seismic waves from the WTC-1N collapse was f.ex. only 2.3.
Their predominant signals recorded at distances >200 km are short-period surface waves, which propagate at wave speeds of about 3.5 km/s, the typical Lg group velocity observed for the largest waves from earthquakes at regional distances in eastern North America.
You keep asking in a somewhat strange formulation for waveform propagation speeds, if I understand you right, and I steered you already multiple times to Dr. Andre Rousseau´s paper.
But you seem to be, for some mysterious reason, very reluctant or can not understand Dr. Andre Rousseau his paper. Thus, here is an applicable excerpt, which I btw already once in this or the other recent thread have provided to you or a clone of you :
Is this what you were asking for ? Or do I still not understand what the hell you are talking about.?
Now I think I remember, you. You are that same guy that got me banned from posting for three days by some diligent moderator, when I asked you politely and caring, if you had a certain well known disability. I think that moderator thought I used that Latin word, to call you names.
I certainly don't ask you again, and really, I don't care anymore.
Why do you keep blabbering about one seismic spike, for gods sake.? And why is your English so damn chaotic that I can't make head nor tail of it.
We are dealing with many seismic "spikes", in fact they are called seismic wave amplitudes, as you seem to know very well.
I already gave you excerpts from the Rousseau paper at that time, so I start to suspect you have an agenda.
But since the new year is near, here it is again, let's have some fun together :
First read this 2005 post its links :
www.abovetopsecret.com...
www.ldeo.columbia.edu...
Max amplitudes recorded for the Twin Towers :
1st Impact WTC-N1 : 288 nm/s ; 2nd Impact WTC-2S : 206 nm/s.
1st collapse WTC-2S : 4,204 nm/s ; 2nd collapse WTC-1N : 5,777 nm/s.
The magnitude of seismic waves from the WTC-1N collapse was f.ex. only 2.3.
Their predominant signals recorded at distances >200 km are short-period surface waves, which propagate at wave speeds of about 3.5 km/s, the typical Lg group velocity observed for the largest waves from earthquakes at regional distances in eastern North America.
You keep asking in a somewhat strange formulation for waveform propagation speeds, if I understand you right, and I steered you already multiple times to Dr. Andre Rousseau´s paper.
But you seem to be, for some mysterious reason, very reluctant or can not understand Dr. Andre Rousseau his paper. Thus, here is an applicable excerpt, which I btw already once in this or the other recent thread have provided to you or a clone of you :
Waveforms Attributed to the Planes Crashing Into the Towers.
The waveforms that the LDEO team attributes to the impacts of the airliners into the Twin Towers are shown in figures 1a and 1b. Although the waveforms look somewhat similar, they are sufficiently different to raise questions about LDEO's analysis. Although the cause of the two signals is similar -- the crashing of a plane, according to LDEO -- the magnitude (reflected by the amplitudes, or distribution on the vertical axis) of the two signals is different. Further, the waves generated by the two events do not have the same apparent velocity. The calculation of the propagation speeds, derived from the times measured in the graphs of Figures 1a and 1b between the origins fixed according to the corresponding crashes and the first wave arrivals –
namely, respectively 11.7 and 15.8 seconds - indicates roughly 2900 m/s for WTC1 and 2150 m/s for WTC2.
A more serious difficulty with LDEO's attribution of the waveforms to plane impacts at the Twin Towers is that even if the impacts had been considerably more energetic, these signals could not have been generated by such impacts.
The actual waves generated by the crashes had to have been deadened in the long stretches of steel before hitting the ground. Frequencies of waves generated by explosions are on the order of 1 Hertz (1 Hz, or one cycle per second) -- which is the case with the Rayleigh waves shown in figures 1a and 1b -- while those of crash impacts are above 10 Hz and are often around 100 Hz.
Furthermore, the range of the recording instruments (0.6 - 5 Hz) cited does not allow for the recording of the high-frequency waves that would be created by plane impacts. As to the theory of the oscillation of the Towers to explain these signals, as defended by Irvine (2001), it is inadequate because in such a case we would have had a "square" signal of long duration and a constant amplitude, while in actuality we observe a "bell-like" signal, representing a strong and brief explosion, which is particularly evident in the case of WTC2.
Given that it is geophysically impossible to have two different propagation speeds for two waves of the same type at the same frequency travelling the same path only a few minutes apart, one must bow to the evidence that the supposed origins of the recorded waves are incorrect, and that they are not linked to the plane crashes but to another origin.
The waveform data, far from suggesting the conclusion of LDEO that they were caused by plane impacts into the Towers, suggest instead two explosions with different time displacements from the moments of plane impact at each building. Further, the difference in the magnitude of the two signals can only be linked to differences in the volume of explosives and/or their distance from the surface.
Waveforms Attributed to the Collapse of the Towers.
While the Twin Towers had approximately the same mass, the same height and size, and the same type of internal structure (as well as essentially identical points of origin of the seismic wave-data in terms of distance to the recording station), the signals attributed to the collapses of WTC1 and WTC2, instead of being similar as one would suppose from the official thesis, are in fact very different. They differ in their form, their composition, and especially in their apparent propagation speed, as calculated from the official origin time.
In fact, the recording for WTC1 (Fig. 2a) demonstrates the three types of wave characteristic of a brief explosive source confined in a compact, solid material: a P wave with a speed of 6000 m/s, the typical value for a very consolidated crystalline or sedimentary terrain (which is the case in the bedrock of Manhattan), an S wave with a speed of 3500 m/s, and a surface wave with a speed of 1800 m/s (a Rayleigh wave).
These values match those registered from an earthquake or seismic prospecting (see for
example Kim et al. 2001). On the other hand, the recording linked to WTC2 (Fig. 2b) does not show the P or S body waves observed for WTC1 but only the surface Rayleigh wave, for which the spreading of the amplitudes over the duration is different from that of WTC1.
The propagation speed of 2125 m/s is also markedly different from that of WTC1. Further, this wave seems to be followed by a second Rayleigh wave four seconds later.
We find the same thing for WTC7 (Fig. 2c), where the calculation of the speed of the wave according to the determined origin time indicates a Rayleigh wave with a 2200 m/s speed.
Note that the amplitudes are comparable to those of the waves emitted at the time of the crashing of the airplanes into the Towers. This wave seems to be followed by a second Rayleigh wave 6 or 7 seconds later.
In the three cases, the bell-like form points to an impulsive source of energy, not percussion on the ground due to the fall of debris. The total mass and the average mass of individual building fragments were relatively small and fell to the ground over a period of more than ten seconds (which is a very long time in geophysics). Also note that the duration of a seismic signal does not tell anything about the source, in distinction from the amplitude and, particularly, the frequency.
Is this what you were asking for ? Or do I still not understand what the hell you are talking about.?
a reply to: LaBTop
LDEO has collected data on seismic activity due to mine blasting for the region? Is that wrong?
Seismic activity due to mine blasting is not always a text book relationship of P waves, S waves, L waves, S waves, and Rayleigh waves. Regional ground composition and distribution of water sources play a key role in how waves are passed and recorded as seismic activity at fixed stations. Is that wrong?
If acoustic / seismic relationships is captured, even better proof of seismic activity from a blast.
Seismologists cannot, as a rule, usually tell a mine blast is a mine blast just from seismic data. They use mine / quarry location and blasting schedules compared to seismic activity to set a base line how p, s, l, Rayleigh waves relate to each other to distinguish blasting activity from earthquakes. Is that wrong?
The problem? Where does your good Dr. include the known base line relationships of P, L, S, Rayleigh waves for mine blasting for the region? Without comparing the known and expected seismic wave amplitudes and relationships for the region to the LDEO captured P, L, S, Rayleigh waves, or not having a seismic to acoustic relationship, there is no proof the supposed seismic spike was exclusive to a charge setting off. And no proof to discount the seismic activity is adequately explained by building collapse.
Also, the Dr could have compared his seismic data to know cases of CD. Other know cases of building collapse?
Understand why there is not conclusive seismic evidence and why it's mostly ignored!
LDEO has collected data on seismic activity due to mine blasting for the region? Is that wrong?
Seismic activity due to mine blasting is not always a text book relationship of P waves, S waves, L waves, S waves, and Rayleigh waves. Regional ground composition and distribution of water sources play a key role in how waves are passed and recorded as seismic activity at fixed stations. Is that wrong?
If acoustic / seismic relationships is captured, even better proof of seismic activity from a blast.
Broadband seismic and acoustic signals will permit the most robust event identification.
Note: see quoted section below for source.
Seismologists cannot, as a rule, usually tell a mine blast is a mine blast just from seismic data. They use mine / quarry location and blasting schedules compared to seismic activity to set a base line how p, s, l, Rayleigh waves relate to each other to distinguish blasting activity from earthquakes. Is that wrong?
onlinelibrary.wiley.com...;jsessionid=DFF495C4025331585A8A72BC278FE92E.f04t02?v=1&t=ixa56v1h&s=f31a2c e04163b3810fb6204cf18d380631b81919
Title: CHARACTERIZATION OF MINING EXPLOSIONS AT REGIONAL DISTANCES: IMPLICATIONS WITH
THE INTERNATIONAL MONITORING SYSTEM
[63] Minin gexplosions are sources of seismic and acoustic energy that are readily observable at regional distances. There is evidence that these events will be primarily constrained to known active areas of mining. The magnitudes of these events will occasionally exceed magnitude 4 with the vast majority of events below this magnitude.
[64] Broadband seismic and acoustic signals will permit the most robust event identification. A number of different identification tools have been described that take advantage of information in a variety of frequency bands. For example, the ratio of high-frequency P energy to intermediate- and low-frequency surface waves ap- pears to identify large surface cast blasts. High-fre- quency spectral peaks indicative of delay firing are found to occur under some blasting conditions. Where these high-frequency spectral peaks do not exist, low-fre- quency spectral modulations associated with source fi- niteness can be useful. The success of discriminants depends on the interplay between the blasting practices in the mines and the regional wave propagation charac- teristics. Each region will require a tailored suite of discriminants and regional propagation path correction. By chance, or by design, some regions will be monitored at near-regional range and will need a suite of identifi- cation tools that include techniques that take full advan- tage of broadband data.
The problem? Where does your good Dr. include the known base line relationships of P, L, S, Rayleigh waves for mine blasting for the region? Without comparing the known and expected seismic wave amplitudes and relationships for the region to the LDEO captured P, L, S, Rayleigh waves, or not having a seismic to acoustic relationship, there is no proof the supposed seismic spike was exclusive to a charge setting off. And no proof to discount the seismic activity is adequately explained by building collapse.
Also, the Dr could have compared his seismic data to know cases of CD. Other know cases of building collapse?
Understand why there is not conclusive seismic evidence and why it's mostly ignored!
edit on 29-12-2016 by neutronflux because: Fixed finger fumbles
Neutronflux :
[1] LDEO has collected data on seismic activity due to mine blasting for the region? Is that wrong?
[2] Seismic activity due to mine blasting is not always a text book relationship of P waves, S waves, L waves, S waves, and Rayleigh waves. Regional ground composition and distribution of water sources play a key role in how waves are passed and recorded as seismic activity at fixed stations. Is that wrong?
[3]If acoustic / seismic relationships is captured, even better proof of seismic activity from a blast.
[4] Seismologists cannot, as a rule, usually tell a mine blast is a mine blast just from seismic data. They use mine / quarry location and blasting schedules compared to seismic activity to set a base line how p, s, l, Rayleigh waves relate to each other to distinguish blasting activity from earthquakes. Is that wrong?
[5] The problem? Where does your good Dr. include the known base line relationships of P, L, S, Rayleigh waves for mine blasting for the region? Without comparing the known and expected seismic wave amplitudes and relationships for the region to the LDEO captured P, L, S, Rayleigh waves, or not having a seismic to acoustic relationship, there is no proof the supposed seismic spike was exclusive to a charge setting off. And no proof to discount the seismic activity is adequately explained by building collapse.
[6] Also, the Dr could have compared his seismic data to known cases of CD. Other known cases of building collapse?
[7] Understand why there is not conclusive seismic evidence and why it's mostly ignored!
See now, my following answers.
LaBTop's answers :
Your questions [1] and [2] : Correct ;
Btw, not at all important to my thesis.
[3] 34 Km is too far away to had even a shimmer of a chance for LDEO, to pick up aerial pressure waves, a.k.a. sound waves from the Manhattan 9/11 events.
But I provided an abundance of OFFICIALLY endorsed (in the 9/11 US administration repository) videos with audio recordings of blasts in them, in both recent threads of mine.
Btw, not at all important to my thesis.
[4] Correct.
And read this excerpt from Dr. Kim, to ask yourself why LDEO, and Dr. Kim especially, did not include this last excerpted, and bolded by me, snippet in their 2001, 2005 and 2006 papers :
Source, click HERE.
[From : A Morning That Shook the World: The Seismology of 9/11
Posted by Kevin Krajick of Columbia University’s Earth Institute on September 9, 2016.]
So only now, in September 2016, 15 years later, Dr. Kim suddenly comes up with that quarry blasts explanation for his remarks on his original November 2001 paper diagram, where he named them "further collapses". Not such a clever researcher, seems so. He needs 15 years and some help of course, to retract those original remarks. Do you really believe he didn't check those quarries time tables in the 2 months after 9/11/2001.?
I don't. You do not become a renown seismologist by bypassing that kind of fatal information for your reputation
Btw, not at all important to my thesis.
[5] Dr. Rousseau does, I'll excerpt it in a later post by me.
Btw, not at all important to my thesis.
[6] Contradicted by your own questions [2] and [4]. Thus : Redundant question.
Btw, not at all important to my thesis.
Regarding [7] : Utterly wrong.!
You still don't understand, or do not want to understand.
The moment you do, you will be FREE.
Since at that instance, your whole artificially upheld personal safety-net will melt down, and at last you will be a Reborn person, who doesn't trust any authority anymore on good faith.
Your questions [1] and [2] : Correct ;
Btw, not at all important to my thesis.
[3] 34 Km is too far away to had even a shimmer of a chance for LDEO, to pick up aerial pressure waves, a.k.a. sound waves from the Manhattan 9/11 events.
But I provided an abundance of OFFICIALLY endorsed (in the 9/11 US administration repository) videos with audio recordings of blasts in them, in both recent threads of mine.
Btw, not at all important to my thesis.
[4] Correct.
And read this excerpt from Dr. Kim, to ask yourself why LDEO, and Dr. Kim especially, did not include this last excerpted, and bolded by me, snippet in their 2001, 2005 and 2006 papers :
Source, click HERE.
--snip--
“I thought, yes, maybe there is a seismic signal,” said Kim. “Maybe we have data to contribute. Maybe we can assist and help pin things down.”
Kim and his colleagues soon came up with precise seismic signatures of the plane impacts and building collapses that had been observed by so many eyewitnesses. The analyses helped investigators confidently interpret many details of the attacks and their consequences. They led to corrections in the reported timing of events and fed into the final narrative of the U.S. 9-11 Commission. An image of one of their seismograms is enshrined at Ground Zero in the September 11 Museum.
--snip--
Over succeeding weeks, Kim and his colleagues worked with federal investigators, the New York Fire Department, the Port Authority and others to provide seismic records that could be combined with photos, videos and eyewitness reports. Their first product, coauthored by 12 Lamont seismologists and grad students, was a November 2001 paper published by the American Geophysical Union describing the waves generated by the attacks, their potential effects, and the precise timing of each event.
The seismologists determined that the planes hit the towers at 8:46:26 and 9:02:54, give or take a few seconds. Their calculated time for the first strike was about 2 minutes earlier than had been reported by media. To make the calculation, they had to account for the 17-some seconds it would have taken for the waves to travel from the shocked towers down through their foundations and then outward through complexes of shallow crustal rocks. First, the hard schist and amphibolite of lower Manhattan; then the gneisses of upper Manhattan; on to the sandstones and shales underlying the Hudson River; and finally up through the great sill of volcanic rock that forms the towering Palisades on the river’s west bank, where Lamont sits. Much of the energy also traveled through the river itself.
The jet strikes generated seismic waves comparable to small earthquakes of magnitudes 0.9 and 0.7 respectively—probably only a small part of the total energy of the collisions. Kim believes most of it was released in fireballs and airborne shock waves. This helped explain my wife’s testimony: Intervening buildings largely blocked the waves (and her view) of the first, which she felt only weakly. For the second, she was in a direct line. The seismic waves looked quite unlike those of natural earthquakes, which originate under the surface, said Kim. These had started from above. “More like ringing a bell,” he said.
According to the seismic signals, the collapse of the south tower came at 9:59:04 and that of the north tower at 10:28:31. Some federal investigators put the times about 10 seconds earlier, but they apparently measured from when the buildings began pancaking from the top; the seismologists pinpointed when they hit bottom.
[LT : Now here they go into fairy land : if there was pancaking, then there also was a drop-hammer effect as from a pile-driving scow, and when you ever stood near a building preparation job, you have felt the immense earth tremors when that block came down on top of the wooden or concrete pile. And that's only 500 kg, half a ton.... And those sound signals travel at 5000+ m/s through steel until they hit bedrock. 47 + 246 inner and outer vertical columns that break floor by floor, do give off a very distinct seismic signal.]
The first collapse, of the south tower, generated seismic waves comparable to a magnitude 2.1 earthquake. The fall of the north tower, a half-hour later, generated the most powerful wave—corresponding to a magnitude 2.3 earthquake. This was recorded by 13 seismic stations in five states, including one at Lisbon, N.H., 266 miles away. Again, Kim calculated that most of the energy did not reach the ground as seismic waves; it was mainly used up converting steel, concrete—and human beings—to dust. He said the event greatly resembled the energy released by a pyroclastic flow, a lethal explosion of hot gases and debris running down the slopes of an exploding volcano.
--snip--
Seismogram of the crash of United Air 93 in Shanksville, with 3 components shown, BHZ, BHN and BHE.
--snip--
The nearby 7 World Trade Center came down at 5:20:33 pm, and the seismographs picked that up, too. “It was more gradual than the big towers,” said Kim. There was some speculation that this building and others nearby were fatally damaged by the earlier strong ground shaking, but the seismic analyses suggested otherwise. Modern New York structures are built to withstand much stronger natural quakes, up to magnitude 4 or 4.5.
--snip--
Later, when Kim looked back over the New York City data, something popped out that dumbfounded him. Interspersed around the plane impacts and the fall of the towers were five or six smaller seismic signals. At first he thought they were incremental collapses. But he tracked their locations to a line of sites along a formation of hard rock in northern New Jersey. He had seen these before many times: dynamite blasts at rock quarries. “I was very surprised, they were still doing it that day,” he said. “I thought they would have stopped, but they continued.”
--snip-- ..

[From : A Morning That Shook the World: The Seismology of 9/11
Posted by Kevin Krajick of Columbia University’s Earth Institute on September 9, 2016.]
So only now, in September 2016, 15 years later, Dr. Kim suddenly comes up with that quarry blasts explanation for his remarks on his original November 2001 paper diagram, where he named them "further collapses". Not such a clever researcher, seems so. He needs 15 years and some help of course, to retract those original remarks. Do you really believe he didn't check those quarries time tables in the 2 months after 9/11/2001.?
I don't. You do not become a renown seismologist by bypassing that kind of fatal information for your reputation
Btw, not at all important to my thesis.
[5] Dr. Rousseau does, I'll excerpt it in a later post by me.
Btw, not at all important to my thesis.
[6] Contradicted by your own questions [2] and [4]. Thus : Redundant question.
Btw, not at all important to my thesis.
Regarding [7] : Utterly wrong.!
You still don't understand, or do not want to understand.
The moment you do, you will be FREE.
Since at that instance, your whole artificially upheld personal safety-net will melt down, and at last you will be a Reborn person, who doesn't trust any authority anymore on good faith.
I'll try to keep it short, for once :
[7] : My thesis has NOTHING to do with your precious wave types and all the weight you adhere to them.
It simply shows the willing-to-understand reader, that the comparison of their total energy, between the two seismic energy amplitude peaks groups, written down in the LDEO registered seismogram of the WTC-7 collapse, does not fit at all the explanations of the 9/11 Commission, FEMA, LDEO, and NIST.
When you compare the time scale under the registered two main groups of peaks of amplitudes on that WTC-7 collapse seismogram, with the, never retracted time stamp of 5:20:46 p.m. on the Cianca photo that NIST itself CALCULATED and published ( so, NOT me), any honest observer will have to admit that something stinks to high heaven with the combined explanations by all those precious US Institutes.
That biggest first group of seismic amplitudes begins to be written 11 sec. after 17:20:46, the Cianca photo event with its by NIST approved and calculated time-stamp. It has a duration of 4 sec. and has returned back to baseline 2 sec. before the east-penthouse denting its first visual signal arrives as a seismic signal on that graph.
Since the retention time in the upper N.Y. State's earth crust for Rayleigh surface waves signals from Manhattan to Palisades is a well known 17 sec., you have to add up those 17 sec. to the 17:20:46, time-stamped by NIST, photo of that roof denting, as registered in Manhattan by Nicolas Cianca's digital photo camera. And thus you will end up smack in the middle between the end of the first group of amplitudes, and the onset of the second group, that the start of the global collapse indicates.
SO, ask yourself again : WHAT THE HELL.!!!
WHAT SORT OF HUGE ENERGETIC EVENT DEPICTS THAT FIRST GROUP OF BIGGEST AMPLITUDES.?
If you can come up with any other VALID explanation than EXPLOSION(S), I'm all ears.
Everything that I have shown to you in my latest two threads, and in the last posts, thus only fit the LDEO registered WTC-7 seismogram as a glove, when you are willing to understand this graph with all my remarks on it :
files.abovetopsecret.com...
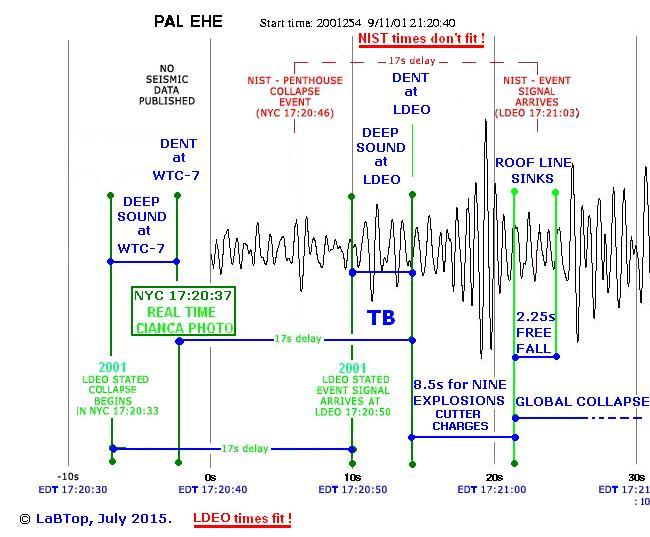
TB = small Thermobaric Bomb.
8.5 Seconds lasting, nine cutter/displacement charges explosions = deducted from the Ashley Banfield video its audio signals.
2.25 Seconds of Free Fall : as you see, that fits perfectly, since then there is no seismic signal attached to such an event, when there is no measurable resistance to be measured in all that steel inside 32 meter of 8 floors high blown up steel.
Guess who gave this explanation : Shyam Sunder, head/director of the NIST WTC-7 research.
Ashley Banfield interviews that lady with the baby on her arm, in the middle of the Greenwich Street crossing with Murray Street, with direct view on the north side of WTC-7, when nine explosions are picked up by the camera's audio system, you see also the whitish smoke cloud, bulk-expanding at the eastern bottom side (left side in the video). At that side was column 75, by the way, that's why NIST came up with their bogus explanation, after they got really desperate after years of trying to come up with a somewhat viable for Johnny Public, explanation.
Read this post of mine to see the You Tube video of Ashley's camera man :
www.abovetopsecret.com...
Original LDEO WTC-7 collapse diagram, without remarks by me :
See next post.
[7] : My thesis has NOTHING to do with your precious wave types and all the weight you adhere to them.
It simply shows the willing-to-understand reader, that the comparison of their total energy, between the two seismic energy amplitude peaks groups, written down in the LDEO registered seismogram of the WTC-7 collapse, does not fit at all the explanations of the 9/11 Commission, FEMA, LDEO, and NIST.
When you compare the time scale under the registered two main groups of peaks of amplitudes on that WTC-7 collapse seismogram, with the, never retracted time stamp of 5:20:46 p.m. on the Cianca photo that NIST itself CALCULATED and published ( so, NOT me), any honest observer will have to admit that something stinks to high heaven with the combined explanations by all those precious US Institutes.
That biggest first group of seismic amplitudes begins to be written 11 sec. after 17:20:46, the Cianca photo event with its by NIST approved and calculated time-stamp. It has a duration of 4 sec. and has returned back to baseline 2 sec. before the east-penthouse denting its first visual signal arrives as a seismic signal on that graph.
Since the retention time in the upper N.Y. State's earth crust for Rayleigh surface waves signals from Manhattan to Palisades is a well known 17 sec., you have to add up those 17 sec. to the 17:20:46, time-stamped by NIST, photo of that roof denting, as registered in Manhattan by Nicolas Cianca's digital photo camera. And thus you will end up smack in the middle between the end of the first group of amplitudes, and the onset of the second group, that the start of the global collapse indicates.
SO, ask yourself again : WHAT THE HELL.!!!
WHAT SORT OF HUGE ENERGETIC EVENT DEPICTS THAT FIRST GROUP OF BIGGEST AMPLITUDES.?
If you can come up with any other VALID explanation than EXPLOSION(S), I'm all ears.
Everything that I have shown to you in my latest two threads, and in the last posts, thus only fit the LDEO registered WTC-7 seismogram as a glove, when you are willing to understand this graph with all my remarks on it :
files.abovetopsecret.com...
TB = small Thermobaric Bomb.
8.5 Seconds lasting, nine cutter/displacement charges explosions = deducted from the Ashley Banfield video its audio signals.
2.25 Seconds of Free Fall : as you see, that fits perfectly, since then there is no seismic signal attached to such an event, when there is no measurable resistance to be measured in all that steel inside 32 meter of 8 floors high blown up steel.
Guess who gave this explanation : Shyam Sunder, head/director of the NIST WTC-7 research.
Ashley Banfield interviews that lady with the baby on her arm, in the middle of the Greenwich Street crossing with Murray Street, with direct view on the north side of WTC-7, when nine explosions are picked up by the camera's audio system, you see also the whitish smoke cloud, bulk-expanding at the eastern bottom side (left side in the video). At that side was column 75, by the way, that's why NIST came up with their bogus explanation, after they got really desperate after years of trying to come up with a somewhat viable for Johnny Public, explanation.
Read this post of mine to see the You Tube video of Ashley's camera man :
www.abovetopsecret.com...
Original LDEO WTC-7 collapse diagram, without remarks by me :
See next post.
edit on 30/12/16 by LaBTop because:
edit on 30/12/16 by LaBTop because: Added expl. for TB, 2.25 s free fall, and the 8.5
seconds of explosions.
edit on 30/12/16 by LaBTop because: (no reason given)
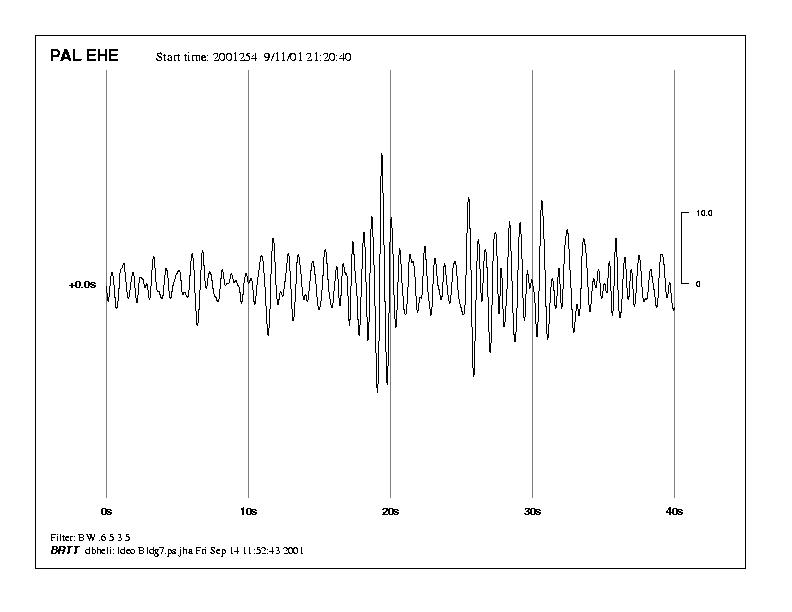
The start time on top of it is given as 21:20:40 (UTC), which is 5:20:40 p.m. in New York local time (EDT).
Thus, the +0.0s first vert. line is the 17:20:40 EDT line.
And 6 seconds later, Nicolas Cianca took this photo, of the dent beginning to form in the east penthouse roof, for which NIST calculated the time stamp on it :
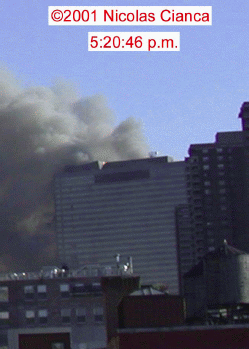
When you go straight down from the 2 and the last 1, on its left top copyright 2001, you end up on top of the dented east penthouse roof, so the photo shows it on its left side.
Place that by Cianca photographed event at the 6 second position on the time scale under that WTC-7 seismogram.
It's vertical line then goes exactly through that first downward greater than background noise signal.
Which small seismic signal was thus 17 seconds earlier made by some small energetic event at the WTC-7 site.
Then 17 seconds later, the Cianca event arrived at the seismograph needle at Palisades, at the 23 second position.
Smack in the middle between the first biggest amplitudes, and the next, smaller amplitudes.
Again : explain that away, if you can.
Simpler than this I can't make it, no complicated science needed, at ALL.
edit on 30/12/16 by LaBTop because: Added all that text.
The Detective Work of Seismologists: Earthquake or Blast?
akafka.wordpress.com...
Rayleigh seismic waves (Rg) ARE shallow depth surface waves.
Of course these 2 papers have little to do with the WTC-7 or WTC-2S and WTC-1N collapses.
Those were NOT earthquakes, but on the surface, building collapses, which send seismic signals into the underlying bedrock.
That second last link from 1990 is probably what you kept asking for, read its Abstract and Introduction (and the rest, esp. page 20-22 -392-394).
I don't think it will help you to bolster your opinions, since it has nothing to do with the heart of my thesis, which is a simple time comparison problem, not to be solved by those US Institutes, as long as they do not start retracting former parts of their published papers.
Which NIST certainly can't do anymore, since their whole video/photo time-stamping re-calculation operation was based on exactly the Cianca camera data....And LDEO can't ever retract their officially published 9/11 seismograms.
They both are set checkmate by me.
By just having enough patience, till NIST had put all its cards on the playing table.
So that's what they and the rest of the 9/11-criminals do now, ignore me and hope I will fade away. No chance.
More seismic education courses :
www2.bc.edu...
akafka.wordpress.com...
These “Rg” waves have been studied by seismologists, and are one of the ways that seismologists can distinguish between earthquakes and explosions. See, for example:
Kafka (1990): Rg as a Depth Discriminant for Earthquakes and Explosions.
One Response to The Detective Work of Seismologists: Earthquake or Blast?
PetShopDad says: January 11, 2014 at 9:33 pm
Nice detective work, Justin. I thought Rg indicates that it’s shallow depth, which explosions typically are, but some shallow EQs have Rg.

Rayleigh seismic waves (Rg) ARE shallow depth surface waves.
Of course these 2 papers have little to do with the WTC-7 or WTC-2S and WTC-1N collapses.
Those were NOT earthquakes, but on the surface, building collapses, which send seismic signals into the underlying bedrock.
That second last link from 1990 is probably what you kept asking for, read its Abstract and Introduction (and the rest, esp. page 20-22 -392-394).
I don't think it will help you to bolster your opinions, since it has nothing to do with the heart of my thesis, which is a simple time comparison problem, not to be solved by those US Institutes, as long as they do not start retracting former parts of their published papers.
Which NIST certainly can't do anymore, since their whole video/photo time-stamping re-calculation operation was based on exactly the Cianca camera data....And LDEO can't ever retract their officially published 9/11 seismograms.
They both are set checkmate by me.
By just having enough patience, till NIST had put all its cards on the playing table.
So that's what they and the rest of the 9/11-criminals do now, ignore me and hope I will fade away. No chance.
edit on 30/12/16 by LaBTop because: Forgot to ad the last link, now corrected.
More seismic education courses :
www2.bc.edu...
edit on 30/12/16 by LaBTop because: Added last link
a reply to: LaBTop
Sorry, the real answer. There is no proof that the supposed seismic activity is only exclusive to a CD.
You can post as much as you want, but it's a false narrative.
All seismic activity is explained by jet impacts and building collapse.
You only have proof of seismic activity during a siesmic event.
If your doctor had real proof, it wouldn't for the most part be ignored by the movement.
You can post all you want, still doesn't explain why Gauge, Jones, Hulsey, And Wood ignore your doctor's work.
Especially if you don't show any ground work relating to seismic discrimination for the area.
a reply to: LaBTop
So? You still have to base your conclusions off the false reporting of explosions at WTC 7 to prove seismic activity do to CD. So sad. Please produce the audio of explosions due to CD.
Like I said, provide proof of seismic activity exclusive to CD. If the research was based on really seismic discrimination for the area, you could reference what know blast type and size it was historically most like.
edit on 30-12-2016 by neutronflux because: (no reason given)
a reply to: LaBTop
What you still have not disproven, the supposed seismic spike is only a result of building collapse.
One: In relationships of wave discrimination for the region and based on LDEO historical query mine blasting, you have not referenced a minimum size charge that would create seismic activity on the same magnitude as your supposed seismic spike at a distance of 26 miles.
Two: What were you babbling about WTC 7 and detectable seismic activity. The whole seismic event started at normal background and steadily built up in magnitude to its greatest peak.
Three: What was your claim why the 1993 WTC blast, if I remember right, of 900 TNT equivalent did not produce any recordable seismic activity at LDEO? An explosion in an enclosed basement that knocked out a wall and shook the whole building. Because it was deployed on tires?
Four: Still cannot use past LDEO blast wave discrimination in terms of P, S, L, Rayleigh waves on what is normal for blast seismic data to facilitate why claimed spike is from a blast. In other wards, all seismic data is explained by building collapse alone.
Five: No explanation why the supposed and distinct seismic spike is not backed by Palisades seismic activity recorded during 9/11.
Six: If the supposed seismic spike is stand alone evidence of CD, why even mention people confusing the rumble of a building collapse and snapping of steel floor connections with the distinct pressure wave from a CD charge that results in a 140 db ear damaging sound wave.
edit on 1-1-2017 by
neutronflux because: Fixed first line
originally posted by: neutronflux
a reply to: LaBTop
Can you even answer what size blast for the area would create recognizable seismic activity 26 miles away? In TNT equivalent pounds? With out that figure, you have no credible narrative.
So explosives were used at WTC 7 that created seismic activity 26 miles away, but no blast effects or noise were heard or seen at the site. They must have used hush a boom explosives, or there was no explosives used!
a reply to: hellobruce
I don't get Labtop's argument. I think somewhere in Labtop's manifesto, there was the you don't know what hush bomb technology the government has.
But Labtop's latest has shifted to eyewitness accounts of hearing CD explosions at WTC 7. Or was it just somebody heard something, but cannot be isolated, filtered, and identified by sound software?
When you use three pages to answer a simple question, it seems more like stonewalling than anything.
originally posted by: hellobruce
originally posted by: neutronflux
a reply to: LaBTop
Can you even answer what size blast for the area would create recognizable seismic activity 26 miles away? In TNT equivalent pounds? With out that figure, you have no credible narrative.
So explosives were used at WTC 7 that created seismic activity 26 miles away, but no blast effects or noise were heard or seen at the site. They must have used hush a boom explosives, or there was no explosives used!
Does AE911Truth cite seismic data? I tried searching their .org site. Seems they don't rely on Labtop's good doctors research? Go figure?
a reply to: LaBTop
Oh, Palisades is only one station out of the LDEO network? So is it the Seismic data from Palisades? Or LDEO?
So, there are Six seismic stations in the greater New York City Area? PAL, MANY, ARMY, TNR, GPD, BRNJ.
Why is the supposed seismic spike only visible at PAL?
Oh, Palisades is only one station out of the LDEO network? So is it the Seismic data from Palisades? Or LDEO?
So, there are Six seismic stations in the greater New York City Area? PAL, MANY, ARMY, TNR, GPD, BRNJ.
Why is the supposed seismic spike only visible at PAL?
Title: Seismic Waves Generated by Aircraft Impacts and Building Collapses at World Trade Center, New York City.
www.ldeo.columbia.edu...
Seismic Waves in Greater New York City Area
Six stations within the greater Metropolitan New York region (Fig. 2) recorded the two tower collapses. Vertical-component records are shown in Figure 3 as a record section of distance as a function of travel time. The dotted lines indicate velocities from 1.5 to 2.5 km/s assuming prop- agation along straight paths from the WTC to the stations. Unlike signals at distant stations, the predominant waves are surface waves of short period (about 1 s) called Rg with group velocities between 2.3 and 1.5 km/s. GPD only recorded horizontal components.
Relatively simple and similar pulses with durations of about 5 to 6 s arrive at stations BRNJ, TBR and ARNY starting at a group velocity of 2.0 km/s. The paths to each of those stations from the WTC are mostly in the low-velocity sedimentary rocks of the Newark Basin (N.B. in Fig. 2), the region of low topography west of the Hudson River and southeast of that of higher topography
in the Hudson Highlands (Reading Prong). Since those paths cross the boundaries of the Basin at a high angle, the signals at those stations are relatively simple. The signals (not shown) at LSCT, a station in northwestern Connecticut, are also relatively simple, reflecting propagation over a distance of 125 km entirely within the high-velocity rocks of the Manhattan Prong (M.P. in Fig. 2). Their group velocity of about 3.0 km/s is consistent with Rg propagation in that faster, older terrain. Thus, we conclude that the pulse duration at those four stations reflects mainly that the generation of seismic energy from the collapse was delivered over 5-6 s. A portion of the pulse duration probably results from the dispersion of Rg waves
edit on 2-1-2017 by neutronflux because: Added ot
new topics
-
SETI chief says US has no evidence for alien technology. 'And we never have'
Aliens and UFOs: 7 minutes ago -
This is our Story
General Entertainment: 2 hours ago -
President BIDEN Vows to Make Americans Pay More Federal Taxes in 2025 - Political Suicide.
2024 Elections: 5 hours ago -
Ode to Artemis
General Chit Chat: 5 hours ago -
Ditching physical money
History: 9 hours ago -
One Flame Throwing Robot Dog for Christmas Please!
Weaponry: 9 hours ago -
Don't take advantage of people just because it seems easy it will backfire
Rant: 9 hours ago -
VirginOfGrand says hello
Introductions: 10 hours ago -
Should Biden Replace Harris With AOC On the 2024 Democrat Ticket?
2024 Elections: 11 hours ago
top topics
-
University student disciplined after saying veganism is wrong and gender fluidity is stupid
Education and Media: 13 hours ago, 14 flags -
President BIDEN Vows to Make Americans Pay More Federal Taxes in 2025 - Political Suicide.
2024 Elections: 5 hours ago, 10 flags -
Police clash with St George’s Day protesters at central London rally
Social Issues and Civil Unrest: 16 hours ago, 9 flags -
TLDR post about ATS and why I love it and hope we all stay together somewhere
General Chit Chat: 17 hours ago, 7 flags -
Should Biden Replace Harris With AOC On the 2024 Democrat Ticket?
2024 Elections: 11 hours ago, 6 flags -
One Flame Throwing Robot Dog for Christmas Please!
Weaponry: 9 hours ago, 5 flags -
Ditching physical money
History: 9 hours ago, 4 flags -
Don't take advantage of people just because it seems easy it will backfire
Rant: 9 hours ago, 4 flags -
God lived as a Devil Dog.
Short Stories: 15 hours ago, 3 flags -
VirginOfGrand says hello
Introductions: 10 hours ago, 2 flags
active topics
-
SETI chief says US has no evidence for alien technology. 'And we never have'
Aliens and UFOs • 1 • : burritocat -
Ditching physical money
History • 13 • : Consvoli -
University student disciplined after saying veganism is wrong and gender fluidity is stupid
Education and Media • 27 • : Consvoli -
-@TH3WH17ERABB17- -Q- ---TIME TO SHOW THE WORLD--- -Part- --44--
Dissecting Disinformation • 637 • : burritocat -
The Reality of the Laser
Military Projects • 33 • : ADVISOR -
Terrifying Encounters With The Black Eyed Kids
Paranormal Studies • 71 • : FlyersFan -
This is our Story
General Entertainment • 1 • : Encia22 -
whistleblower Captain Bill Uhouse on the Kingman UFO recovery
Aliens and UFOs • 17 • : vance2 -
DerBeobachter - Electric Boogaloo 2
Introductions • 13 • : DerBeobachter2 -
One Flame Throwing Robot Dog for Christmas Please!
Weaponry • 7 • : OzBiker