It looks like you're using an Ad Blocker.
Please white-list or disable AboveTopSecret.com in your ad-blocking tool.
Thank you.
Some features of ATS will be disabled while you continue to use an ad-blocker.

Climate Change Denial, Anyone?
page: 4share:
climate change due to global warming is real, and most of it is man made. of course there are natural contributors as well, but nothing matches the
data as well as CO2. The suns impact is negligible, especially after 195
berkely earth summary of findings
berkely earth summary of findings
250 YEARS OF GLOBAL WARMING Berkeley Earth Releases New Analysis According to a new Berkeley Earth study released today, t he average temperature of the Earth’s land has risen by 1.5 °C over the past 250 years . T he good match between the new temperature record and historical carbon dioxide records suggests that the most straightforward explanation for this war ming is human greenhouse gas emission s . Together with their most recent results and papers, Berkeley Earth also released their raw data and analysis programs. They will be available online at BerkeleyEarth.org on July 30. The new analysis from Berkeley Earth goes all the way back to 1753, about 100 years earli er than previous groups’ analyse s. The limited land coverage prior to 1850 results in larger uncertainties in the behavior of the record; despite these, the behavior is significant. Ro bert Rohde, Lead Scientist for Berkeley Earth and the person who carried out most of the analysis, noted that “S udden drops in the early temperature record (1753 to 1850) correspond to known volcanic events.” Volcanoes spew particles into the air, which t hen reflect sunlight and cool the earth for a few years. In the Berkeley Earth temperature plot (see figure below ), sudden dips in temperature caused by large volcanic explosions are evident back to the late 1700s. Figure: The temperature of the Eart h’s land surface, as determined from over 36,000 temperature stations around the globe. The data is well fit by a simple model containing only known volcanic eruptions and carbon dioxide (dark line). No contribution from solar variability was necessary t o make a good match. The rapid but short (decadal) variations are believed to be due to changes in ocean flows , such as El Nino and the Gulf StreamBerkeley Earth compared the shape of the gradual rise over 250 years to simple math functions (exponentials, polynomials) and to solar activity ( known through historical records of sunspot numbers ), and even to rising functions such as world population. Richard Muller, Founder and Scientific Director of Berkeley Earth, notes “Much to my surprise, b y far the best match was to the record of atmospheric carbon dioxide, measured from atmospheric samples and air trapped in polar ice . ” He emphasizes that the match between the data and the theory do esn’t prove that carbon dioxide is responsible for the warming, but the good fit makes it the strongest contender. “ T o be considered seriously, an y alternative explanation must match the data at least as well as does carbon dioxide.” In its 2007 report the IPCC concluded only that “ most ” of the warming of the past 50 years could be attributed to humans. It was possible, according to the IPCC, that increased solar activity could have contributed to warming prior to 1956 . Berkeley Earth analyzed about 5 times more station records than were used in previous analyses, and this expanded data base along with its new statistical approach allowed Berkeley Earth to go about 100 years farther back in time than previous studies. By doing so, the Berkeley Earth team was able to conclude that over 25 0 years, the contribution of solar activity to global warming is negligible. Some of the scientists on the Berkeley Earth team admit surprise that t he new analysis has shown such clear agreement between global land -‐ temperature rise and hum an -‐ caused gree nhouse gases. “I was not expecting this,” says Richard Muller, “but as a scientist , I feel it is my duty to let the evidence change my mi nd .” Elizabeth Muller, co -‐ Founder and Executive Director of Berkeley Earth, says that “One of our goals at Berkeley E arth is complete transparency – we believe that everyone should be able to access raw climate data and do their own analysis. Scientists have a duty to be ‘properly skeptical’ , and we are trying to lower the barriers to entry into the field.” Robert Ro hde created a n online feature that allows people to look up temperature record s by location. “If you want to know what the temperature change has been in your city, your state, or even your country, you can now find this online at BerkeleyEa rth.org” says Rohde. He adds, “W e hope people will have a lot of fun interacting with the data.” This feature should be available to the pub l ic by Monday July 30. A previous Berkeley Earth study , released in October 2011, found that the land -‐ surface temperature had risen by ab out 0.9 °C over the past 50 years (which was consistent with previous analyses) and directly addressed scientific concerns raised by skeptics, including the urban heat island effect, poor station quality, and the risk of data selection bias. The Berkele y Earth team values the simplicity of its analysis , which does not depend on the large complex global climate models that have been criticized by climate skeptics for their hidden assumptions and adjustable parameters . The conclusion that the warming is d ue to humans is based simply on the close agreement between the shape of the observed temperature rise and the known greenhouse gas increase.
edit on 5-5-2016 by syrinx high priest because: (no reason given)
edit on 5-5-2016 by syrinx high priest because: (no reason
given)
edit on 5-5-2016 by syrinx high priest because: (no reason given)
originally posted by: intergalactic fire
If those are problematic than the land based stationdata are a humongous disaster. At least the satellites are giving consistent data.
Consistent data?
Really?
Here's a sampling of Dr. Roy Spencer's "consistent data":
Year M v6.0 (diff) v5.6
1998 1 0.49 (+.02) 0.47
1998 2 0.67 (+.02) 0.65
1998 3 0.48 (+.06) 0.42
1998 4 0.74 (+.08) 0.66
1998 5 0.64 (+.08) 0.56
1998 6 0.56 (+.05) 0.51
1998 7 0.50 (+.06) 0.44
1998 8 0.51 (+.07) 0.44
1998 9 0.44 (+.11) 0.33
1998 10 0.40 (+.11) 0.29
1998 11 0.12 (+.04) 0.08
1998 12 0.24 (+.05) 0.19
avg: 0.48 (+.06) 0.42
Year M v6.0 (diff) v5.6
2015 1 0.27 (-.09) 0.36
2015 2 0.17 (-.13) 0.30
2015 3 0.16 (-.09) 0.25
2015 4 0.08 (-.08) 0.16
2015 5 0.28 (-.04) 0.32
2015 6 0.33 (-.02) 0.35
2015 7 0.18 (-.06) 0.24
2015 8 0.27 (-.05) 0.32
2015 9 0.25 (-.13) 0.38
2015 10 0.42 (-.15) 0.57
2015 11 0.33 (-.14) 0.47
2015 12 0.44 (-.11) 0.55
avg: 0.27 (-.09) 0.36
Wow, even years that already were recorded changed drastically!
In case you don't grok this, it's a difference between two of his own models.
edit on 18Thu, 05 May 2016 18:47:28
-0500America/ChicagovAmerica/Chicago5 by Greven because: (no reason given)
originally posted by: intergalactic fire
a reply to: Krazysh0t
lol no
It is actually labelled very good i believe.
Those are 2 temperature datasets, UAH and RSS obtained from satellites in orbit.
It shows temperature anomalies for different altitudes and different latitudes.
This is the plotted data for the lower troposphere with vertical you have the temp anomaly.
You can also see here that in 35years there just has been a 0.2 degrees rise
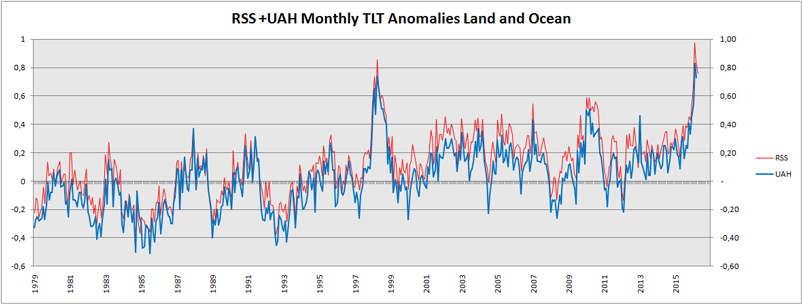
Also you can see from 1997-1999 there was a big spike as well. I wonder what the heck caused that!
'Perfect storm' of El Niño and warming boosted Alberta fires
I notice the deniers are a little thinner on the ground these days. Reality is breaking through.
‘We’ve had an incredibly dry winter, we didn't have enough snow pack,’ said Prof Judith Kulig from the University of Lethbridge in Alberta, who believes a ‘perfect storm’ of factors, including El Niño, has come together to cause the huge fire.
‘This year the fire season officially began March 1st, last year it was March 15th. These are significant changes when the fire season used to begin in May and now begins in March.’
Scientists say the current El Niño event is one of the strongest on record, with the effects felt all over the world including a reduced monsoon in India and droughts in parts of Africa.
I notice the deniers are a little thinner on the ground these days. Reality is breaking through.
edit on 5/5/16 by Astyanax because: there's not much left to do.
naw....those vids are whacky....c'mon now....
originally posted by: mc_squared
a reply to: Astyanax
I've been wanting to post these two videos somewhere, so going to use your thread as an excuse:
Jimmy Kimmel really stuck it to climate deniers the other day:
...and received the inevitable backlash:
These two clips capture the pointless absurdity in trying to reason with the Sarah Palin crowd. But man are they good for a laugh sometimes
a reply to: Astyanax
no one can deny that climate changes....it is changing now and always has.
The question is not whether climate is changing. The question is whether the human emissions are causing the change.
The world has been getting warmer since the last ice age. I expect that the trend will continue.
When El Nina hits - how will AGW supporters explain the cool weather?
Tired of Control Freaks
a reply to: TiredofControlFreaks
I am no longer interested in any fashion with atmospheric temperatures. The oceans cover 78 % of the globe and absorb far more heat then land. Heat in ocean currents create weather.
Lets look at the global ocean temperatures for Jan 2016
www.ospo.noaa.gov...
You can see that the global heat of the ocean is hot.
www.ospo.noaa.gov...
You can see that the global heat of the ocean is quite cool
Can anyone take a guess to see what is about to happen to global weather?
When the expected El Nino hits than the world's population will not be so eager to buy into the global warming scam.
Tired of Control Freaks
a reply to: Greven
Well that's a good thing no, if you compare the trend from V5.6 and the new V6.0 there has been a reduction of +0.140°C/decade to +0.114°C/decade for the global tlt temperature, now they match even more closely to the RSS satellite observations from NOAA. The average trend doesn't change all that much in the big picture.
What i mean by 'consistent' data is the reliability on the time frame, interval. Not like many of the ground stations, where individuals have to go out in the field to observe the data, where you can have all sorts of problems.
originally posted by: Vector99
originally posted by: intergalactic fire
a reply to: Krazysh0t
lol no
It is actually labelled very good i believe.
Those are 2 temperature datasets, UAH and RSS obtained from satellites in orbit.
It shows temperature anomalies for different altitudes and different latitudes.
This is the plotted data for the lower troposphere with vertical you have the temp anomaly.
You can also see here that in 35years there just has been a 0.2 degrees rise
Also you can see from 1997-1999 there was a big spike as well. I wonder what the heck caused that!
Yes, that is well know what was the cause. It will be interesting to see if this year will follow the same trend.
originally posted by: intergalactic fire
a reply to: Greven
Well that's a good thing no, if you compare the trend from V5.6 and the new V6.0 there has been a reduction of +0.140°C/decade to +0.114°C/decade for the global tlt temperature, now they match even more closely to the RSS satellite observations from NOAA. The average trend doesn't change all that much in the big picture.
What i mean by 'consistent' data is the reliability on the time frame, interval. Not like many of the ground stations, where individuals have to go out in the field to observe the data, where you can have all sorts of problems.
So just brush off the fact that his numbers change from revision to revision, sometimes half a degree.
Maybe you just don't understand how the satellites work? They're polar orbiters, so they go from one pole to the other, and continue to circle that way. This means they pass over spots near the poles several times a day... but due to the rotation of the earth, it means they pass over spots near the equator maybe once in several days.
Despite the frequent fly-overs of polar regions, they don't generally use polar region data (ever notice the grey areas on global temperature maps?) due to deflection and other issues.
Oh, and microwave sounders aren't very accurate. Perhaps you would also brush off that Dr. Spencer has said satellites aren't particularly accurate?
The reason Dr. Spencer (and others ) have to do these models is to fit data to data. Satellite 'measurements' require taking terrestrial observations and trying to correlate them with satellite observations. Remember, the satellite is just looking at a spot. The microwave sounder data is run through a complicated algorithm to try and extract 3-D information from looking at a spot on the Earth, and they don't really know how accurate it that is.
You — and I am addressing both sides here — can argue satellite data and hockey-stick curves till the oceans turn to steam.
And yes, you can dismiss the mundane, direct evidence staring you in the face as ‘anecdotal’.
It makes no difference, because it’s too late anyway.
If Earth gets lucky, the impending collapse of human civilization will halt the damage and enable the biosphere to enter a new, largely human-free epoch.
If she is unlucky, well... welcome to the first days of the last days of the planet Venus.
originally posted by: Astyanax
It makes no difference, because it’s too late anyway.
If Earth gets lucky, the impending collapse of human civilization will halt the damage and enable the biosphere to enter a new, largely human-free epoch.
If she is unlucky, well... welcome to the first days of the last days of the planet Venus.
Since you're so into that 'evidence' thing, I guess you'll have some to back up the "it's too late anyway" doom-porn you got going on there.
I pop this chart up sometimes in these discussions. Some people say it is cherry-picking data.
However, it really shows only one thing, that impending climate change is eminent. It does not say human or cyclic as a culprit, but you can infer on the time line of the industrial revolution, if you will... or it could be coincidental, or heaped on each other.... This CO2 asymptote has an attitude, and there will be change because of it in itself.
edit on 6-5-2016 by charlyv because: wrong resolution
originally posted by: Astyanax
'Perfect storm' of El Niño and warming boosted Alberta fires
‘We’ve had an incredibly dry winter, we didn't have enough snow pack,’ said Prof Judith Kulig from the University of Lethbridge in Alberta, who believes a ‘perfect storm’ of factors, including El Niño, has come together to cause the huge fire.
‘This year the fire season officially began March 1st, last year it was March 15th. These are significant changes when the fire season used to begin in May and now begins in March.’
Scientists say the current El Niño event is one of the strongest on record, with the effects felt all over the world including a reduced monsoon in India and droughts in parts of Africa.
I notice the deniers are a little thinner on the ground these days. Reality is breaking through.
More like we climate realists are getting tired of having the same back and forth arguments.
If you think the climate is going to negatively impact you, move to where it won't negatively impact you. No one is stopping you. But stop trying to tell other people how to live.
originally posted by: Astyanax
You — and I am addressing both sides here — can argue satellite data and hockey-stick curves till the oceans turn to steam.
And yes, you can dismiss the mundane, direct evidence staring you in the face as ‘anecdotal’.
It makes no difference, because it’s too late anyway.
We don't know how bad it's going to be and personally I am never going to give up working for a better future, no matter how bad it does get. Climate change sucks, but it's also the most prudent opportunity to steer our civilization into something bigger and better – not just environmentally, but socially and economically.
Our system is obsessed with overconsumption, consumerism and wage slavery because that's exactly what makes the plutocracy tick. Climate change is the biggest threat to that evil paradigm, which is precisely why they work so hard to deny it.
It sucks to see so many people here, particularly the ones who think they're anti-establishment, who can't rub enough brain cells together to see this very obvious agenda for what it is. I've wasted way too much time in the past trying to fight that ignorance with satellite data and basic physics, and I agree it's a lost cause.
But that doesn't mean those that do see the forest for all the (burning) trees should give up too. It still comes down to the fact that you can either be part of the solution or part of the problem. Taking the defeatist stance is just as useless as becoming a willfully obtuse climate denier.
To each their own, but I refuse to live the rest of my life being a waste of space like that, no matter what fate decides in the end.
a reply to: TiredofControlFreaks
There are few if any credible people, let alone scientists who disagree with man made climate change.
You are a loud mouth on here, very opposed to the idea of man made climate change.
What I don't understand why so many can be stupid enough to give you stars for your rants of hot air and no substance against man made climate change.
edit on 7-5-2016 by jrod because: d
originally posted by: TiredofControlFreaks
a reply to: Astyanax
When El Nina hits - how will AGW supporters explain the cool weather?
What's El Nina, do you mean La Nina? How will they explain (relatively) cooler temperatures during a La Nina?
Geee...I don't know...maybe by the fact that's exactly what a La Nina does? This kind of natural variation can be easily mapped and only further solidifies the long term, unnatural trend.
Seeing the mindless backslapping of stars a post this ignorant attracts really makes one embarrassed to be a fan of ATS at times. You wrote literally nothing but a bunch of backwards, circular, bad Spanish there - congrats!!
new topics
-
Former Labour minister Frank Field dies aged 81
People: 2 hours ago -
SETI chief says US has no evidence for alien technology. 'And we never have'
Aliens and UFOs: 3 hours ago -
This is our Story
General Entertainment: 6 hours ago -
President BIDEN Vows to Make Americans Pay More Federal Taxes in 2025 - Political Suicide.
2024 Elections: 8 hours ago -
Ode to Artemis
General Chit Chat: 9 hours ago
top topics
-
University student disciplined after saying veganism is wrong and gender fluidity is stupid
Education and Media: 17 hours ago, 14 flags -
President BIDEN Vows to Make Americans Pay More Federal Taxes in 2025 - Political Suicide.
2024 Elections: 8 hours ago, 12 flags -
Should Biden Replace Harris With AOC On the 2024 Democrat Ticket?
2024 Elections: 14 hours ago, 6 flags -
One Flame Throwing Robot Dog for Christmas Please!
Weaponry: 13 hours ago, 6 flags -
SETI chief says US has no evidence for alien technology. 'And we never have'
Aliens and UFOs: 3 hours ago, 4 flags -
Ditching physical money
History: 12 hours ago, 4 flags -
Don't take advantage of people just because it seems easy it will backfire
Rant: 13 hours ago, 4 flags -
Ode to Artemis
General Chit Chat: 9 hours ago, 3 flags -
Former Labour minister Frank Field dies aged 81
People: 2 hours ago, 3 flags -
This is our Story
General Entertainment: 6 hours ago, 2 flags
active topics
-
President BIDEN Vows to Make Americans Pay More Federal Taxes in 2025 - Political Suicide.
2024 Elections • 20 • : CarlLaFong -
Police clash with St George’s Day protesters at central London rally
Social Issues and Civil Unrest • 41 • : BedevereTheWise -
"We're All Hamas" Heard at Columbia University Protests
Social Issues and Civil Unrest • 268 • : HopeForTheFuture -
Tucker Carlson UFOs are piloted by spiritual entities with bases under the ocean and the ground
Aliens and UFOs • 43 • : Xtrozero -
Thousands Of Young Ukrainian Men Trying To Flee The Country To Avoid Conscription And The War
Other Current Events • 127 • : Consvoli -
University student disciplined after saying veganism is wrong and gender fluidity is stupid
Education and Media • 41 • : BedevereTheWise -
1980s Arcade
General Chit Chat • 25 • : confuzedcitizen -
So this is what Hamas considers 'freedom fighting' ...
War On Terrorism • 241 • : HopeForTheFuture -
Don't take advantage of people just because it seems easy it will backfire
Rant • 6 • : crayzeed -
New whistleblower Jason Sands speaks on Twitter Spaces last night.
Aliens and UFOs • 50 • : baablacksheep1