It looks like you're using an Ad Blocker.
Please white-list or disable AboveTopSecret.com in your ad-blocking tool.
Thank you.
Some features of ATS will be disabled while you continue to use an ad-blocker.

Quake Watch 2016
page: 80share:
a reply to: GoShredAK
My partner has said she felt these a few times since the 7.8 but they have never posted any local quakes around the time she felt them.
I may have felt them too, same period, but I thought at the time that the way I was sitting at the computer desk I might be leaning on a nerve in my thigh or butt, and that is what I thought it was.
I wouldn't be surprised that if they had the same equipment as PNSN have up on the Cascadia region that we would be seeing those tremor swarms back and forth underneath our area.
Kapiti Slow Slip
I had a look on the 60 day Kapiti Island GPS reading, but that is 2 days old when its "new"
fits.geonet.org.nz...
no real shift only 0.66mm in the period 22/11-30/11
all the movement was between the 12th and the 13th the day BEFORE the 7.8 !! (I never noticed that before, I though it was the 13th-14th the day of the quake when that big spike was)
I need to read more about what these graphs actually show.
It will be interesting to see the reading on Sundays "new" graph
these are a bit different to the feeling of a long way off quake, maybe more like the cat rubbing against the chair
My partner has said she felt these a few times since the 7.8 but they have never posted any local quakes around the time she felt them.
I may have felt them too, same period, but I thought at the time that the way I was sitting at the computer desk I might be leaning on a nerve in my thigh or butt, and that is what I thought it was.
I wouldn't be surprised that if they had the same equipment as PNSN have up on the Cascadia region that we would be seeing those tremor swarms back and forth underneath our area.
Kapiti Slow Slip
I had a look on the 60 day Kapiti Island GPS reading, but that is 2 days old when its "new"
fits.geonet.org.nz...
no real shift only 0.66mm in the period 22/11-30/11
all the movement was between the 12th and the 13th the day BEFORE the 7.8 !! (I never noticed that before, I though it was the 13th-14th the day of the quake when that big spike was)
I need to read more about what these graphs actually show.
It will be interesting to see the reading on Sundays "new" graph
edit on 1200000033633616 by muzzy because: (no reason given)
these are a bit different to the feeling of a long way off quake, maybe more like the cat rubbing against the chair
edit on 1200000033633616
by muzzy because: (no reason given)
South America had it's 6M on the first of the month, paying the rent- how regular. Muzzy's right on the once a month average.
Average. That's why I guess I'm writing. I don't want to scare monger, even though I'm capable. But I won't.
I've been watching the NMSZ for months. Years really. And, I've described the drip-drip I've seen. Now it's more. Today, we had a 2.9M. And for the last seven we've had 13. So, it's drip, drip, drop.
That's all I'll say. It's above average.
a reply to: ericblair4891
Excuse me, Mr. EricBlair? Can you help me with something? You mention the NMSZ. I was living in Indiana (near Purdue) in the 80s when I felt my first earthquake. I believe it was approximately 30 years ago. At the time, I had no idea what the heck was happening. Of course, we eventually all found out it was an earthquake....but many of my neighbors refused to believe that, as "earthquakes don't happen here- it ain't California!!" So, sadly, we had a town divided: some who believed the news, and others who felt it was "bull-honkey".
But it was an EQ we felt back then, wasn't it? And probably from the NMSZ? Also...WHY? And why aren't more people paying attention to it? Because of the location? Thanks, Soup Master.
a reply to: HollywoodFarmGirl
Yup, you probably felt an earthquake in Indiana. However, it wasn't the NMSZ, it was probably the Wabash Valley Seismic Zone. The two areas are most likely connected way back when the area was a rift. People should pay attention to the earthquake threat. There's tons of information on 1811.
en.wikipedia.org...
As can be expected I am following the aftershocks of the Hope Fault 7.8 quite closely, doing an update twice a day, morning and evening to keep it up
to date.
the summary so far (last night);
mag~1= 1
mag1= 443
mag2= 4,035
mag3= 2,034
mag4= 411
mag5= 49
mag6= 2
mag7= 1
total= 6,976
TTNT= 8,331,627.057
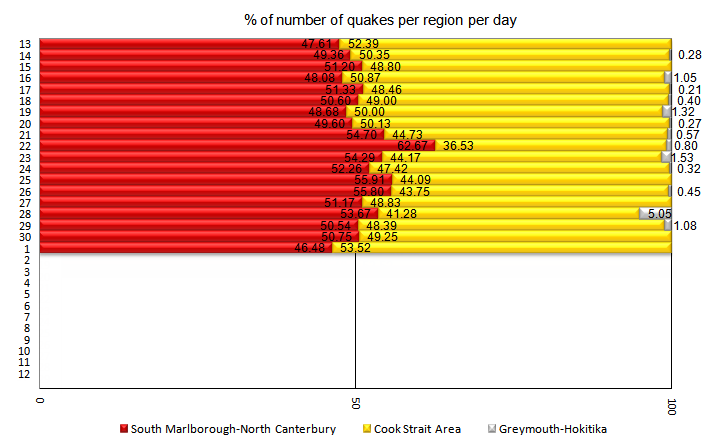
Looking at the map, and looking at Geonet's "All" lists on a regular basis, it looks like Cook Strait is getting more than Marlborough, Cook is more tightly packed though.
To check this question out I made a graph breaking it down to days and each areas % of the total numbers of quakes for that day.
Quite even really, but interesting that overall Cook had more to start with but now its reversed.
It should be noted that the surge for Marlborough on the 22nd to 62.67% was the day of the 5.7 near Scargill which had it's own little aftershock series.
Hope Fault page
*I chose the graph bar colours based on each regions Rugby National Provincial Championship teams jersey base colour. Kiwis would know this straight away.
I got the idea for the % graph from what I did with Kumamoto, when I broke it down into Prefectures per 199 bundle,
but I think this new type of % graph works better.
I might go back and do this % breakdown for Kumamoto, seeing as the 199 bundles were based on the 199 icon Bing maps I had created, which no longer work and have been deleted, so its not really relevant why the graph shows per 199 bars. Job for the weekend.
the summary so far (last night);
mag~1= 1
mag1= 443
mag2= 4,035
mag3= 2,034
mag4= 411
mag5= 49
mag6= 2
mag7= 1
total= 6,976
TTNT= 8,331,627.057
Looking at the map, and looking at Geonet's "All" lists on a regular basis, it looks like Cook Strait is getting more than Marlborough, Cook is more tightly packed though.
To check this question out I made a graph breaking it down to days and each areas % of the total numbers of quakes for that day.
Quite even really, but interesting that overall Cook had more to start with but now its reversed.
It should be noted that the surge for Marlborough on the 22nd to 62.67% was the day of the 5.7 near Scargill which had it's own little aftershock series.
Hope Fault page
*I chose the graph bar colours based on each regions Rugby National Provincial Championship teams jersey base colour. Kiwis would know this straight away.
edit on 1200000033633616 by muzzy because: (no reason given)
I got the idea for the % graph from what I did with Kumamoto, when I broke it down into Prefectures per 199 bundle,
but I think this new type of % graph works better.
I might go back and do this % breakdown for Kumamoto, seeing as the 199 bundles were based on the 199 icon Bing maps I had created, which no longer work and have been deleted, so its not really relevant why the graph shows per 199 bars. Job for the weekend.
edit on 1200000033633616 by muzzy
because: (no reason given)
4 minutes ago
Geesus that made me jump
Big jolt, house shook like crazy, short period
Public ID 2016p913880
Intensity severe
Universal Time December 4 2016, 3:15:46
NZ Daylight Time Sun, Dec 4 2016, 4:15:46 pm
Depth 24 km
Magnitude 5.7
Location 20 km south-east of Seddon
Latitude, Longitude -41.78, 174.22
Agency WEL(GNS_Primary)
www.geonet.org.nz...
downgraded to 5.5 reviewed
i think it might come back up, it was really strong here.
I see quite a few "extreme" felt reports from Wellington CBD, I wonder how many more buildings will get the red sticker and have to be pulled down.
In case you haven't been reading the NZ news a 10 story office building and a Cinema/Multistory Car Park building are currently being demolished as they are a collapse hazard after the 7.8.
There are hundreds of other smaller buildings that have been red sticker'd.
USGS 5.0mb?
Come on guys? a 5.0 at that distance doesn't make you jump in surprise
Geesus that made me jump
Big jolt, house shook like crazy, short period
Public ID 2016p913880
Intensity severe
Universal Time December 4 2016, 3:15:46
NZ Daylight Time Sun, Dec 4 2016, 4:15:46 pm
Depth 24 km
Magnitude 5.7
Location 20 km south-east of Seddon
Latitude, Longitude -41.78, 174.22
Agency WEL(GNS_Primary)
www.geonet.org.nz...
edit on 1200000033733716 by muzzy because: (no reason given)
downgraded to 5.5 reviewed
i think it might come back up, it was really strong here.
edit on 1200000033733716 by muzzy because: (no reason given)
I see quite a few "extreme" felt reports from Wellington CBD, I wonder how many more buildings will get the red sticker and have to be pulled down.
In case you haven't been reading the NZ news a 10 story office building and a Cinema/Multistory Car Park building are currently being demolished as they are a collapse hazard after the 7.8.
There are hundreds of other smaller buildings that have been red sticker'd.
edit on 1200000033733716 by muzzy because: (no reason
given)
USGS 5.0mb?
Come on guys? a 5.0 at that distance doesn't make you jump in surprise
edit on 1200000033733716 by muzzy because: (no reason given)
further to post by: muzzy
I have figured out how to get, then loaded the GPS plots on a daily basis, using Geonet.
I have done it for Porangahau GPS station and loaded them to the Porangahau page because that is where the earthquakes were.
What I'm not sure of is are we now headed west or east, because of the negative measurement on the graph?
eg. On the graph X axis it says east(mm) -50 to -90, so does that mean "back 50-90mm" or actually West?
The reason for the confusion is when you broaden the length of time.
I ran it out to Jan 2014 start.
The graph shows we headed (east?) approx 20mm in one direction between Jan 2014 and Feb 2015, when we suddenly went the other direction (west?) 20mm for a short period of time, before continuing again 30mm until 17th Nov 2016 when we went 45mm in the opposite direction after the Hope Fault 7.8
If you go by the map they show everything is headed east, but they don't give a length of time on it, just that date of 26 November 2016.
Now looking at Kapiti its even more confusing because the GPS plot graph looks like a dome, over an even longer term. The movement here isn't on the same scale as the East Coast, and we are not having swarms of small earthquakes like they are.
From Jan 2012 to about end of Feb 2013 we were heading about 35mm one direction (steadily?), then it reversed direction almost back to the same spot by Feb 2014, then back off again on the original track, moving 45mm over the next 3 years (slowly?) until the Hope Fault 7.8 quake and we reversed (suddenly?)again 15mm.
All this slipping back and forth is making me dizzy.
I was scared to look at Cape Campbell after seeing the big cracks in the landscape in the media from the the 7.8, but I did, it moved over 1400mm (4.5ft)
You can see on the graph it moved (approx) 250mm in the Cook Strait series of M6's in July 2013 as well, but in the opposite direction to last months shift.
20mm-45mm doesn't sound much but when you are talking 10's of 000's of square km of land mass moving ...............
1400mm? well that would have been a sight to see if it had been daylight.
edit on 1200000033733716 by muzzy because: (no reason given)
What are your thoughts on the quakes happening just west of Coos bay Oregon?
They are East of the subduction fault but off the coast a touch...
You do not see many of these at all in this area.
I feel that when Cascadia unzips, it will be centered on this exact area...we shall see.
They are East of the subduction fault but off the coast a touch...
You do not see many of these at all in this area.
I feel that when Cascadia unzips, it will be centered on this exact area...we shall see.
a reply to: radpeteage
Do you follow this web site?
www.pnsn.org...
You can draw your own depth cross section graph
Bring up the Faults
using the Tools dropdowm menu
On the Faults my mouse pointer becomes a finger when you hover on the line, which usually indicated there is some info to be had there
but nothing comes up when you click the line
Trinidad 6.1
geofon.gfz-potsdam.de...
Edt: well it was 6.1
now 5.8
geofon.gfz-potsdam.de...
Edt: well it was 6.1
now 5.8
edit on 1200000034034016 by muzzy because: (no reason given)
NW of Banda Aceh 6.5
geofon.gfz-potsdam.de...
This is where the Super moon theory falls apart
2 big quakes in 1 day opposite sides of the Orb
geofon.gfz-potsdam.de...
This is where the Super moon theory falls apart
2 big quakes in 1 day opposite sides of the Orb
originally posted by: muzzy
NW of Banda Aceh 6.5
geofon.gfz-potsdam.de...
This is where the Super moon theory falls apart
2 big quakes in 1 day opposite sides of the Orb
The removal of a force may have the same effect as the application of the force.
Pull a rubber band back, you stored energy. Now release it!
A negative force can equal a positive force and positive and negative can be anything you want them to be.
P
This is pretty cool, before and after NASA pictures of Kaikoura town (interactive) showing the uplift
earthobservatory.nasa.gov...
Too bad they didn't get further north up the coast where it lifted 6 metres out of the sea.
Also report that 10 Faults failed (but not the Hope Fault, which is the longest one).
www.stuff.co.nz...
I find that hard to believe given the aftershock locations.
Maybe they just mean the other faults showed rupture at the surface, whereas the Hope didn't show.
Maybe the Hope fault itself is yet to let rip.
My Insurance broker was saying that down there there is no intention to start rebuilding anything yet, as far as the ReInsurers overseas are concerned the Earthquake Series is still in progress
Indeed it is, 8131 aftershocks at download this afternoon, incl a 4.8 early this morning.
edit on 1200000034234216 by muzzy because: add graph
No Tsunami warning it seems yet anyway, woke me up.
M 6.8 - 165km W of Ferndale, California
V
DYFI?
Tsunami Warning Center
Time
2016-12-08 14:50:00 (UTC)
Location
40.400°N 126.200°W
Depth
10.0 km
PRELIMINARY EARTHQUAKE PARAMETERS
---------------------------------
* The following parameters are based on a rapid preliminary
assessment and changes may occur.
* Magnitude 6.8
* Origin Time 0550 AKST Dec 08 2016
0650 PST Dec 08 2016
1450 UTC Dec 08 2016
* Coordinates 40.4 North 126.2 West
* Depth 6 miles
* Location 110 miles SW of Eureka, California
270 miles NW of San Francisco, California
ntwc.arh.noaa.gov...
edit on 8-12-2016 by SeaWorthy because: (no reason
given)
edit on 8-12-2016 by SeaWorthy because: (no reason given)
originally posted by: Virgil Cain
a reply to: SeaWorthy
I wonder if this could be a fore shock? I defer to those with more expertise and who look more closely at these things than I do. Certainly worth keeping an eye on...
Yes I was wondering the same thing. Guess all we can do is stay prepared for anything!
a reply to: Virgil Cain
Very unlikely. This area does not have much larger then that normally
Seismicity map from EMSC
Back to 6.5 now
Location in IRIS Earthquake Browser
Derived from Event Data Source: USGS
Powered by QVSData
Very unlikely. This area does not have much larger then that normally
Seismicity map from EMSC
Back to 6.5 now
Magnitude 6.5 - Off Coast Of Northern California
Location in IRIS Earthquake Browser
- Date-Time: Thursday, December 08, 2016 @ 14:49:46 UTC
- Earthquake location: 40.507°N, 126.118°W,
- Earthquake depth: 10.0 km
- Event ID: us20007z6r
Derived from Event Data Source: USGS
Powered by QVSData
edit on 8/12/2016 by PuterMan because: Tag problem
hey ATS users.
Haven't been here for some time (months). I just wanted to say that you should probably be extra careful if you live in areas that either has constant ground movement or is expecting a bigger one anyway(Japan,U.S so on).
There are lot of things happening right before our eyes (Meteors,Fireballs Volcanic activity,Earthquakes in and outside unusual places) and many rumours about certain places of this planet.
I would not skip any DOOM article,video you see for at least a couple of weeks or months because some level of truth could be contained in it.
Stay informed, Stay safe!
edit on 8-12-2016 by Eagleyedobserver because: (no reason given)
edit on 8-12-2016 by Eagleyedobserver because: (no reason
given)
new topics
-
Who guards the guards
US Political Madness: 1 hours ago -
Has Tesla manipulated data logs to cover up auto pilot crash?
Automotive Discussion: 3 hours ago -
whistleblower Captain Bill Uhouse on the Kingman UFO recovery
Aliens and UFOs: 8 hours ago -
1980s Arcade
General Chit Chat: 10 hours ago -
Deadpool and Wolverine
Movies: 11 hours ago
top topics
-
Lawsuit Seeks to ‘Ban the Jab’ in Florida
Diseases and Pandemics: 15 hours ago, 20 flags -
Starburst galaxy M82 - Webb Vs Hubble
Space Exploration: 17 hours ago, 13 flags -
CIA botched its handling of sexual assault allegations, House intel report says
Breaking Alternative News: 13 hours ago, 8 flags -
whistleblower Captain Bill Uhouse on the Kingman UFO recovery
Aliens and UFOs: 8 hours ago, 7 flags -
Deadpool and Wolverine
Movies: 11 hours ago, 4 flags -
1980s Arcade
General Chit Chat: 10 hours ago, 4 flags -
Teenager makes chess history becoming the youngest challenger for the world championship crown
Other Current Events: 12 hours ago, 3 flags -
Who guards the guards
US Political Madness: 1 hours ago, 1 flags -
Has Tesla manipulated data logs to cover up auto pilot crash?
Automotive Discussion: 3 hours ago, 0 flags
active topics
-
Candidate TRUMP Now Has Crazy Judge JUAN MERCHAN After Him - The Stormy Daniels Hush-Money Case.
Political Conspiracies • 624 • : Vermilion -
23,000 Dead People Registered Within a Two Week Period In One State
US Political Madness • 41 • : Xtrozero -
"We're All Hamas" Heard at Columbia University Protests
Social Issues and Civil Unrest • 202 • : network dude -
They Killed Dr. Who for Good
Rant • 64 • : Lazy88 -
Deadpool and Wolverine
Movies • 2 • : chiefsmom -
Has Tesla manipulated data logs to cover up auto pilot crash?
Automotive Discussion • 2 • : seekshelter -
Scientists Say Even Insects May Be Sentient
Science & Technology • 55 • : AdultMaleHumanUK -
-@TH3WH17ERABB17- -Q- ---TIME TO SHOW THE WORLD--- -Part- --44--
Dissecting Disinformation • 610 • : Justoneman -
Lawsuit Seeks to ‘Ban the Jab’ in Florida
Diseases and Pandemics • 24 • : VariedcodeSole -
whistleblower Captain Bill Uhouse on the Kingman UFO recovery
Aliens and UFOs • 7 • : pianopraze