It looks like you're using an Ad Blocker.
Please white-list or disable AboveTopSecret.com in your ad-blocking tool.
Thank you.
Some features of ATS will be disabled while you continue to use an ad-blocker.

Quake Watch 2016
page: 64share:
a reply to: ericblair4891
I'm with you its soooo dumb it's funny to think there are actual living people around this and no one seems to care ...but hey.. let's recycle!!!
Also... What idiot builds natural gas pipelines all around and under fault lines. WE DO!!!
Makes me insane to really think about how dumb it all is.
Yeah, I have noticed CA is on a roll today.. the ones under 2.5 are really adding up today!! Not a whole lot of pressure being released today but Im sure there will be an uptick. The one off Central America may be the trigger that gets it going or maybe the drilling will. lol
a reply to: ericblair4891
You have never experienced a 5.7 have you?
you wouldn't dismiss one that size if you had
luckily it was under the sea and miles from civilization
yeah its been relatively quiet since the 23rd-24th surge when we had 7 quakes above 5.5 in 48hrs, and of those 4 were over 6.2
its figuring out why we get these surges that is the big project
a reply to: muzzy
I've one felt one earthquake. 1988 Quebec, 5.9M. I was near Toronto. It was felt widely. I was on the 23rd floor of an apartment building. The whole building swayed.
I wasn't say a 5.7M isn't biggish. I was just saying it's slow compared to that surge. They do come in clusters though.
I've one felt one earthquake. 1988 Quebec, 5.9M. I was near Toronto. It was felt widely. I was on the 23rd floor of an apartment building. The whole building swayed.
I wasn't say a 5.7M isn't biggish. I was just saying it's slow compared to that surge. They do come in clusters though.
a reply to: muzzy
Sorry for the late reply muzzy. I had to jet to work.
I'm not sure what the problem is. I got the download for the installer and was able to open it and install.
(I'm running Win10, too.)
My problem is that no stations will load. I just get the same old "oops" error.
I'll fiddle with it a bit tonight, and if I can't get an seismos going, I'll shoot an email to GEE
Bummer, I was excited to have the "add networks" option working again. The past version, it was broken.
a reply to: ericblair4891
Oh OK then, It sounded like you were joining the "I don't get out of bed unless its over M6" california crowd
Oh OK then, It sounded like you were joining the "I don't get out of bed unless its over M6" california crowd
edit on 1000000027827816 by muzzy because: (no reason given)
edit on 1000000027827816 by muzzy because: (no reason
given)
a reply to: muzzy
Here's the thing, it's still slow.
It's nice when we agree on things. Since, we've has disagreements. But, it's not that stupid saying, let's agree to disagree. That makes me crazy. Then melt down on how I hate opinion...
We are both noticing the same things, because we are watching the same thing. The planet, and the way it jiggles and bangs.
25 years, we wouldn't be on the internet, literally, talking to each, from opposite ends of the world. Even the USGS didn't have all the reporting back then. They had some data, they were half blind too. Today, we have monitors all over, in real time, we have interactive maps, and much more. And new, funky maps with wind, pressure and all kinds of other data in a dynamic way. It's so cool.
These conversations, and the observations we make, are relatively new. At no before, could so much information come to bear on the understanding of an earthquake. We here, even learned to figure out natural earthquakes from those caused by us.
Now where do agree.
There are surges, clusters, whatever we want to call them. It's either been one three things. Normalish, quiet and busy. When it gets busy, it can real get busy as we've seen. Usually we ignore the quiet stuff and the normal. Well, I don't. It's a problem I have, but we'll move passed that. We've observed the same thing. The fact is, big earthquakes can come in clusters. Therefore, there must be some triggering mechanisms. We've discussed a few. But I like your idea of the core. Well, not exactly, or only the core, it's the magma. It's liquid. There I am obsessed. Water is liquid.
the magma is flowing. it's not just about chunks of the crust falling the mantle. if they fall, then liquid rises. this already a basic accepted idea in geology. i'm thinking there's much more flow. much more. even when the earth tilts and runs around the sun.
the reason no want predict earthquakes is there is really no one reason for earthquakes. I'm thinking, the more we look them, the complex the whole system is.
I'll stop here. but i will say, let's watch the quiet and see what happens next.
Moderate earthquake off Madagascar. Low pressure just to the southwest, and strong winds, and a weak storm just to the east.
I'm late on observation so the storm may have been right top at the time. It's moving away now.
There's also another mid-Atlantic. No low pressure. But, weird patterns of wind, and there is a large disorganized storm over area.
And one note on the New Madrid. It's still, drip, drip, drip.
edit on 6-10-2016 by ericblair4891 because: (no reason given)
Taiwan, A Case Study On Weather Induced Earthquakes.
If humans can cause earthquakes, I'm sure, the weather can as well.
5.7M Taiwan
earthquake.usgs.gov...
We have a big low pressure off the southwest end of Taiwan. I'm not even sure if it's a named Cyclone because I haven't got that far yet. I have however, noticed the conveyor of storms that have already hit Taiwan. This means, they are a wet island. Tons of precipitation over last many weeks. I've seen the video of many storms.
So, the pressure is low, and the ground is sodden. Also, the wind is doing the thing that I keep seeing. I love the visuals. It's like watching river currents. The wind is a thing. It's a big part. I have noticed, lately especially, since I am zoning in on wind. (thanks Muzzy for turning me into a full on crack addict, I mean, a map addict) I have noticed, that when strong winds blow between two islands, there are earthquakes that appear when there's a storm blowing through. The wind pushes waves. The waves hit points and whatever the islands have around, and this causes a funneling of current. In the same way you increase pressure by narrowing a hose, the wind and waves increase as the hit the narrows, and also, the fact is that most likely, that it gets shallower around the island. This also increases the height of the waves. The come crashing. I stress crashing.
Also, in China, they've had some intense high tides in their rivers. Swollen rivers, and the moon.
Are we seeing the math? These storms, punish. The wind, the waves, and water itself. How can it not effect earthquakes?
Well it does. At least, scientists know of a few ways. I won't bother mentioning them.
But they're are many more ways that weather causes earthquakes. The low pressure itself causes waves on the oceans. Then when you add rotation, disturbances, from multiple directions, all converging on a point- this will cause stress. Stress kills. See your about some drugs for that. No, wait don't. They have too many side-effects. Get it. Nothing has just one effect.
There are always, many, many, side-effects. Some big some small...
Not a typhoon, but it has a name.
Tropical Storm AERE.
focustaiwan.tw...
And, I must say, this tropical storm is blowing between two islands. Taiwan and the Philippines. And notice the earthquake is off Taiwan's point. If you are a fisherman, or fisherwoman, you know, you try finish of the points.
This is just an imagining, so indulge me. I think of the point vibrating from waves. Like someone twanging on a tuning fork. That's a lot of vibrating.
Also, there's extra water under the ocean right there. If Taiwan is sodden, the rain fall from previous storms has time to work it's way down into underground aquifers and springs. It's recharging a system. Fresh water can travel down and then come up under the ocean in springs.
So, did the vibrating, and the lubricating, and the wave pressures from a storm rupture this fault?
Why not?
edit on 6-10-2016 by ericblair4891 because: (no reason given)
a reply to: ericblair4891
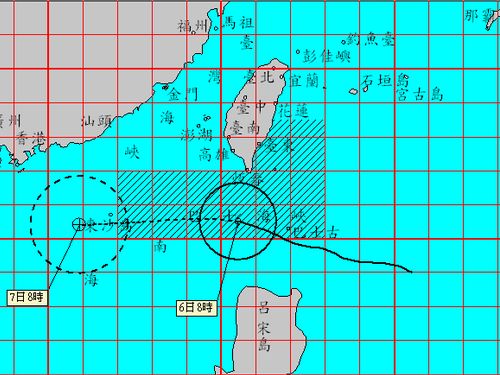
Ha, when I got up out of bed this morning and opened GFZ I seen the Taiwan quake, the first thing I did after that was open earthnullschool wind map
yeah I see the depression to the SW
the Mean Sea Level Pressure at the quake location was 1010 hPa, I don't know if that means anything
heading up the Ryukyu Island chain to the NE the hPa rises to 1018 as far as Kyushu, then over 1020 for the 4 main japan islands.
following the curve of the wind down from the quake to the storm eye it drops gradually down to 1004 at the eye.
Anyone who knows about hPa is probably laughing , like "Doh that's how it works dummy"
I don't know much about hPa and what it means, just learning.
It looks to me that if you follow the north edge of the tail of the storm up past the quake centre the gradually hPa rises going NE
green circle is the 5.7 quake
I'm wondering if hPa has anything to do with triggering Faults why hasn't Luzon in the Philippines gone off?, the hPa is lower there than off Taiwan.
Maybe hPa is a red herring?
Ha, when I got up out of bed this morning and opened GFZ I seen the Taiwan quake, the first thing I did after that was open earthnullschool wind map
yeah I see the depression to the SW
the Mean Sea Level Pressure at the quake location was 1010 hPa, I don't know if that means anything
heading up the Ryukyu Island chain to the NE the hPa rises to 1018 as far as Kyushu, then over 1020 for the 4 main japan islands.
following the curve of the wind down from the quake to the storm eye it drops gradually down to 1004 at the eye.
Anyone who knows about hPa is probably laughing , like "Doh that's how it works dummy"
I don't know much about hPa and what it means, just learning.
It looks to me that if you follow the north edge of the tail of the storm up past the quake centre the gradually hPa rises going NE
green circle is the 5.7 quake
edit on 1000000027927916 by muzzy because: replaced the map with a better one showing the hPa readings
I'm wondering if hPa has anything to do with triggering Faults why hasn't Luzon in the Philippines gone off?, the hPa is lower there than off Taiwan.
Maybe hPa is a red herring?
edit on 1000000027927916 by muzzy because: (no reason given)
Date and Time
UTC: 07 October 2016 @ 01:53:45
Location Near Rangari, NSW.
Coordinates: -30.568, 150.344
Depth: 0 km
Magnitude
ML: 3.1
www.ga.gov.au...
UTC: 07 October 2016 @ 01:53:45
Location Near Rangari, NSW.
Coordinates: -30.568, 150.344
Depth: 0 km
Magnitude
ML: 3.1
www.ga.gov.au...
I did a new graph of Solar Flux and Earthquakes oer M5
nothing to see overall for the year when comparing both, but
you can see the Flux is on the rise since Oct 1
and the earthquakes more spread out and low in size same period
graph
I didn't load the full size image to ATS, its quite big
here is a thumbnail of it
nothing to see overall for the year when comparing both, but
you can see the Flux is on the rise since Oct 1
and the earthquakes more spread out and low in size same period
graph
I didn't load the full size image to ATS, its quite big
here is a thumbnail of it
For those not in the know, wiki has a quick article on the pascal- the SI unit for pressure. Hectopascal, hPa, works out to 100 pascals or 1 millibar,
and the measurements below are indicators of the absolute air pressure in those areas. The numbers are often corrected to mean sea level when
displayed over land, to factor out terrain elevation.
A perfect vacuum would be read as 0 hPa; the average air pressure at mean sea level is 1013.25 hPa. Below 1013.25 hPa would be considered a low pressure area and above would be considered high pressure. And for fun facts: a typical automotive engine might idle at 400-500 hPa and a turbocharger may peak at well over 2000 hPa.
A person going between 1004 and 1020 hPa, aside from wind effects, might experience popping ears.
originally posted by: muzzy
a reply to: ericblair4891
Ha, when I got up out of bed this morning and opened GFZ I seen the Taiwan quake, the first thing I did after that was open earthnullschool wind map
yeah I see the depression to the SW
the Mean Sea Level Pressure at the quake location was 1010 hPa, I don't know if that means anything
heading up the Ryukyu Island chain to the NE the hPa rises to 1018 as far as Kyushu, then over 1020 for the 4 main japan islands.
following the curve of the wind down from the quake to the storm eye it drops gradually down to 1004 at the eye.
Anyone who knows about hPa is probably laughing , like "Doh that's how it works dummy"
I don't know much about hPa and what it means, just learning.
It looks to me that if you follow the north edge of the tail of the storm up past the quake centre the gradually hPa rises going NE
green circle is the 5.7 quake
I'm wondering if hPa has anything to do with triggering Faults why hasn't Luzon in the Philippines gone off?, the hPa is lower there than off Taiwan.
Maybe hPa is a red herring?
a reply to: paradoxious
Thanks for that, I'll check out wiki about it
I sort of "get it" from seeing our weather maps on the nightly TV News, but they often only put a couple of readings on, and the L for Low and H for High of course, Low usually meaning rain, high usually Fine
Thanks for that, I'll check out wiki about it
I sort of "get it" from seeing our weather maps on the nightly TV News, but they often only put a couple of readings on, and the L for Low and H for High of course, Low usually meaning rain, high usually Fine
I can't wait until the data comes out from NIED for the 7th JST tomorrow,
GFZ are showing
2016-10-07 00:14:21 5.0 Hokkaido, Japan Region
2016-10-06 15:52:01 5.7 Taiwan Region
the
2016-10-06 10:23:00 5.1 Southeast of Honshu, Japan came out from NIED/JMA at 4.7
The reason I can't wait, is to see what happens with the Split FE_region graph
theoretically the Blue Ryukyu/Taiwan and the Yellow Hokkaido lines should jump out above the rest.
So far since I have been doing these it has been the same old regions with roughly the same peaks and lows, and its getting pretty boring
Do you guys understand what the graphs show?
or do I need to write a description on the Navigation Page?
originally posted by: muzzy
a reply to: paradoxious
Thanks for that, I'll check out wiki about it
I sort of "get it" from seeing our weather maps on the nightly TV News, but they often only put a couple of readings on, and the L for Low and H for High of course, Low usually meaning rain, high usually Fine
Might be worthwhile to check the wiki article on atmospheric pressure too.
Wikipedia on Atmospheric Pressure
In a nutshell, at mean sea level and an average air pressure of 1013.35 hPa, the air is pressing down on the surface with the equivalent of about 14.7 pounds of pressure per square inch, or 10.1 Newton per square centimeter.
Here's the link for pascal (I should have included that above):
Wikipedia on Pascal
edit on 7-10-2016 by paradoxious because: correct link formatting
a reply to: paradoxious
Thanks.
if I was a Pilot or a Diver hPa would be very important!
i will keep an eye on the earthwindnullschool map and see how often the low hPa matches the quakes.
Thanks.
if I was a Pilot or a Diver hPa would be very important!
i will keep an eye on the earthwindnullschool map and see how often the low hPa matches the quakes.
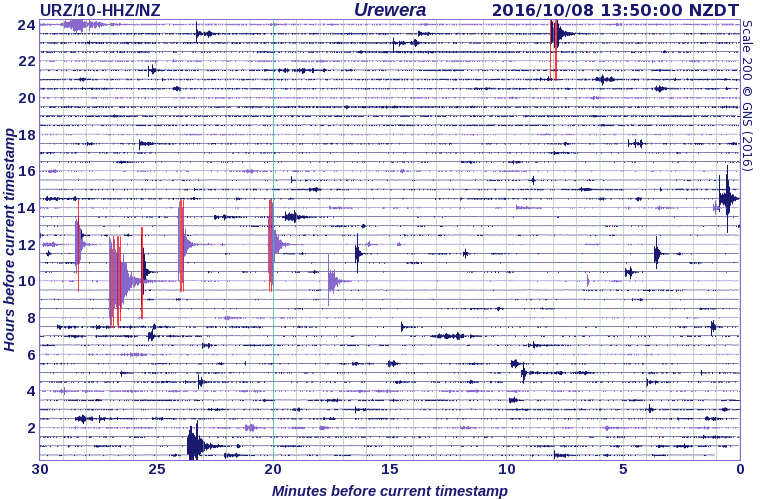
Small Swarm at Kawerau early this morning
Time UTC, Mag, Depth
07/10/2016 12:21:28, 1.86, 6.29
07/10/2016 12:51:25, 2.25, 6.29
07/10/2016 12:55:51, 2.50, 5.82
07/10/2016 12:59:42, 2.56, 5.59
07/10/2016 13:33:23, 1.86, 6.52
07/10/2016 13:46:14, 1.98, 6.52
nzeq2016.blogspot.co.nz...
Seems to have eased off at East Cape
I spotted that Swarm from the new (again!?!) thumbnails on the blog opening page,
and this is exactly what I had in mind with this style of thumbnail.
its like a "heat map" without the colours of course, but you can definitely see where all the action was that day by the density of the overlapped clear square icons.
I seen the darker patch and thought "thats interesting" and investigated further.
You wouldn't have seen them on the NZTopo map when you opened that as at that height such a small swarm is just a whole bunch of icons on top of each other, the green M2 square dominating on the top.
Geonet show it on the Urewera graph as well
a reply to: muzzy
I wiggled around with GEE this morning. My problem was that I had to uninstall the old version. The new download comes with an uninstaller for the old, that I had to open and run manually.
Then presto, the new one works...TERRIFICALLY!!!
The "add Network" function is operational again. [I'm dancing a happy jig]
So now, I can load all of the UW stations on Mt. Rainier, the CC network stations around Newberry volcano, and other favorites.
So, so happy. Thank you University of South Carolina!
And, the amplitude scale on the left of the seismograms is back to 'microns', instead of 'counts'.
earthquake.usgs.gov...
Mariana Islands. 5.6M An approaching low is about to hit the epicenter. Low pressures push water ahead of them, which why I'm counting this. There's a big storm along with low pressure. prssure 1004
Mariana Islands. 5.6M An approaching low is about to hit the epicenter. Low pressures push water ahead of them, which why I'm counting this. There's a big storm along with low pressure. prssure 1004
further to: muzzy
Well I got what I wanted (something different on the daily graph)
but not what I was expecting,
The Hokkaido one was way over priced at 5.0mb on GFZ, NIED/JMA only gave it a 4.2 (yellow line)
Also of interest is the two lines for Kurile Is (green) and Izu Is (deep pink) coming together like they did on the 4.3 line half an hour apart. They both only have one other quake each, that is why the two lines are straight, but angled.
I'm going to have to write a description for the graphs, as currently I have words and pic's about the RedLine graphs
edit on 1000000028128116
by muzzy because: (no reason given)
new topics
-
Las Vegas UFO Spotting Teen Traumatized by Demon Creature in Backyard
Aliens and UFOs: 2 hours ago -
2024 Pigeon Forge Rod Run - On the Strip (Video made for you)
Automotive Discussion: 2 hours ago -
Gaza Terrorists Attack US Humanitarian Pier During Construction
Middle East Issues: 3 hours ago -
The functionality of boldening and italics is clunky and no post char limit warning?
ATS Freshman's Forum: 4 hours ago -
Meadows, Giuliani Among 11 Indicted in Arizona in Latest 2020 Election Subversion Case
Mainstream News: 5 hours ago -
Massachusetts Drag Queen Leads Young Kids in Free Palestine Chant
Social Issues and Civil Unrest: 5 hours ago -
Weinstein's conviction overturned
Mainstream News: 6 hours ago -
Supreme Court Oral Arguments 4.25.2024 - Are PRESIDENTS IMMUNE From Later Being Prosecuted.
Above Politics: 8 hours ago -
Krystalnacht on today's most elite Universities?
Social Issues and Civil Unrest: 8 hours ago -
Chris Christie Wishes Death Upon Trump and Ramaswamy
Politicians & People: 8 hours ago
top topics
-
Krystalnacht on today's most elite Universities?
Social Issues and Civil Unrest: 8 hours ago, 9 flags -
Weinstein's conviction overturned
Mainstream News: 6 hours ago, 7 flags -
Supreme Court Oral Arguments 4.25.2024 - Are PRESIDENTS IMMUNE From Later Being Prosecuted.
Above Politics: 8 hours ago, 6 flags -
University of Texas Instantly Shuts Down Anti Israel Protests
Education and Media: 10 hours ago, 6 flags -
Massachusetts Drag Queen Leads Young Kids in Free Palestine Chant
Social Issues and Civil Unrest: 5 hours ago, 4 flags -
Meadows, Giuliani Among 11 Indicted in Arizona in Latest 2020 Election Subversion Case
Mainstream News: 5 hours ago, 4 flags -
Chris Christie Wishes Death Upon Trump and Ramaswamy
Politicians & People: 8 hours ago, 2 flags -
Any one suspicious of fever promotions events, major investor Goldman Sachs card only.
The Gray Area: 12 hours ago, 2 flags -
Gaza Terrorists Attack US Humanitarian Pier During Construction
Middle East Issues: 3 hours ago, 2 flags -
2024 Pigeon Forge Rod Run - On the Strip (Video made for you)
Automotive Discussion: 2 hours ago, 1 flags
active topics
-
Supreme Court Oral Arguments 4.25.2024 - Are PRESIDENTS IMMUNE From Later Being Prosecuted.
Above Politics • 74 • : Threadbarer -
Meadows, Giuliani Among 11 Indicted in Arizona in Latest 2020 Election Subversion Case
Mainstream News • 9 • : Oldcarpy2 -
University student disciplined after saying veganism is wrong and gender fluidity is stupid
Education and Media • 50 • : watchitburn -
VP's Secret Service agent brawls with other agents at Andrews
Mainstream News • 55 • : CarlLaFong -
Cats Used as Live Bait to Train Ferocious Pitbulls in Illegal NYC Dogfighting
Social Issues and Civil Unrest • 23 • : Ravenwatcher -
-@TH3WH17ERABB17- -Q- ---TIME TO SHOW THE WORLD--- -Part- --44--
Dissecting Disinformation • 680 • : 777Vader -
Is there a hole at the North Pole?
ATS Skunk Works • 40 • : Oldcarpy2 -
Fossils in Greece Suggest Human Ancestors Evolved in Europe, Not Africa
Origins and Creationism • 89 • : whereislogic -
University of Texas Instantly Shuts Down Anti Israel Protests
Education and Media • 197 • : NorthOS -
Candidate TRUMP Now Has Crazy Judge JUAN MERCHAN After Him - The Stormy Daniels Hush-Money Case.
Political Conspiracies • 790 • : Oldcarpy2