It looks like you're using an Ad Blocker.
Please white-list or disable AboveTopSecret.com in your ad-blocking tool.
Thank you.
Some features of ATS will be disabled while you continue to use an ad-blocker.

Quake Watch 2016
page: 57share:
a reply to: crappiekat
Thanks for the quick reply.
No, I meant the Bing maps which you access by clicking on the Bing Map words or in the case of Kumamoto the numbers like 45th, 46th, etc
the NZTopo map works fine, that's the ones you are talking about and can see immediately when you open a page.
BTW with the Japan maps you have to click on Map or Satellite or use the slider to bring the background map up.
NZ Topo hasn't branched out beyond NZ yet.
If Bing won't work I'll have to dump that part. It was handy becasue you got a list on the side menu to match the map. NZTopo won't give you a list.
Another option is just to give the Google Earth KML, which I did on my N blogs back 5 + years ago, but you have to have Google Earth installed on your reading devise.
here is an example link to a Bing Map Kumamoto 73rd map
can you try that?
even if you get the error message, does it have "&ignoreoptin=1" at the end of the address on your browser (up the top)
I think that is the problem, its something I haven't seen before in the browser addresses "........&ignoreoptin=1"
I have wasted half the day already trying to figure out what is wrong. I'll leave it for now and hope it comes right tomorrow.
At least NZ Topo still works.
edit on 0900000025925916 by muzzy because: (no reason given)
Oh Muzzy,
Here's the funny thing about the full moon that I've noticed. As I've stated, the lunar effect doesn't always happen at "high noon". For example, over the last day or so, things have been calm. Of course, Vanuatu has chimed in with a 6M. but, that's not big or unusual for that particular spot. Overall, it's quiet. It was that busy leading up to the full moon either. And I don't know what to expect as we slip away from perigee which peeks tonight I think. And is perigee the far away, or apogee...
I have mild dyslexia. However, when it comes to words like right and left, clockwise or counter-clockwise, I'm always lost. Even when I used to work on tractor and equipment everyday, I had to tell myself, everything I had to deal with bolts and screws, lefty loosey, righty tighty. And further still, I would then have to explain to myself which was my right side and which was left side. In the army, I was the guy ahead of me, worst nightmare. I would get my feet mixed up and kick he or she in the heels.
What's it called when you mix up words and the order of sentences?
Does anyone know?
I'm making my kid laugh when I make up words and screw up sentences until they have little to no sense. I actually write better than I speak.
Oh, and Nevada. It still is on the low end of activity, but yet it is still plugging along.
I'd ask you to do a graph, but I think it's so obvious there's no point.
And nothing happened in Taiwan or China. But I'm still watching....
Oops, I got it wrong, we are at perigee, and that's the closest point, duh. We hit it on Sept 18. So, if there is anything to happen due the lunar "pump" then it should be after the moon hits it's closest point and then starts to move away. I believe, that this small force, (relatively speaking) the change between the moon approaching the earth, and then the shift in direction, to that of pulling away from the earth. The change is where I think the mixing takes place.
Water travels in all directions. When you have the lunar shift, this disturbs everything. So, up is down, right is left, and differing waters (depending on heat, and chemical content, including gas and solids) move passed each other like on a crowded Manhattan City street. Make that like Japan at a subway station. The movement seems chaotic, but there is a definite order to the madness.
As for someone predicting a lottery, that's not what I mean. The only thing we can predict about who will wins is that eventually someone will win no matter how long the odds. And I do think we can model things to where we may not predict the exact moment or area where a rupture will happen, but rather, as they are already, scientist give odds.
And the odds change depending on what they find out about he history of a fault, and the patterns of it's recent behaviour.
The odds on that Cascadian fault have changed often over the years. Simply, the odds are saying it will be sooner rather than later.
sorry.
Oh, yesterday, Kansas had three over 3M. Stupid drillers.
Just ran across this while wilfing,
when I was doing some research on mines!
Haven't see it anywhere else yet.
USGS upgrades Oklahoma's 5.6 on Sept. 3rd, to a 5.8.
stateimpact.npr.org...
SOURCE: StateImpact Oklahoma
WOQ
Also expanding limits on injection wells.
The article is a little confusing though.
Upped the number of wells from 37 to 67 in a two county area.
But it also says they are only restricting the amount injected,
not shutting the new ones down & some of the original ones
will be allowed to resume injecting, but in smaller volumes!
kgou.org...
edit on 17-9-2016 by wasobservingquietly
because: (no reason given)
a reply to: ericblair4891
A few years ago I made a graph showing earthquakes 6+, Moon Phases and Solar Flares. Unfortunately didn't keep the Excel file, I'm sure I loaded the screenshot to ATS, but I can't find it right now.
This weekend I made a new more complex 2016 graph showing Earthquakes over 5.5 (IRIS data), Moon Phases (fourmilab), Solar Flux (Space Weather Canada and Solarham), Solar Flares (Solarham) to see if there was any developments along these lines.
rightclickviewimageforfullsize
What I see from the graph;
4 major peaks of solar flux
4 clusters of solar flares
4 major quakes over 7.4
Looks promising, could there be a match?
3 of the major quakes occurred "just after"* a solar flare cluster or high flux reading, by 16 days (Feb 15-Mar 2), 5 days (July 24-29), and 12 days (Aug 7-19)
*I say "just after", 12 and 15 days is a long time, but the solar flux and flares are so far apart that just after is relative.
and one occurred 1 day before a solar flare (Apr 16-18)
one high flux reading did not produce a flare or a major earthquake but did produce a 7.2 (May28)
one solar flare did not produce a major quake (Jan 2)
As for the Full and New Moon and Perigee (close in) and Apogee (far away) I really can't see how it has any influence on earthquakes.
All those Moon positions/phases are quite regular, at least twice a month, so if they did influence big earthquakes there should be regular earthquakes too at the same rate. There isn't.
There is no use looking at quakes below M7.4, as there are so many of them one or two are always going to fit into the period before or after a Moon position/phase regardless.
I suppose at a stretch you could say that;
2 of the major quakes occurred as the Moon was coming in towards Earth, but 2 didn't, the SW of Sumatra quake of March 2 was as the Moon was traveling away, the Sth Georgia Is one occurred just as the Moon was about to reach its furthest point from the earth in August.
I'm not too clear as to what solar flux is, but it does tend to proceed a solar flare (well 3 out of 4 times this year). That is something to keep an eye on, High Flux + Solar Flare = Big Quake?
or another way to look at it is; based on 2016 data there is a 75% chance that a High Flux will produce a Solar Flare and if that happens there is a 75% chance the two combinations will precede a Big Quake.
Whats that overall? 75% of 75% = 56.25%
50/50
So at least for year 2016 the results are inconclusive, it doesn't give any indication where that big quake might be at all, so what use is it knowing this, should everyone on the planet be on high alert every time there is a High Flux + Solar Flare scenerio developing?
More research is required, over a longer time period. Funding is non existent, so it may take a while.
2105 looks interesting, a lot more Solar Flares for a start.
Here are the resources I used (as mentioned in the intro)
IRIS Wilber3)
Moon Phases (fourmilab)
Solar Flux (Space Weather Canada)
Solar Flares (Solarham)
Solar Flux 2 (Solarham)
If this pans out, maybe we should be watching the Solar Flux daily rather than scanning the various network earthquake sites after the fact.
The Solar Flux is at a low point today 80.8
I might make it a daily point of keeping a graph, seeing as the Bing Map thing seems to have collapsed in a heap of not available files, man I spent a lot of time making those
edit on 0900000026026016 by muzzy because: spelling fixed
edit on 0900000026026016 by muzzy
because: stuffed up one of the links, fixed it
a reply to: muzzy
You're a pain. Don't tell me I got learn something new. Ah man, that means something will get pushed out the other side of my brain. There's only so much room. I'm going to forget how to tie my shoes soon.
I like your graph because I can see the little moons. Also, I going to have to look at the solar flux and CMEs. It's only fair since I claim that CMEs are just like VMEs. If there is a correlation to the sun, the you'd have to figure out what's doing what to what and when.
And you are right, the moon connection only comes out in big data sets as a probability, and even then, the influence only shows up as a small part. You may be right and there's another force that acts on the faults. I think there are many factors.
And, they can act upon other parts. Let me use and example in weather that might apply to the sun and earth, and the inner earth. The earth's layers means the earth doesn't act in a constant. We are magnetic and throw off energy. Let's think the earth's orbit in relation to the sun. We also have periodic CMEs. The orbit and energetic solar winds could make the earth super charged. Just like when a thunderstorm pulls up energy from the ground. Lightning goes up first then down.
If the sun energizes the earth in a similar way, maybe that energy transfer acts upon the plates and or, fault-lines.
Oh, and for the moment, things are still a bit on the low end of background levels. It's boring.
That's how I roll. You are the graph god, and I, get either very bored, or very excited. That's how I know things cluster. Either, I'm watching paint dry on a wall. Or, I'm trying to keep up to the unique or strange clusters. When things are normal, and we have an average amount of earthquakes, I feel like everything is okay...
Right now, it's not exactly normal. Slow, boring.
So, if the moon has little effect, then after we shift, we get nothing. I'm still waiting to see if things pick up. Also, when I look at the moon's orbit, I also think of our position in our orbit, and see there is an influence when earth changes seasons, and we are either closer to the sun, and moving away. The tricky part in trying to follow the moon's movements is that it is spinning around us, as we are spinning around the sun. And if that wasn't bad enough, the orbit is not equal and the big eggshaped route makes it worse. I'm dizzy, like riding a spinning cup ride at the fair...
a reply to: ericblair4891
hey they are giving me a headache trying to understand them too.
I did another one for 2015, but because there were so many solar flares (120) it made a mess of the graph, so I narrowed it down to just CME's (27) for clarity. FWIW 2016 has only had 3 CME's.
I made the "earthquakes" part to those just above M7.4, so that I could then run error bars up to the top of the graph (those pink bars) and see more clearly how they fitted, before or after CME's or Solar Flux's.
rightclickviewimageforfullsize
2015 shows 8 clusters of CME's above M1.6 (pink balls with M# underneath).
2 are Earth Directed (ED), 4 are Partial Earth Directed (PED). I thought when I seen that in the data that there may be some signiicance to this, but in fact the 3 ED or PED clusters didn't produce any earthquakes soon after at all. By soon after I'm talking about soon being within 15 days like in 2016.
So just looking at 2015 in isolation, a ED or PED CME means "NO major earthquakes for 15 days"
Not what I was expecting.
also 8 earthquakes above 7.4 (red dots and reddish error bars going up)
flux's are harder, because there are 11 flux peaks in 2015 over 128 (blue x's and blue trendlines)
4 CME's are just after a Flux peak,
only 1 of the major quakes occurred "just after" a solar flare cluster, the (M2.2/NEPAL7.8), 2 occurred just before, the (X2.7/NEW BRITAIN7.5) and the (M2.1/CHILE8.3)
so that leaves 5 that don't fit close either side of CME's
So what about matching the flux's?
4 earthquakes are after a flux over 126, 1 is before, the (X2.7/NEW BRITAIN7.5) again
that leaves 3 that are in a trough or just starting to go up out of the trough
I'll go back to 2016 now and try and match the format of the graph to 2015, then it might be easier to compare them.
If I can find earlier Solar Flare data I will go back further than 2014, and join all the graphs together, that solar flux looks interesting long term, it seems to be going steadily down overall Jan 2015-Sept 2016 from 16.58 on 28 Jan 2015 to a low of 7.06 on 28 July 2016
Maybe I should start a new topic on this, separate from Quake Watch, might draw in the Space guru's to set us straight about the Solar thingy.
follow up to post by : me
Looks like Bing Maps has gone the way of Classic Google Maps = not user friendly
They are still not working on my Japan, eqarchives or NZ blogs
what a waste of my time thinking they would be a substitute for Google
I read this forum topic Radio Discussion - Problems with Bing Maps on FCC FM Query about the issue, it is all I can find on the web about it. The discussion dates from Nov 2015, so its like the Google mess, a time delay for it to take effect down here in NZ. That would explain why some North American readers off ATS couldn't see the Bing Maps, they were opening on their own location with no earthquakes file on it.
The radio people are opting for what I thought I would have to end up doing, just to put a link on the page with the KMZ/KML file and hope the readers have got Google Earth, and bother to use it. Its the only way to see the icons on the maps with a list on the side.
What the heck is wrong with these interactive map program suppliers, it seems they are doing everything they can to stop people using their services. Just doesn't make sense at all.
Bye Bye Bing
edit on 0900000026326316 by muzzy because: (no reason given)
edit on 0900000026326316 by muzzy because: (no
reason given)
japanquakes is now showing ALL quakes per day on NZ Topo Maps, not split into ~1 (the old Bing Maps) and
1+ maps (NZ Topo)
And I have changed to making the "day" JST
one advantage of this is that previously using UTC we were always half a day behind. between the data available and the map.
I'm showing the KMZ file link as well for those that want/need a list on the side.
On the KMZ file the time on the sid elist is JST, this may assist in finding a particular event, I know I do somethimes go looking for something I seen on GFZ and the only way to find it is to match the UTC time.
See how it goes.
As far as Kumamoto goes, it is already broken into 3 NZ Topo Maps, I will keep adding to that last one, that starts at the 5.2 of 31/8/16, right now its at 3420 before I add the last 4 days worth of data, should be good for a while.
The 197 area and magnitude graphs might as well continue, the area graph is handy to see if there is a big change in location of events that you can't see on the big map.
The Bing maps on that page will be deleted.
In a couple of days Kumamoto will pass 20,000 aftershocks @158 days, getting very close to the El Mayor-Cucapah, Cali/Mex 2010 series which had 23,042 at the same time mark
edit on 0900000026426416 by muzzy because: (no reason given)
a reply to: muzzy
I was just thinking to myself, it's kinda quiet. Then I checked the map, and the last hour saw a little clustering in and around South East Asia and Islands. China, and Japan is looking bumpy. Is it my imagination, or has the last few weeks in Japan showing a bit of an uptick. I'm only half paying attention, and I started to look at Japan Maps but have to go now...
I thought for a second Taiwan had on but nope.
a reply to: ericblair4891
Yeah it is quite quiet, you can usually tell it is quiet by looking at a Geofons list, if they are listing 4.5s it's quiet.
Been a few odd locations popping off in the last week like NW of Madagascar, Mozambique and Black Sea etc
China hasn't had any 5s for awhile either then two within 1 hr at the same location in Sichuan
edit on 0900000026526516 by muzzy because: (no
reason given)
Just had a 2 hour long Windows 10 update.
When I finally get to use my computer again (they don't even ask any more);
I find that my settings for the Japan and NZ pie charts on Excel are all messed up and my Snagit screenshot is off centre.
WTF?
More time spent resetting everything to where it was before.
I'm so close to giving up on the whole publishing on the internet thing, everything keeps changing and there is no continuity on anything.
originally posted by: radpeteage
Uh ooooo. 6.4 at the junction, close to Tokyo..
Not good!!
Don't know how to post link. :/
a reply to: radpeteage
USGS -
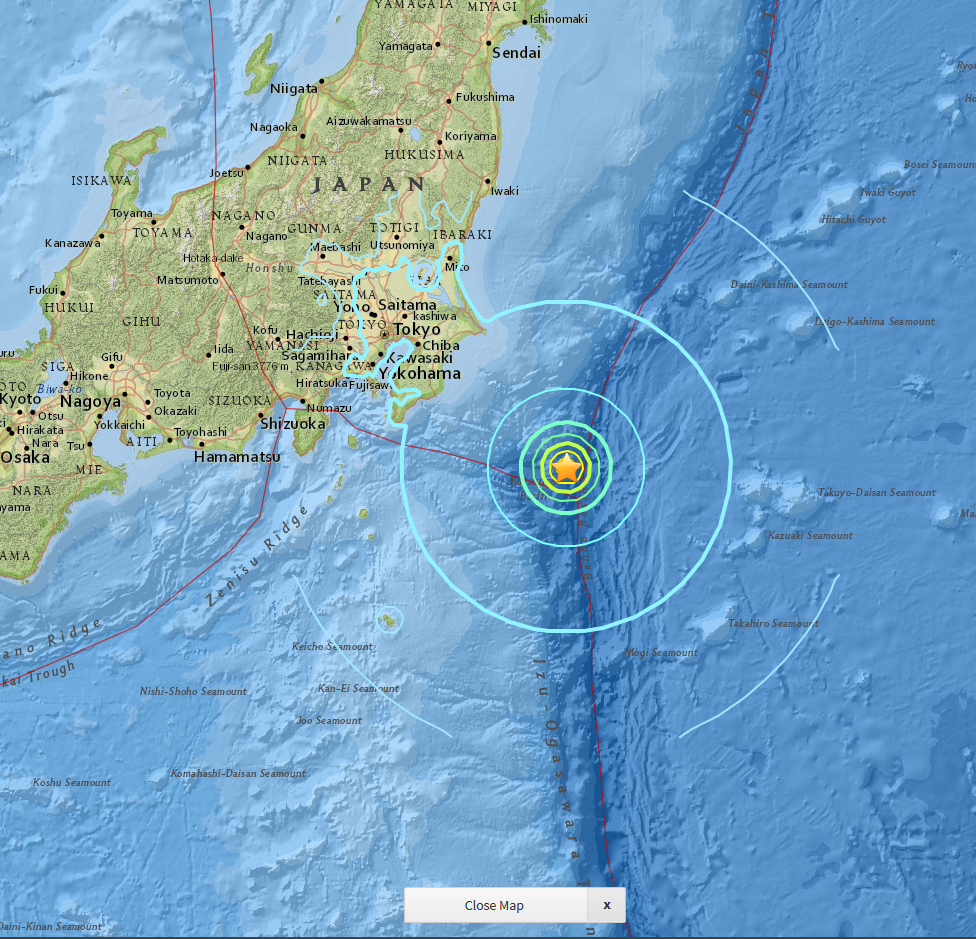
M6.4 - 149km ESE of Katsuura, Japan
2016-09-23 00:14:33 UTC 34.499°N 141.747°E 10.0 km depth
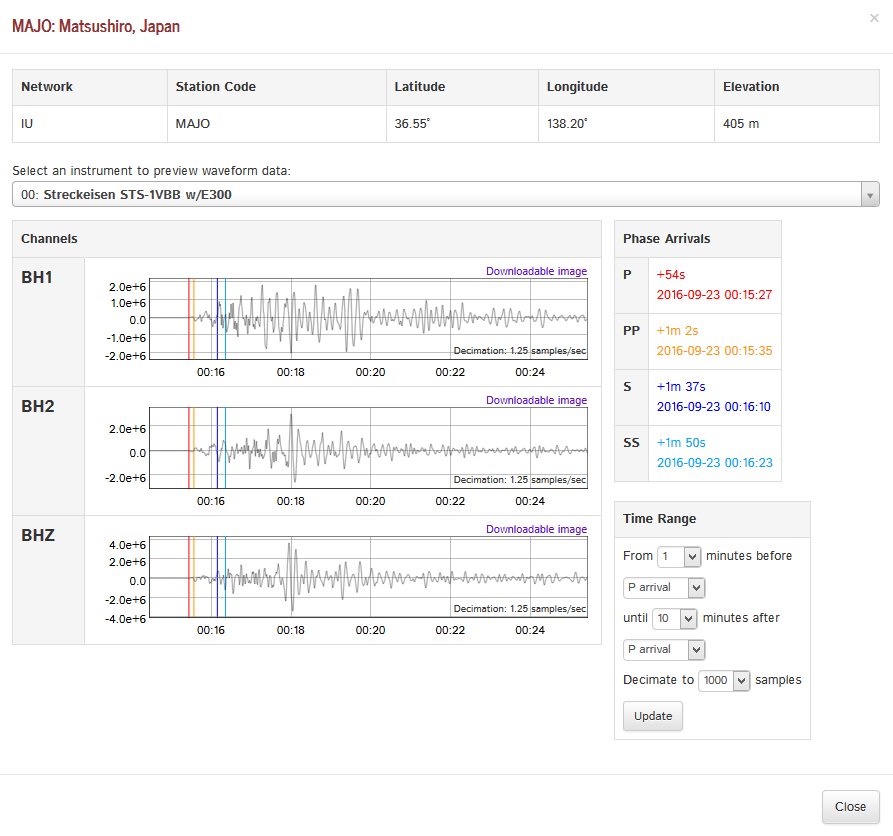
6.4 is not too bad for them over there except for the fact that it took place near their triple junction. If this is a foreshock, Tokyo might be in the path of something not nice.
Hopefully nothing comes of this other than your standard aftershock sequence.
I am sure one of our more knowledgeable folks will be along shortly to provide more detail.
USGS -
M6.4 - 149km ESE of Katsuura, Japan
2016-09-23 00:14:33 UTC 34.499°N 141.747°E 10.0 km depth
6.4 is not too bad for them over there except for the fact that it took place near their triple junction. If this is a foreshock, Tokyo might be in the path of something not nice.
Hopefully nothing comes of this other than your standard aftershock sequence.
I am sure one of our more knowledgeable folks will be along shortly to provide more detail.
edit on 22-9-2016 by jadedANDcynical because: added map
Well I'm not one of the "knowledgeable folk" LOL!
I Have been watching this. Could this be a foreshock? I dunno, but it has peaked my interest.
The link that I have for the "Japan earthquake info" has been 404'ed.
I Have been watching this. Could this be a foreshock? I dunno, but it has peaked my interest.
The link that I have for the "Japan earthquake info" has been 404'ed.
edit on 22-9-2016 by crappiekat because: (no reason given)
Thanks,
originally posted by: jadedANDcynical
a reply to: crappiekat
JMA
This is their 'USGS.'
Odd thing. That is the same link I have/had and for me it 404ed.
Biggest one in this series since the 5th Sept.
Public ID 2016p719587
Intensity strong
Universal Time September 23 2016, 5:56:27
NZ Standard Time Fri, Sep 23 2016, 5:56:27 pm
Depth 22 km
Magnitude 5.1
Location 65 km east of Te Araroa
Latitude, Longitude -37.42, 179.06
www.geonet.org.nz...
Public ID 2016p719587
Intensity strong
Universal Time September 23 2016, 5:56:27
NZ Standard Time Fri, Sep 23 2016, 5:56:27 pm
Depth 22 km
Magnitude 5.1
Location 65 km east of Te Araroa
Latitude, Longitude -37.42, 179.06
www.geonet.org.nz...
Firstly, please indulge me. If you've read my stuff, you'll have noticed I rant about fracking, and at times, I've described a bad sci-fi movie that
I'd write about the disaster. Well, someone must have stole my idea, and it's on Netflix, and it's called 10.0 Earthquake. WOW. I started watching it
last night. Only made it half way through. Will finish tonight. Won't say anymore...
Now, for the real earthquakes. Muzzy mentioned Africa. Well, yup, Africa has a few and I'm calling it a cluster. There was a 5.9M earlier this month. And now three more. The 5.9M was near a volcanic area near the big rift. Something may be brewing, and it may be volcanic. There is volcanic activity at this time, so, I mean more or bigger.
Yup, Asia seemed to cluster as well, and Japan is having a bunch. It was quiet, but now things seem to be shaping up, just as we slip into astronomical autumn in the north.
I looked up some sun stuff to check up on sunspots and stuff. It's quiet there too over the last year. hmmm I won't even bring up global warming. (good boy robin)
I just checked back at the map. Something is up in Japan. It's been busy all month. I don't think that 6. whatever was the big one. And, it's not a double tap. Not sure, but I'd call it swarm like and a cluster as well...
Heck, I could be wrong and nothing happens. But it looks like sumtin is up.
One last aside, watched Jaws 3 the other night, oh what joy.
edit on 23-9-2016 by ericblair4891 because: (no reason given)
new topics
-
Meadows, Giuliani Among 11 Indicted in Arizona in Latest 2020 Election Subversion Case
Mainstream News: 15 minutes ago -
Massachusetts Drag Queen Leads Young Kids in Free Palestine Chant
Social Issues and Civil Unrest: 30 minutes ago -
Weinstein's conviction overturned
Mainstream News: 1 hours ago -
Supreme Court Oral Arguments 4.25.2024 - Are PRESIDENTS IMMUNE From Later Being Prosecuted.
Above Politics: 3 hours ago -
Krystalnacht on today's most elite Universities?
Social Issues and Civil Unrest: 3 hours ago -
Chris Christie Wishes Death Upon Trump and Ramaswamy
Politicians & People: 3 hours ago -
University of Texas Instantly Shuts Down Anti Israel Protests
Education and Media: 6 hours ago -
Any one suspicious of fever promotions events, major investor Goldman Sachs card only.
The Gray Area: 8 hours ago
top topics
-
VP's Secret Service agent brawls with other agents at Andrews
Mainstream News: 17 hours ago, 11 flags -
Krystalnacht on today's most elite Universities?
Social Issues and Civil Unrest: 3 hours ago, 7 flags -
Weinstein's conviction overturned
Mainstream News: 1 hours ago, 6 flags -
Sunak spinning the sickness figures
Other Current Events: 17 hours ago, 5 flags -
Electrical tricks for saving money
Education and Media: 15 hours ago, 5 flags -
Supreme Court Oral Arguments 4.25.2024 - Are PRESIDENTS IMMUNE From Later Being Prosecuted.
Above Politics: 3 hours ago, 5 flags -
University of Texas Instantly Shuts Down Anti Israel Protests
Education and Media: 6 hours ago, 3 flags -
Any one suspicious of fever promotions events, major investor Goldman Sachs card only.
The Gray Area: 8 hours ago, 2 flags -
Massachusetts Drag Queen Leads Young Kids in Free Palestine Chant
Social Issues and Civil Unrest: 30 minutes ago, 1 flags -
Chris Christie Wishes Death Upon Trump and Ramaswamy
Politicians & People: 3 hours ago, 1 flags
active topics
-
University of Texas Instantly Shuts Down Anti Israel Protests
Education and Media • 133 • : DBCowboy -
Graham Hancock being proven right all along about ancient humans in America.
Ancient & Lost Civilizations • 106 • : JonnyC555 -
Supreme Court Oral Arguments 4.25.2024 - Are PRESIDENTS IMMUNE From Later Being Prosecuted.
Above Politics • 47 • : matafuchs -
Candidate TRUMP Now Has Crazy Judge JUAN MERCHAN After Him - The Stormy Daniels Hush-Money Case.
Political Conspiracies • 754 • : Threadbarer -
Massachusetts Drag Queen Leads Young Kids in Free Palestine Chant
Social Issues and Civil Unrest • 2 • : RazorV66 -
Meadows, Giuliani Among 11 Indicted in Arizona in Latest 2020 Election Subversion Case
Mainstream News • 1 • : IndieA -
Nearly 70% Of Americans Want Talks To End War In Ukraine
Political Issues • 84 • : DontTreadOnMe -
VP's Secret Service agent brawls with other agents at Andrews
Mainstream News • 48 • : 5thHead -
-@TH3WH17ERABB17- -Q- ---TIME TO SHOW THE WORLD--- -Part- --44--
Dissecting Disinformation • 673 • : Thoughtful3 -
SETI chief says US has no evidence for alien technology. 'And we never have'
Aliens and UFOs • 66 • : SchrodingersRat