It looks like you're using an Ad Blocker.
Please white-list or disable AboveTopSecret.com in your ad-blocking tool.
Thank you.
Some features of ATS will be disabled while you continue to use an ad-blocker.

Quake Watch 2016
page: 32share:
a reply to: ericblair4891
It has been pretty quiet for a while here, apart from that 1tth Apr Mt. Holdsworth
Even the Kermadec's aren't putting out much
It has been pretty quiet for a while here, apart from that 1tth Apr Mt. Holdsworth
Even the Kermadec's aren't putting out much
a reply to: muzzy
Aftershocks are headed back east towards Carterton, which is good I guess.
Confirms what I was saying about the Graben being the cause, rather than uplift of the Tararua Mts.
interactive Geonet quake map
Aftershocks are headed back east towards Carterton, which is good I guess.
Confirms what I was saying about the Graben being the cause, rather than uplift of the Tararua Mts.
interactive Geonet quake map
originally posted by: ericblair4891
a reply to: muzzy
Muzzy, hold on to something. Every time I see an update it's New Zealand. The first was Christchurch and now there's three on the North Island in a line. I hope this is one of those multiple small movements that alleviate stress.
Busy place.
Sorry, first attempt at this. I love reading this thread though. Maybe I should just lurk.
edit on 11-5-2016 by Onesmartdog because: (no
reason given)
a reply to: muzzy
have updated that.
Brought in the Amasuka Region, which I had missed before, just had W of Amasuka.
Its getting a bit cramped near the end of the graph, but you need to look at the whole time period to be able to get the point. I could make it wider, but I need to leave room for more events before I expand it further.
W off Amakusa Is/Amakusa Region over the SW of Kyushu events and the Kumamotos series timeline graph
and the
page where it came from. Hopefully it doesn't take forever to load for you, there are a lot of maps on there.
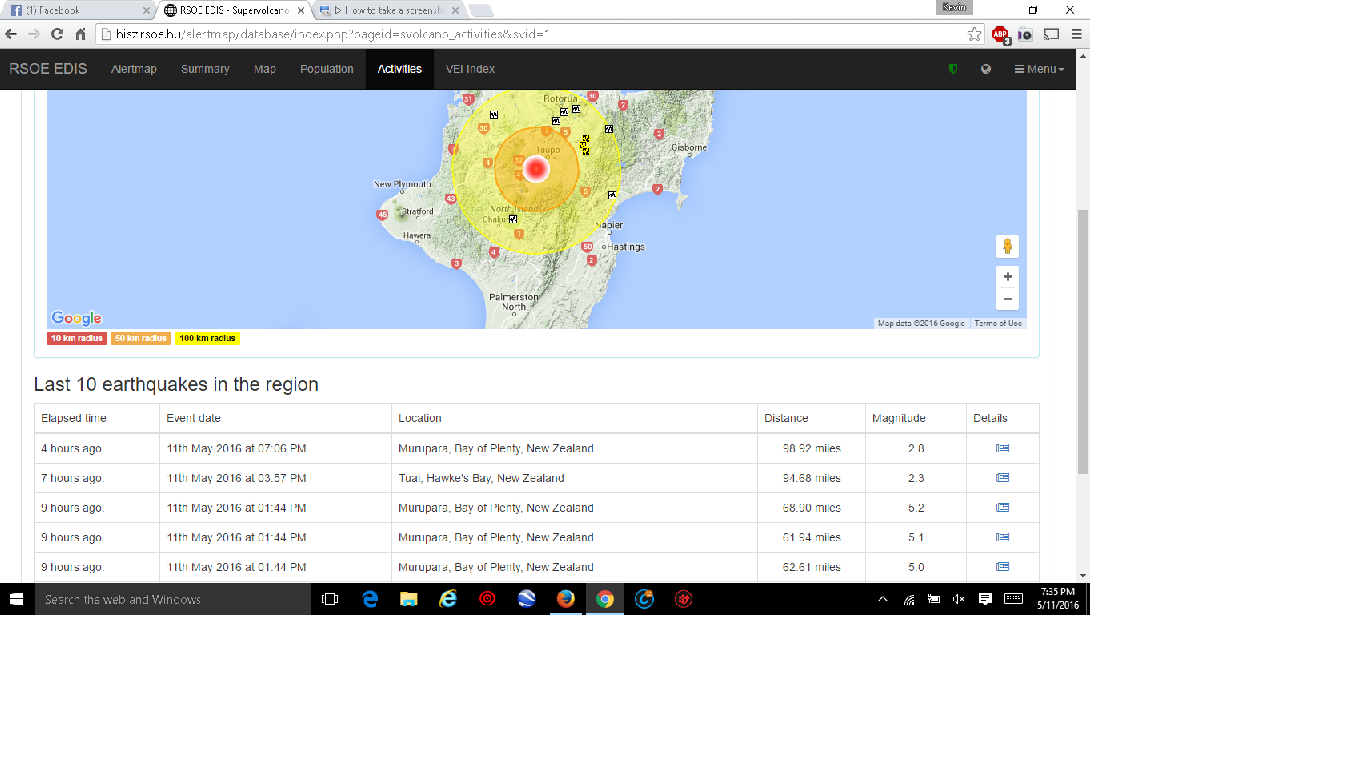
Now back to my own back yard and get 11.05.2016UTC map done. Will update the Mt Holdsworth series as well.
Not as many events as I thought there would be only 65 for the whole country for the 24hr period, about average.
have updated that.
Brought in the Amasuka Region, which I had missed before, just had W of Amasuka.
Its getting a bit cramped near the end of the graph, but you need to look at the whole time period to be able to get the point. I could make it wider, but I need to leave room for more events before I expand it further.
W off Amakusa Is/Amakusa Region over the SW of Kyushu events and the Kumamotos series timeline graph
and the
page where it came from. Hopefully it doesn't take forever to load for you, there are a lot of maps on there.
edit on 0500000013113116 by muzzy because: (no reason given)
Now back to my own back yard and get 11.05.2016UTC map done. Will update the Mt Holdsworth series as well.
Not as many events as I thought there would be only 65 for the whole country for the 24hr period, about average.
edit on 0500000013113116 by
muzzy because: (no reason given)
a reply to: Onesmartdog
yeah a few moderate sized quakes in the last 24 hrs, more than normal background activity that's for sure.
Lucky for clarity they all fell within the UTC definition of a "day"
nzeq2016.blogspot.co.nz...
Not a heck of a lot of energy released though, even with two high fours and two low fives, only 1942.998 TTNT
Oh just to clarify, before I update the Mt Holdsworth page, todays moderate events were 4.66 and 5.16, Geonet round the numbers off to one decimal point on the public pages,
so these less than the original 11th Apr 5.2, there fore aftershocks (ie this is not a "swarm" as such,
but close
Mt Holdsworth page updated
not too happy with the graph, like the Kyushu/Awasuka/Kumamoto graph because its so long a time period ( 1 month in this case) the new stuff is very compressed at the end of the graph
I have an idea to do two graphs and another map showing the split timewise, but I'll need to make some new icons and load them to Dropbox first. Luckily the weather is crappy here right now, strong winds, rain coming and I have some spare time.
yeah a few moderate sized quakes in the last 24 hrs, more than normal background activity that's for sure.
Lucky for clarity they all fell within the UTC definition of a "day"
nzeq2016.blogspot.co.nz...
Not a heck of a lot of energy released though, even with two high fours and two low fives, only 1942.998 TTNT
edit on 0500000013113116 by muzzy because: (no reason given)
Oh just to clarify, before I update the Mt Holdsworth page, todays moderate events were 4.66 and 5.16, Geonet round the numbers off to one decimal point on the public pages,
so these less than the original 11th Apr 5.2, there fore aftershocks (ie this is not a "swarm" as such,
but close
edit on 0500000013113116 by muzzy because: (no reason given)
Mt Holdsworth page updated
not too happy with the graph, like the Kyushu/Awasuka/Kumamoto graph because its so long a time period ( 1 month in this case) the new stuff is very compressed at the end of the graph
I have an idea to do two graphs and another map showing the split timewise, but I'll need to make some new icons and load them to Dropbox first. Luckily the weather is crappy here right now, strong winds, rain coming and I have some spare time.
edit on 0500000013213216 by muzzy because: (no reason given)
originally posted by: muzzy
not too happy with the graph, like the Kyushu/Awasuka/Kumamoto graph because its so long a time period ( 1 month in this case) the new stuff is very compressed at the end of the graph
I have an idea to do two graphs and another map showing the split timewise, but I'll need to make some new icons and load them to Dropbox first. Luckily the weather is crappy here right now, strong winds, rain coming and I have some spare time.
That didn't take too long
I wanted to see for sure the spread of the two M5's aftershocks. Yup moving SW. The Bing map version is the best in this case. The map below shows the two aftershock sequences split by colour, blue are the original 5.2 aftershocks and the red are the 5.16 aftershocks, green is the single foreshock. The size of the icon shows the magnitude.
Split Map
edit on 0500000013213216 by muzzy because: now I have made those icons I can use them elsewhere to split parts of series
After the large quake Taiwan had in Feb 2016, they just had another one - 5.6, originally assessed as a 5.9 by the USGS.
www.channelnewsasia.com...
Sounds like some power outages and people trapped in elevators but no reports of major damage or loss of life.
www.channelnewsasia.com...
Sounds like some power outages and people trapped in elevators but no reports of major damage or loss of life.
a reply to: StoutBroux
yep,
5.8ML
then
5.5ML
couple of 4.4's and a 4.0 and high threes too Central Weather Bureau Taiwan
yep,
5.8ML
then
5.5ML
couple of 4.4's and a 4.0 and high threes too Central Weather Bureau Taiwan
Muzzy, I've been keeping a rough daily total for Mexico. So, I wouldn't be asking if I thought it was about it's "normal" amounts. However, and I'm
not trying to to forget or ignore that 6M recently, it again seems like Mexico is above, even it's recent high number of earthquakes. The daily lists
contains 100. I'm having to change settings just to look at one day and make sure I'm getting all the updated earthquakes.
Oh, and Nevada/Empire swarm is still popping off with ones around 2.5M
Oh, and Nevada/Empire swarm is still popping off with ones around 2.5M
further to: muzzy
a reply to: StoutBroux
JMA reckon they were 6.5ML and 6.4ML;
JST, UTC, Lat, Long, Mag, Type, TTNT, Depth, Location
12/05/2016 13:29:57JST, (04:29:57UTC), 24.698, 121.998, 6.4, ML, 60035.5, 31, TAIWAN REGION
12/05/2016 12:17:15JST, ( 03:17:15UTC), 24.659, 121.924, 6.5, ML, 84802.4, 36.7, TAIWAN REGION
Their Aqua Division hasn't converted to Mw, I guess they have enough on their plate with earthquakes in their own country.
edit on 0500000013313316 by muzzy because: (no reason given)
a reply to: ericblair4891
Are you asking for a Mexican timeline versus magnitude graph? over a month? or longer?
Don't forget it's magnitude not numbers that counts.
Ill see what I can do after I get Japans daily troubles out of the way
FWIW SNN had 72 events for 12/05/2016
www2.ssn.unam.mx:8080...
Are you asking for a Mexican timeline versus magnitude graph? over a month? or longer?
Don't forget it's magnitude not numbers that counts.
Ill see what I can do after I get Japans daily troubles out of the way
FWIW SNN had 72 events for 12/05/2016
www2.ssn.unam.mx:8080...
a reply to: muzzy
I know you like magnitude. I was thinking it's both really. There's more and they've been getting a bit bigger. Today, some of the latest have been around 4 and above, whereas, previously they've all been give or take 3.5 Mish.
Just look. If the numbers aren't interesting, don't worry too much.
But the average recently has been 50 plus a day.
a reply to: ericblair4891
No problem, it has been 50 days since you asked about Mexico (when I did the last graph) i can handle that.
I had the pre 24th March data already.
yes the numbers are on the up and up, especially the last week
Mex. timeline to May 13
each number at the bottom is the day number from Jan 1.
the yellow totem pope is when I did the last graph.
edit on 0500000013313316 by muzzy because: Sorry no more direct images on ATS, I refuse to be bullied into turning off Adblock just to use the
ATS image loader
Muzzy, Thank for the reply. Learning as I track this thread. Thank you !
edit on 13-5-2016 by Onesmartdog because: (no reason given)
Note about change on graph in post by: muzzy
I added some value to the numbers graph by making the days with M6 quake full Red and days with 5's Orange.
Shows that having a M6 or M5 doesn't always correlate to big numbers of quakes in 24hrs, although it did twice.
Like just about everything to do with earthquakes, its pretty random
I added some value to the numbers graph by making the days with M6 quake full Red and days with 5's Orange.
Shows that having a M6 or M5 doesn't always correlate to big numbers of quakes in 24hrs, although it did twice.
Like just about everything to do with earthquakes, its pretty random
Golly gee, I had hoped someone else would have pointed out that Nevada had a 4 M at Empire. Hmmm.
earthquake.usgs.gov...
Heck, if there's a big one, we'd have to maybe say these were foreshocks. I'll reserve judgement. Only 'cause I am older and not as ready to see the whole long term trend. 4M wouldn't really be considered a mainshock. So, the only thing to say for the moment is... " oh my, hmmm"
Mexico is not just my imagination. There's a defined increasing trend. Forget about the mystery of the year over year reporting. Just the recent stuff is show growing output of energy. Central America went offline. Not gonna say anything.
Because, the only real motivating factor for me to write, was that I have notice a sudden drop off in the Northern Nevada earthquakes. Because, well, "oh, my, hmmm", it seems very coincidental to the sudden increase in a swarm just to the south in Empire. How can I not connect this change. The one thing about the Northern Nevada earthquakes was that they were the "Energizer Bunny and kept going..." I mean, hey yeah, there's been times it almost seemed to have stopped only to come back. So, maybe that's it. Just the normal swarming of Nevada. Either spreading crust, or old mountains groaning, whatever they may be, Nevada is interesting.
I'll be wrong as soon as I write this, maybe. But, I think that we're kinda at a low ebb right now. Not much bigish. Again, it seems earthquakes come in clusters.
edit on 14-5-2016 by ericblair4891 because: (no reason given)
a reply to: ericblair4891
Same thing happened at Kyushu Japan, as the SW of Kyushu series died off the Kumamoto started. Then as Kumamoto died off SW started again. Those are Tectonic, maybe the Salton/Nevada are too.
Same thing happened at Kyushu Japan, as the SW of Kyushu series died off the Kumamoto started. Then as Kumamoto died off SW started again. Those are Tectonic, maybe the Salton/Nevada are too.
Thought some of you might be interested in watching this.
Ottawa, Canada just had a 3.0.
The seismograph is really catching some activity.
www.earthquakescanada.nrcan.gc.ca...
Ottawa, Canada just had a 3.0.
The seismograph is really catching some activity.
www.earthquakescanada.nrcan.gc.ca...
edit on 14-5-2016 by crappiekat because: (no reason
given)
new topics
-
Supreme Court Oral Arguments 4.25.2024 - Are PRESIDENTS IMMUNE From Later Being Prosecuted.
Above Politics: 1 hours ago -
Krystalnacht on today's most elite Universities?
Social Issues and Civil Unrest: 1 hours ago -
Chris Christie Wishes Death Upon Trump and Ramaswamy
Politicians & People: 1 hours ago -
University of Texas Instantly Shuts Down Anti Israel Protests
Education and Media: 4 hours ago -
Any one suspicious of fever promotions events, major investor Goldman Sachs card only.
The Gray Area: 6 hours ago -
God's Righteousness is Greater than Our Wrath
Religion, Faith, And Theology: 10 hours ago
top topics
-
VP's Secret Service agent brawls with other agents at Andrews
Mainstream News: 15 hours ago, 11 flags -
Nearly 70% Of Americans Want Talks To End War In Ukraine
Political Issues: 16 hours ago, 6 flags -
Sunak spinning the sickness figures
Other Current Events: 15 hours ago, 5 flags -
Supreme Court Oral Arguments 4.25.2024 - Are PRESIDENTS IMMUNE From Later Being Prosecuted.
Above Politics: 1 hours ago, 4 flags -
Electrical tricks for saving money
Education and Media: 13 hours ago, 4 flags -
Krystalnacht on today's most elite Universities?
Social Issues and Civil Unrest: 1 hours ago, 3 flags -
Late Night with the Devil - a really good unusual modern horror film.
Movies: 17 hours ago, 3 flags -
Any one suspicious of fever promotions events, major investor Goldman Sachs card only.
The Gray Area: 6 hours ago, 2 flags -
University of Texas Instantly Shuts Down Anti Israel Protests
Education and Media: 4 hours ago, 2 flags -
Chris Christie Wishes Death Upon Trump and Ramaswamy
Politicians & People: 1 hours ago, 1 flags
active topics
-
Supreme Court Oral Arguments 4.25.2024 - Are PRESIDENTS IMMUNE From Later Being Prosecuted.
Above Politics • 3 • : xuenchen -
University of Texas Instantly Shuts Down Anti Israel Protests
Education and Media • 89 • : theatreboy -
SETI chief says US has no evidence for alien technology. 'And we never have'
Aliens and UFOs • 64 • : SchrodingersRat -
Sunak spinning the sickness figures
Other Current Events • 18 • : andy06shake -
British TV Presenter Refuses To Use Guest's Preferred Pronouns
Education and Media • 155 • : Annee -
Nearly 70% Of Americans Want Talks To End War In Ukraine
Political Issues • 76 • : FlyersFan -
The Reality of the Laser
Military Projects • 49 • : 5thHead -
President BIDEN Vows to Make Americans Pay More Federal Taxes in 2025 - Political Suicide.
2024 Elections • 142 • : xuenchen -
Chris Christie Wishes Death Upon Trump and Ramaswamy
Politicians & People • 6 • : mysterioustranger -
"We're All Hamas" Heard at Columbia University Protests
Social Issues and Civil Unrest • 282 • : 5thHead