It looks like you're using an Ad Blocker.
Please white-list or disable AboveTopSecret.com in your ad-blocking tool.
Thank you.
Some features of ATS will be disabled while you continue to use an ad-blocker.

Quake Watch 2016
page: 11share:
I noticed last week that QUACK SNZO and URZ wasn't working.
Same today, when I went to look.
Been around in circles at IRIS to see what's going on.
damn they have shut it down. QUACK is no longer in service
Was a good resource for getting station graphs.
Looks like you can still create the graphs, but may take a bit more time.
I managed to get SNZO back up by using the old address for SNZO BHZ and changing the date
ds.iris.edu... shows todays 5.7 @ Marlborough
edit on 02000000383816 by muzzy because: didn't work the first time you have to put 040 for the day not 40, I forgot
edit on
02000000383816 by muzzy because: (no reason given)
a reply to: muzzy
You can still get the seismograms in QVSData as well. The old address still works, but I am in the process of updating the program to use the new address. And of course SNZO is still being uploaded to my dropbox for 00.BHZ as always especially for you dear friend. The December 2015 graphs are in there, which I am about to remove so let me know if you have not got all of them. As always I have SNZO stored back to 31st August 2013 in a continuous daily stream.
Just to remind people, I collect every day they are available - All active Bayou Corne seismos; Cascade seismos EDM, GPW, MBW, RCM, RCS & TDH; all available seismos on the Irish EI network; what I call 'world' seismos KBS, MARNC, PEL, SANVU, SNZO and TAM. This last group give a broad look around the world. Pretty much all of these go back to September 2013 and some, such as the Cascades seismos (not all) go back to late 2011. In addition Iceland (All, Myrdalsjokull and Vatnajukull maps and charts, GOD and GRF tremor charts; Arctic and Arctic blue marble ice extents images; GISS temperatures data; various solar related charts - GOES X-ray, Satellite envelope etc; daily wind direction, wind speed and temperature data graphs from Summit Camp on top of the Greenland icesheet.
Also if anyone ever needs it I have all Jetstream analysis images back to 2007, and my other half has UK Met office chart back for many years and crude oil and financial trading rates back many years as well. We are both hopeless data gatherers!
You can probably guess why I am always having to increase my disk storage!
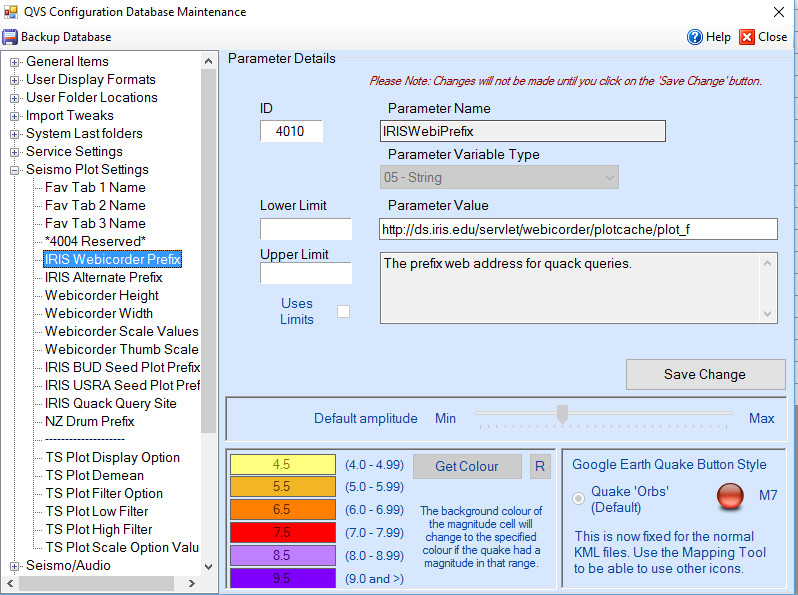
ETA: By the way you can of course change the base plot address for seismograms in QVSData in the configuration file. You should change it in both Webicorder Prefix AND Alternate prefix as the sizing parameter now works as standard and the old alternate address is no more.
You can still get the seismograms in QVSData as well. The old address still works, but I am in the process of updating the program to use the new address. And of course SNZO is still being uploaded to my dropbox for 00.BHZ as always especially for you dear friend. The December 2015 graphs are in there, which I am about to remove so let me know if you have not got all of them. As always I have SNZO stored back to 31st August 2013 in a continuous daily stream.
Just to remind people, I collect every day they are available - All active Bayou Corne seismos; Cascade seismos EDM, GPW, MBW, RCM, RCS & TDH; all available seismos on the Irish EI network; what I call 'world' seismos KBS, MARNC, PEL, SANVU, SNZO and TAM. This last group give a broad look around the world. Pretty much all of these go back to September 2013 and some, such as the Cascades seismos (not all) go back to late 2011. In addition Iceland (All, Myrdalsjokull and Vatnajukull maps and charts, GOD and GRF tremor charts; Arctic and Arctic blue marble ice extents images; GISS temperatures data; various solar related charts - GOES X-ray, Satellite envelope etc; daily wind direction, wind speed and temperature data graphs from Summit Camp on top of the Greenland icesheet.
Also if anyone ever needs it I have all Jetstream analysis images back to 2007, and my other half has UK Met office chart back for many years and crude oil and financial trading rates back many years as well. We are both hopeless data gatherers!
You can probably guess why I am always having to increase my disk storage!
ETA: By the way you can of course change the base plot address for seismograms in QVSData in the configuration file. You should change it in both Webicorder Prefix AND Alternate prefix as the sizing parameter now works as standard and the old alternate address is no more.
edit on 9/2/2016 by PuterMan because: To add image of configuration setting
edit on 9/2/2016 by
PuterMan because: More haste less spelling spped
a reply to: PuterMan
Thank you PuterMan,
I love your site. There is so much info there. And I love the teaching tools you use. Like the one you use for how to read and understand seismograms. The bobblehead explaination. LOL!!! Love it. (I think that originated here in the Quake Watch thread)
You have every link under the sun. I really appreciate all the information I need to learn about earthquakes, Volcano's and much more.
I have suggested your site to others who have shown interest in learning about earthquakes.
My kids use your site also.
a reply to: crappiekat
Thank you. If it is useful to 1 or more people it is useful and worth the effort.
Now, did anyone cop the Navy causing earthquakes?
The Earth Shook, but It Wasn't an Earthquake
Thank you. If it is useful to 1 or more people it is useful and worth the effort.
Now, did anyone cop the Navy causing earthquakes?
The Earth Shook, but It Wasn't an Earthquake
a reply to: PuterMan
Thanks for the reminder, I forgot you had those available.
I tend to let things go during the Summer when the weather is good and I get busy at work and am too tired to do any research in the evenings.
That SNZO project I started in mid 2013 (Winter) was a time consumer, identifying each trace, but there was a lot going on here at that time (July and August) and some of the graphs were quite "exciting".
I was quite proud of these two.
And felt most of those big ones, into the evening of 16 Aug NZST.
Most of the time there isn't much showing on SNZO, compared to MAJO or PMG
edit on 02000000393916 by muzzy because: (no reason given)
I've figured out how the mid-Atlantic earthquakes are caused. I found the evidence in a strange place. I'm watching Secrets of the Bible on Netflix.
I'm on the episode of the part of the Red Sea. To cut to the chase, one fella thinks wind may have had something to do with it. When wind pushes on
water and it causes water to pile up, it's called a storm surge. But there is also another wind pattern that push water downward. It's called wind
set-down. The force of the wind send water downward at a 45 degree angle. Obviously, the wave pattern the can be seen on top, is also happening
underneath the surface in a downward action and must travel along the bottom of the ocean. This wave action is causing vibrations and stresses that
build until the faults move in a major way.
So, I don't think it's the actual low pressure movement. Although, the change from high to low with the following wind set-down could work together. There were six earthquake all around the 5 M range. NO main earthquake followed by aftershocks. This would appear to be a series of earthquake in the sense of a swarm and having relatively comparable magnitudes.
4.9
Northern Mid-Atlantic Ridge
2016-02-09 02:22:47 UTC-05:0027.8 km
5.3
Northern Mid-Atlantic Ridge
2016-02-09 02:19:31 UTC-05:0010.0 km
5.3
Northern Mid-Atlantic Ridge
2016-02-08 18:26:45 UTC-05:0010.0 km
5.4
Northern Mid-Atlantic Ridge
2016-02-08 18:03:26 UTC-05:0010.0 km
5.0
Northern Mid-Atlantic Ridge
2016-02-08 17:50:24 UTC-05:0010.0 km
5.0
Northern Mid-Atlantic Ridge
2016-02-08 15:39:46 UTC-05:0010.0 km
M6.3 - 40km W of Ovalle, Chile
30.634 °S 71.620 °W depth=31.5 km (19.6 mi)
Time
2016-02-10 00:33:05 (UTC)
2016-02-09 18:33:05 (UTC-06:00) in your timezone
Times in other timezones
Nearby Cities
40km (25mi) W of Ovalle, Chile
64km (40mi) W of Monte Patria, Chile
79km (49mi) SSW of Coquimbo, Chile
87km (54mi) SSW of La Serena, Chile
326km (203mi) NNW of Santiago, Chile
USGS
EMSC 6.3Mw
edit on 9-2-2016 by lurksoften because: (no reason
given)
a reply to: muzzy
One aftershock
Public ID 2016p108118
Intensity light
Universal Time February 10 2016, 0:05:30
NZ Daylight Time Wed, Feb 10 2016, 1:05:30 pm
Depth 50 km
Magnitude 4.3
Location 35 km south-east of St Arnaud
Latitude, Longitude -42.08, 173.06
Agency WEL(GNS_Primary)
www.geonet.org.nz...
This is strange, last time there was a quake around this size in this area there were about 30 aftershocks in the first 24hrs.
Actually this 5.7 was only 2.5km NNE from the M6.2331 of 24/04/2015 (the one I was referring to above.)
edit on 02000000404016 by muzzy because: (no reason given)
a reply to: ericblair4891
Ha! Wind is my 2nd favourite interest after Earthquakes, because it has such a big influence on my work.
I don't know if you read Cyclone Watch on ATS, but I posted this last year, its a good resource for weather , including WIND and PRESSURE
earth.nullschool.net...
Click on the word "earth" and the menu will come up.
You can change the overlays, and go back or forwards in time, rotate the globe to where you want to look using left click and drag on your mouse.
I went back to the date of those Mid Atlantic Ridge quakes, and couldn't see anything to match in that spot.
a reply to: muzzy
I could stare at those wind pattern cycles all day. They are mesmerizing. I see what you mean that there's nothing that jumps out as obvious when I watch 7- 9 of February. However, you can see then energy difference from the 7th to the 8th. The storm was off the east coast on the 8th and then move into the mid-Atlantic. The was a change from heavier winds near Iceland, then intensity grows of New York State.
Cool map. I've seen some others but this one is too cool.
Just to clarify, I don't think it's on the wind. You have direction of storm, and you have direction and the barometric pressure. Tidal forces can also be a factor. I think the moon was just New and near Perigee. Just the fact of a change in direction can change pressure on the ocean floor.
edit on 10-2-2016 by ericblair4891 because: (no reason given)
Well Muzzy, I used that great map earth wind mesmerizer to catch an earthquake caused by wind and a storm. There is strong winds, and there is a big
storms tracking across the Atlantic, off of South America, right on the rift, where a 5.2M just occurred. These earthquakes are often right around the
5M range. I don't have visual proof because I have no idea how to capture the earth wind thingy, or the satellite map I just checked. I want to find
the position of the low pressure but haven't looked yet. Either I just caught a weather quake, or it's just coincidence. Aren't coincidences fun? So
many. I should create my own religion based on them. Wait, isn't that what happened? Sometimes. No disrespect intended. Religion was the first
science, believe it or not. Wait, no, it was just part. Weapons, fire, etc were the first, but, observation had to have already existed right? Hmmm,
definitions, connections, coincidences, correlations, causations, observations, my head hurts... i'm sure i got stuff in the wrong order. I haven't
mentioned memory. Sorry, I've been arguing with myself too much lately.
I tried to track down the low pressure center to find the particular storm I'm looking for, except, it's not a low pressure storm. It's a storm that's a zone between to high pressure systems. It's a line of storms that extent from South America almost across the whole ocean. The winds are strongest just to the south of the line of storms. I think the earthquake is in a spot right at the originating point of the strong winds. There is one spot, kinda like the eye of a hurricane, that is almost completely still. Anyway. I love the wind map.
I tried to track down the low pressure center to find the particular storm I'm looking for, except, it's not a low pressure storm. It's a storm that's a zone between to high pressure systems. It's a line of storms that extent from South America almost across the whole ocean. The winds are strongest just to the south of the line of storms. I think the earthquake is in a spot right at the originating point of the strong winds. There is one spot, kinda like the eye of a hurricane, that is almost completely still. Anyway. I love the wind map.
edit on 11-2-2016 by ericblair4891 because: (no reason given)
Eastern Canada has a swarm. Twenty three small earthquakes have occurred in New Brunswick. I don't think they're fracking nearby, but I want to check
later on. I know it's not much, but Canada gets very few earthquakes. British Columbia gets them in bunches with the potential for a giant one, and
Quebec has some.
www.theweathernetwork.com...
And, while I'm out here, I want to make a prediction. Muzzy wind map is not hard to use and I had fun fast forwarding in time to look at the predicted winds for later on and tomorrow. The winds are heading south, so, if this is a powerful surge, or set down, then maybe we'll get another Southern mid-Atlantic earthquake. I'm guessing it may be south of the one from earlier today. Maybe way south near the one near Antarctica earlier this week. But maybe not that far south. Antarctica is constantly stormy so the influence should be less because the around Antarctica it's always stressed.
earthquake.usgs.gov...
edit on 11-2-2016 by ericblair4891 because: (no reason
given)
Just something I just noticed at USGS. There has been only ONE quake in Alaska in the last 24 hours, at this time, 11:56 p.m. Central Time. I don't
think I have ever seen Alaska this quiet, have you?
a reply to: berkeleygal
yeah you are right, even @ 7 hrs into the day UTC
last quake (above 2.5 data) before that one was 2016-02-10 17:52:11 UTC
could be something big looming
yeah you are right, even @ 7 hrs into the day UTC
last quake (above 2.5 data) before that one was 2016-02-10 17:52:11 UTC
could be something big looming
a reply to: ericblair4891
Keep an eye on Vanuatu for possible quakes, there are two Cyclones, one either side of the island chain
Keep an eye on Vanuatu for possible quakes, there are two Cyclones, one either side of the island chain
a reply to: ericblair4891
Did you know that if you double left click on a point on the globe it will zoom in, keep clicking to get closer
Did you know that if you double left click on a point on the globe it will zoom in, keep clicking to get closer
edit on 12-2-2016 by crappiekat because: (no reason given)
earthquake.usgs.gov...
I'm still wondering if the Nepal area isn't going to let another big one off.
edit on 12-2-2016 by crappiekat because: to add
What do you make of this? Other side of the island from the plate edge.
M 4.5 - 70km NW of Nago, Japan
Time 2016-02-12 12:59:31 UTC
Location 27.084°N 127.536°E
Depth 90.8 km
Source
ETA: Pretty deep as well.
Bishop
M 4.5 - 70km NW of Nago, Japan
Time 2016-02-12 12:59:31 UTC
Location 27.084°N 127.536°E
Depth 90.8 km
Source
ETA: Pretty deep as well.
Bishop
edit on 2/12/2016 by Bishop2199 because: (no reason given)
a reply to: berkeleygal
I thought it would be really odd if Alaska had no earthquakes. That thought actually scares me. Because that would not be normal. However, I do think there are earthquakes and for some reason, they're not showing up on the lists. I went to the Alaskan Volcano Observatory and looked at their webicorders. It's kinda quiet, but I think I found at least one station where you can see local Alaskan earthquakes that have recently occurred.
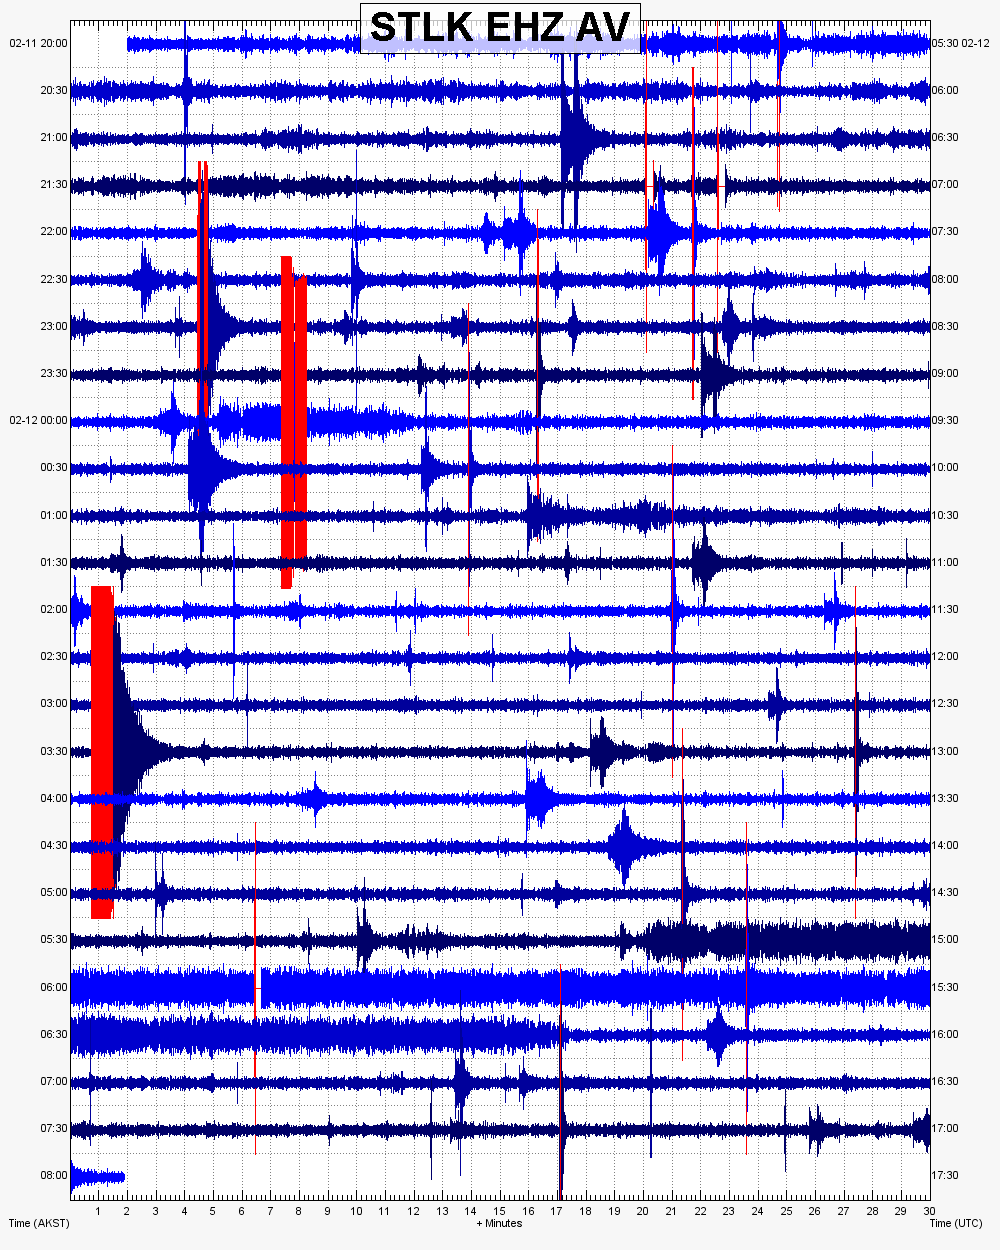
I mean some are small, but usually they'll list the small ones and usually there's dozens scattered all over. I think this is a reporting problem.
And now I may take some time to be selfish. But first, I love the Muzzy wind map. I think my prediction was wrong because I misjudge how far south the storm had gone. Round maps are different than flat maps. Remember that Flat Earthers. So, the storm I was looking at was one of those Antarctic storms. Yes, those cyclones are mezzzmorizzzing . I keep showing my kid, and he even had to zoom in to look at our wind.
And the selfish bit. I want a tattoo. And I've decided on the symbol. However, I'm a bit of a twit. I struggle out here to post pictures and things. My limit is posting links and cutting and pasting. I am just figuring out paint for photo shopping. I'm going to post an image, and what I would like, is a more precise rendering of my crazy geometry mashup. Penny did this following image on Robinesque Ruminations long ago.
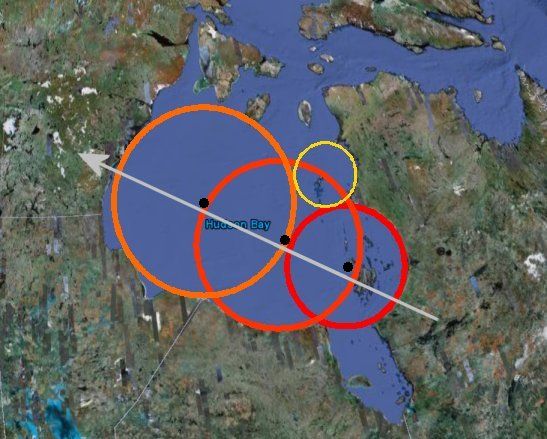
The circles are basically correct. Except the points should be exactly where the circles intersect. So, sizing the circles needs to have them intersecting perfectly, and then the line that travels through the three points will be in a nice northwesterly direction. I like how she put the arrow on the end indication direction. I wouldn't want this particular map I think. A simple black and white line map would do. The circles, centers, intersections, and the direction line with a basic map is all I need. I should get the thing put on my buttt. Oh, if you are feeling like you'd like to oblige my goofiness, then you should not waste space here, please post your image on Robinesque Ruminations...
www.abovetopsecret.com...
And the fourth yellow circle doesn't need to be there...
And, it's best to start with the small circle because the arc is perfectly round.
I thought it would be really odd if Alaska had no earthquakes. That thought actually scares me. Because that would not be normal. However, I do think there are earthquakes and for some reason, they're not showing up on the lists. I went to the Alaskan Volcano Observatory and looked at their webicorders. It's kinda quiet, but I think I found at least one station where you can see local Alaskan earthquakes that have recently occurred.
I mean some are small, but usually they'll list the small ones and usually there's dozens scattered all over. I think this is a reporting problem.
And now I may take some time to be selfish. But first, I love the Muzzy wind map. I think my prediction was wrong because I misjudge how far south the storm had gone. Round maps are different than flat maps. Remember that Flat Earthers. So, the storm I was looking at was one of those Antarctic storms. Yes, those cyclones are mezzzmorizzzing . I keep showing my kid, and he even had to zoom in to look at our wind.
And the selfish bit. I want a tattoo. And I've decided on the symbol. However, I'm a bit of a twit. I struggle out here to post pictures and things. My limit is posting links and cutting and pasting. I am just figuring out paint for photo shopping. I'm going to post an image, and what I would like, is a more precise rendering of my crazy geometry mashup. Penny did this following image on Robinesque Ruminations long ago.
The circles are basically correct. Except the points should be exactly where the circles intersect. So, sizing the circles needs to have them intersecting perfectly, and then the line that travels through the three points will be in a nice northwesterly direction. I like how she put the arrow on the end indication direction. I wouldn't want this particular map I think. A simple black and white line map would do. The circles, centers, intersections, and the direction line with a basic map is all I need. I should get the thing put on my buttt. Oh, if you are feeling like you'd like to oblige my goofiness, then you should not waste space here, please post your image on Robinesque Ruminations...
www.abovetopsecret.com...
And the fourth yellow circle doesn't need to be there...
And, it's best to start with the small circle because the arc is perfectly round.
edit on 12-2-2016 by ericblair4891 because: (no reason
given)
new topics
-
God's Righteousness is Greater than Our Wrath
Religion, Faith, And Theology: 1 hours ago -
Electrical tricks for saving money
Education and Media: 4 hours ago -
VP's Secret Service agent brawls with other agents at Andrews
Mainstream News: 6 hours ago -
Sunak spinning the sickness figures
Other Current Events: 6 hours ago -
Nearly 70% Of Americans Want Talks To End War In Ukraine
Political Issues: 6 hours ago -
Late Night with the Devil - a really good unusual modern horror film.
Movies: 8 hours ago -
Cats Used as Live Bait to Train Ferocious Pitbulls in Illegal NYC Dogfighting
Social Issues and Civil Unrest: 10 hours ago
top topics
-
Florida man's trip overseas ends in shock over $143,000 T-Mobile phone bill
Social Issues and Civil Unrest: 17 hours ago, 8 flags -
Cats Used as Live Bait to Train Ferocious Pitbulls in Illegal NYC Dogfighting
Social Issues and Civil Unrest: 10 hours ago, 8 flags -
VP's Secret Service agent brawls with other agents at Andrews
Mainstream News: 6 hours ago, 8 flags -
Bobiverse
Fantasy & Science Fiction: 16 hours ago, 3 flags -
HORRIBLE !! Russian Soldier Drinking Own Urine To Survive In Battle
World War Three: 14 hours ago, 3 flags -
Electrical tricks for saving money
Education and Media: 4 hours ago, 3 flags -
Nearly 70% Of Americans Want Talks To End War In Ukraine
Political Issues: 6 hours ago, 3 flags -
Sunak spinning the sickness figures
Other Current Events: 6 hours ago, 3 flags -
Late Night with the Devil - a really good unusual modern horror film.
Movies: 8 hours ago, 2 flags -
The Good News According to Jesus - Episode 1
Religion, Faith, And Theology: 12 hours ago, 1 flags
active topics
-
Electrical tricks for saving money
Education and Media • 4 • : Lumenari -
Cats Used as Live Bait to Train Ferocious Pitbulls in Illegal NYC Dogfighting
Social Issues and Civil Unrest • 19 • : WeMustCare -
VP's Secret Service agent brawls with other agents at Andrews
Mainstream News • 38 • : SchrodingersRat -
New whistleblower Jason Sands speaks on Twitter Spaces last night.
Aliens and UFOs • 54 • : Ophiuchus1 -
DONALD J. TRUMP - 2024 Candidate for President - His Communications to Americans and the World.
2024 Elections • 514 • : WeMustCare -
The Acronym Game .. Pt.3
General Chit Chat • 7744 • : bally001 -
Truth Social goes public, be careful not to lose your money
Mainstream News • 128 • : Astyanax -
Sunak spinning the sickness figures
Other Current Events • 5 • : glen200376 -
SETI chief says US has no evidence for alien technology. 'And we never have'
Aliens and UFOs • 44 • : MikeDeGrasseTyson -
HORRIBLE !! Russian Soldier Drinking Own Urine To Survive In Battle
World War Three • 31 • : budzprime69