It looks like you're using an Ad Blocker.
Please white-list or disable AboveTopSecret.com in your ad-blocking tool.
Thank you.
Some features of ATS will be disabled while you continue to use an ad-blocker.

Top scientists start to examine fiddled global warming figures
page: 3share:
a reply to: Phage
How about generating your own electricity from the sun? Thats what I do. Solar panels, Battery banks, converters. This stuff costs me alot, but thats what I do to do my part. I dont just talk. Actions speak very loud. Im preparing to go electric charged motorcycle, fully charged by the sun. Im an old man. Im an old man, and you can do more. Get with the program. Actions speak louder then words. And do some research with what I have told . Those are rare pearls I gave you on the other thread. Believe them or not.
How about generating your own electricity from the sun? Thats what I do. Solar panels, Battery banks, converters. This stuff costs me alot, but thats what I do to do my part. I dont just talk. Actions speak very loud. Im preparing to go electric charged motorcycle, fully charged by the sun. Im an old man. Im an old man, and you can do more. Get with the program. Actions speak louder then words. And do some research with what I have told . Those are rare pearls I gave you on the other thread. Believe them or not.
a reply to: visitedbythem
Good on you! Great!
You didn't read my post, did you? I cannot pay for a PV system. If I could, I would.
Good on you! Great!
You didn't read my post, did you? I cannot pay for a PV system. If I could, I would.
edit on 4/26/2015 by Phage because: (no reason
given)
originally posted by: 727Sky
I personally really would like to see real independent investigations of who has fiddled what and if wrong doing or payed for unethical behavior is found, justly punish those and the ones paying for bogus political studies to be dealt with after being hung. To much is really riding on this to be made up B.S.
Last month, we are told, the world enjoyed “its hottest March since records began in 1880”. This year, according to “US government scientists”, already bids to outrank 2014 as “the hottest ever”. The figures from the US National Oceanic and Atmospheric Administration (NOAA) were based, like all the other three official surface temperature records on which the world’s scientists and politicians rely, on data compiled from a network of weather stations by NOAA’s Global Historical Climate Network (GHCN).
But here there is a puzzle. These temperature records are not the only ones with official status. The other two, Remote Sensing Systems (RSS) and the University of Alabama (UAH), are based on a quite different method of measuring temperature data, by satellites. And these, as they have increasingly done in recent years, give a strikingly different picture. Neither shows last month as anything like the hottest March on record, any more than they showed 2014 as “the hottest year ever”.
www.telegraph.co.uk...
This article mentions two satellite data sets, UAH and RSS. Lemme tell you a bit about satellites.
1) They are not very accurate.
2) They sample different latitudes at different intervals.
3) They are the best thing we have for broad measurements.
4) They do not really sample the poles.
Let me back up this by pointing to RSS itself:
RSS upper air temperature products are based on measurements made by microwave sounders. Microwave sounders are capable of retrieving vertical temperature profiles of the atmosphere by measuring the thermal emission from oxygen molecules at different frequencies.
So here's what they use - microwave sounders. Here's what microwave sounders are:
Microwave Sounders. These are satellite-borne instruments that measure the radiance of Earth at microwave frequencies, which allows scientists to deduce the temperature of thick atmospheric layers.
Advantages
Global coverage at a high samplng rate
Disadvantages
Coarse vertical resolution
Advantages support point #3.
Disadvantages support point #1.
Now, you might wonder how a microwave can measure a column of air - especially as RSS claims to measure different layers of that column of air. Well, it's tricky and they use a lot of math, as you can read further down in that link where you can get the exact formulas. Basically, they use weighting functions and a mix of multiple passes (this may be done with multiple satellites instead) over parts of a larger area to come up with these temperatures.
Recall that each measurement is not very accurate, and several of these not very accurate measurements that are geographically near are combined to form an area temperature, which is finally run through formulas to estimate the temperatures of different layers of air. So, it's a bit of a mess.
It gets worse - refer to this PDF also from RSS. You will see a few things there:
2.2. Sampling Errors
Satellites make measurements at discrete times. Because the satellites that MSU/AMSU are carried upon are polar orbiters that orbit pole-to-pole every 90 min there is a distinct geographical sampling imparted upon the data. At the very highest latitudes sampled (around 85° latitude) each location is sampled multiple times per day. In the deep tropics the sampling at a given location can be as infrequently as every third day.
So, an area in a polar region gets sampled multiple times per day while an area in the tropics might be sampled once every three days. This is due to the movement of the satellite across the globe; think of a spinning classroom globe. If you were yo draw a straight line from pole to pole as the globe spins, you would see this exact issue. This supports point #2.
That leaves only the last point - which I will illustrate visually:
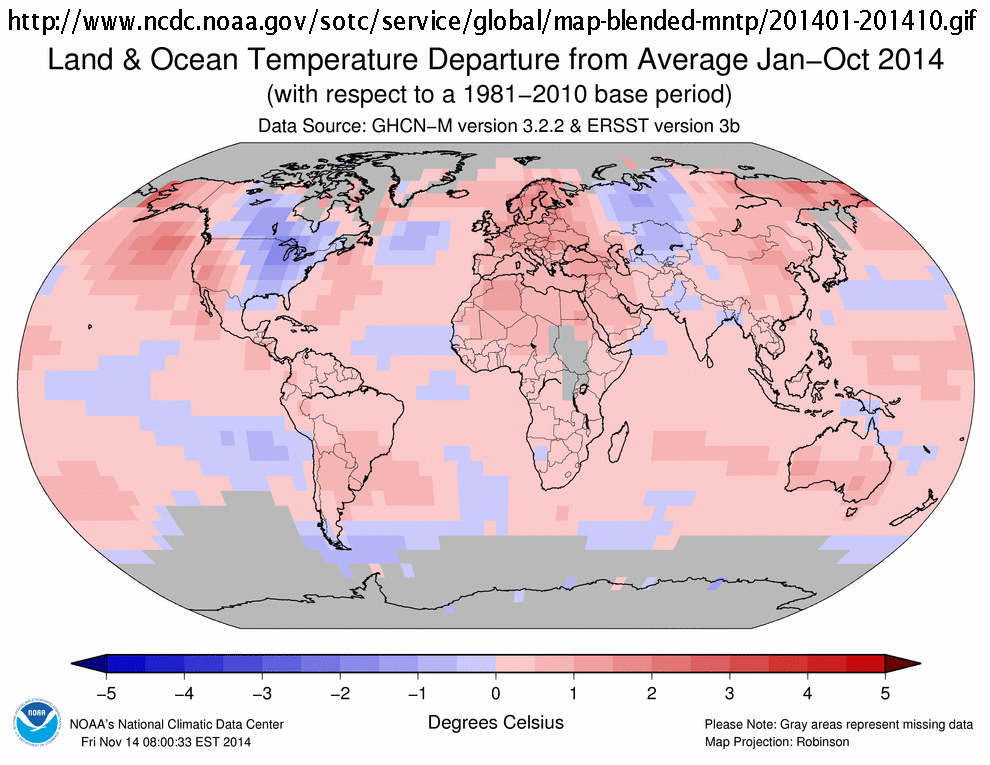
See these gray areas - especially at the poles? This is because data sets consider this area too inaccurate; RSS measures a smaller range than UAH. From the first link (RSS):
Globally averaged trends computed over latitudes from 82.5S to 82.5N (70S to 82.5N for channel TLT)
UAH measures more: 85S to 85N. Point #4 supported.
Here's the thing about #4, though - What's causing the poles to warm faster than the rest of Earth?
The poles are warming faster than other parts of the Earth – a fact that has been widely accepted for years.
...
Decades of NASA data show the Earth is warming. According to NASA's Goddard Institute for Space Studies in Manhattan, the Earth has warmed about 1.44 degrees Fahrenheit during the last 40 years. But the poles are warming even faster; the Arctic has warmed by more than 3.5 degrees Fahrenheit during the same time period.
Despite the poles warming faster, these data sets do not measure at the poles. Interesting problem, no?
Alas, there is no silver bullet to the problem of measurement.
edit on 1Sun, 26 Apr 2015 01:09:58 -0500America/ChicagovAmerica/Chicago4 by
Greven because: apparently it replaces 'document' with a _ like 'window' in sentences... annoying.
originally posted by: Phage
a reply to: visitedbythem
Good on you! Great!
You didn't read my post, did you? I cannot pay for a PV system. If I could, I would.
Do you want me to buy you System, or send you some money? Im sorry. I didnt mean to hurt your feelings. Im an old man and work 12 hours a day in an American steel mill. Just like my great grand father did. Over here you can make money being intelligent. Maybe you should move.
a reply to: visitedbythem
But tell me, since you are "doing your part" so diligently does that mean you agree that carbon emissions are a problem?
Sure! You bet!
Do you want me to buy you System, or send you some money?
Maybe I should. My mortgage payments are rough.
Just like my great grand father did. Over here you can make money being intelligent. Maybe you should move.
But tell me, since you are "doing your part" so diligently does that mean you agree that carbon emissions are a problem?
edit on 4/26/2015 by Phage because: (no reason given)
originally posted by: Phage
a reply to: glend
There are reports of extremely hot summers in Europe decades before the last Maunder Minimum which wasn't caused by any CO2 spike.
So what?
Does that mean that we are not changing the global climate? Why?
It means the causal link introduced is suspect and cant be taken for granted. It borders on speculation...
a reply to: MarioOnTheFly
Why? Is a changing climate only caused by "natural" forces?
Here's a question for you; are earthquakes only caused by "natural" forces?
There is a known mechanism (radiative forcing) by which increased CO2 levels will lead to increased temperatures.
It means the causal link introduced is suspect and cant be taken for granted.
Why? Is a changing climate only caused by "natural" forces?
Here's a question for you; are earthquakes only caused by "natural" forces?
There is a known mechanism (radiative forcing) by which increased CO2 levels will lead to increased temperatures.
edit on 4/26/2015 by Phage
because: (no reason given)
So how can anyone argue that forming an impartial group to see if the temps being used are correct is some how a bad thing ? ... Because that is what
the committee is supposed to do; see where the errors are, if any. The article actually had some of the actual (?) verses reported temps.. I even have
a problem with what is actual temperatures. BECAUSE......Put a sensor which is colored dark in direct sunlight verses one which is white colored...
Big difference in temp.. Same as something partially shaded verses always in direct sunlight.
I do know that a city is a huge heat sink because of all the concrete and asphalt.. On a cool night just drive toward a large city and when "X" miles from said city you will run into a wall or bubble of heat radiated from the city... Now where are the majority of temps sensors located ? Cities and concrete covered airports. Even if the temp sensor is located on top of the control tower you still get radiated heat from direct sun light striking the structure.
Just something to consider no matter what your feelings are on the subject and all the great official recorded temperatures.
Their inquiry’s central aim will be to establish a comprehensive view of just how far the original data has been “adjusted” by the three main surface records: those published by the Goddard Institute for Space Studies (Giss), the US National Climate Data Center and Hadcrut, that compiled by the East Anglia Climatic Research Unit (Cru), in conjunction with the UK Met Office’s Hadley Centre for Climate Prediction. All of them are run by committed believers in man-made global warming.
I do know that a city is a huge heat sink because of all the concrete and asphalt.. On a cool night just drive toward a large city and when "X" miles from said city you will run into a wall or bubble of heat radiated from the city... Now where are the majority of temps sensors located ? Cities and concrete covered airports. Even if the temp sensor is located on top of the control tower you still get radiated heat from direct sun light striking the structure.
Just something to consider no matter what your feelings are on the subject and all the great official recorded temperatures.
a reply to: 727Sky
Are you sure? Have you researched this? Are you sure the adjustments don't account for things like this?
Have you researched whether (not weather, heh) stations in rural areas shown less of an increase than those in urban areas?
Now where are the majority of temps sensors located ? Cities and concrete covered airports.
Are you sure? Have you researched this? Are you sure the adjustments don't account for things like this?
Have you researched whether (not weather, heh) stations in rural areas shown less of an increase than those in urban areas?
edit on 4/26/2015 by Phage because: (no reason given)
originally posted by: Phage
a reply to: MarioOnTheFly
It means the causal link introduced is suspect and cant be taken for granted.
Why? Is a changing climate only caused by "natural" forces?
Here's a question for you; are earthquakes only caused by "natural" forces?
There is a known mechanism (radiative forcing) by which increased CO2 levels will lead to increased temperatures.
Why ? I thought you were a scientist.
Many times i heard the age old..."correlation does not mean causation".
when you have similar events in historic records suggesting similar trends, but no similar contributing factors, (actually...we obviously dont know what the actual body of factors is)....than you have to reevaluate your conclusions...or at least consider that there might be factors that are unknown to our understanding of this huge process.
Like science in general...climate science lacks humillity. We act like we understand every process and we simply dont.
As for your earthquake question....i dont know of athropogenic earthquaqes. Its not talked about in mainstream news. Feel free to educate me...
a reply to: MarioOnTheFly
esd.lbl.gov...
That's true. Without a viable mechanism to explain causation correlation cannot be used to imply it. However in the case of "greenhouse gasses" there is indeed a very well known mechanism.
Many times i heard the age old..."correlation does not mean causation".
We know we are producing prodigious amounts of CO2. We know that we are causing CO2 levels in the atmosphere to rise. We know that increasing CO2 levels increase radiative forcing. We know that increased radiative forcing will produce increased temperatures.
when you have similar events in historic records suggesting similar trends, but no similar contributing factors, (actually...we obviously dont know what the actual body of factors is)....than you have to reevaluate your conclusions...or at least consider that there might be factors that are unknown to our understanding of this huge process.
You shouldn't rely much on mainstream news. For anything.
As for your earthquake question....i dont know of athropogenic earthquaqes. Its not talked about in mainstream news. Feel free to educate me...
esd.lbl.gov...
edit on 4/26/2015 by Phage because: (no reason given)
a reply to: Phage
How do we know that the Earth isn't still warming up after the Little Ice Age?
Human CO2 makes up a tiny proportion of the whole, and there's supposed to be an 800-year time lag between warming and release of CO2...which would correspond unremarkably to the Medieval Warm Period.
(Be gentle with me, I am merely playing devil's advocate, I'm not a scientist)
edit on 26.4.2015 by CJCrawley because: (no reason
given)
a reply to: Phage
But...if you include historic records in the "known" mechanism, doesnt that sort of put a monkey wrench in the CO2 did it conclusion ? But let's say Co2 is solely responsible for the alleged warming....how much of it is produced by humans compared to "natural" or non human production ? I heard various percentages...maybe you can set the record straight.
Thanks for the link on earthquakes...i'll get on that as soon as i get to my pc. This phone posting is killung me..
a reply to: CJCrawley
Temperatures rose rapidly after the LIA over a period of about 50 years. They then became quite stable for the next 150 years (until the beginning of the 20th century. Since that time temperatures have exceeded those of the period before the LIA.
How do we know that the Earth isn't still warming up after the Little Ice Age?
Warming does cause oceanic CO2 to be released, however oceanic CO2 levels are rising. This indicates that CO2 is being absorbed, not released. There is also the fact that the isopotic signature of atmospheric CO2 indicates that its source is the combustion of fossil fuels.
Human CO2 makes up a tiny proportion of the whole, and there's supposed to be an 800-year time lag between warming and release of CO2...which would correspond unremarkably to the Medieval Warm period.
a reply to: MarioOnTheFly
Humans produce magnitudes more CO2 than natural sources and the changing isotopic signature of atmospheric CO2 demonstrates that it is the result of the combustion of fossil fuels rather than natural origins.
It is not claimed that CO2 is solely responsible for warming but it is the proximate and primary cause. That is, warming caused by increased CO2 levels leads to other effects, "feedback loops." For example, warmer temperatures caused by increased forcing means that the atmosphere can hold more water vapor. Water vapor is a strong greenhouse gas so that increase further drives warming. If temperatures decline water vapor amounts do too but CO2 levels do not.
But let's say Co2 is solely responsible for the alleged warming....how much of it is produced by humans compared to "natural" or non human production ? I heard various percentages...maybe you can set the record straight.
Humans produce magnitudes more CO2 than natural sources and the changing isotopic signature of atmospheric CO2 demonstrates that it is the result of the combustion of fossil fuels rather than natural origins.
edit on 4/26/2015 by Phage because: (no reason given)
originally posted by: 727Sky
www.telegraph.co.uk...
RSS and University of Alabama share a common top climate denier, the semi-famous Climate Misinformer: Roy Spencer.
Last month, we are told, the world enjoyed “its hottest March since records began in 1880”. This year, according to “US government scientists”, already bids to outrank 2014 as “the hottest ever”. The figures from the US National Oceanic and Atmospheric Administration (NOAA) were based, like all the other three official surface temperature records on which the world’s scientists and politicians rely, on data compiled from a network of weather stations by NOAA’s Global Historical Climate Network (GHCN).
But here there is a puzzle. These temperature records are not the only ones with official status. The other two, Remote Sensing Systems (RSS) and the University of Alabama (UAH), are based on a quite different method of measuring temperature data, by satellites. And these, as they have increasingly done in recent years, give a strikingly different picture. Neither shows last month as anything like the hottest March on record, any more than they showed 2014 as “the hottest year ever”.
www.telegraph.co.uk...
RSS and University of Alabama share a common top climate denier, the semi-famous Climate Misinformer: Roy Spencer.
a reply to: Phage
Except that the isotopic C13/C12 ratio can change, not just by the decrease of C13, but also by the increase of C12. And since there is no way to know which is the predominent factor, there is no way to know how much is human caused and how much is nature caused.
And why is there no way to determine which is the predominent factor ?
Because inter-annual natural variability of C13/C12 is exactly the same as the trends are.
Therefore, we have no bloody clue how much of the signature is human and how much is nature.
It's nothing but speculation at best.
There is also the fact that the isopotic signature of atmospheric CO2 indicates that its source is the combustion of fossil fuels.
Except that the isotopic C13/C12 ratio can change, not just by the decrease of C13, but also by the increase of C12. And since there is no way to know which is the predominent factor, there is no way to know how much is human caused and how much is nature caused.
And why is there no way to determine which is the predominent factor ?
Because inter-annual natural variability of C13/C12 is exactly the same as the trends are.
Therefore, we have no bloody clue how much of the signature is human and how much is nature.
It's nothing but speculation at best.
a reply to: CranialSponge
Now, remember that fossil fuels are actually plant material which died millions of years ago. So it is plant material which contains no 14C, it's gone away due to radioactive decay. Burn some recent dead plants and you will not change the atmospheric 14C ratio much because you are adding "new" carbon to the atmosphere. Burn fossil fuels and you will see a decline in the ratio because you are adding old "depleted" carbon. What do we see in the atmosphere? A decline in the 14C ratio.
So we know that the increase in CO2 in the atmosphere is caused by the burning of plant material. Very old plant material. Fossil fuels.
Well you got the first part right but came to the wrong conclusion. The burning of hydrocarbons produces both 12C and 13C because the plants absorb both. But plants retain more 12C than they do 13c so when their products (like forests and fossil fuels) are burned or decay, more 12c than 13C is released. The result is an increase in the ratio of 12C to 13C. Since the ratio of 12C to 13C is increasing that tells us that the source of the CO2 is plant material.
Except that the isotopic C13/C12 ratio can change, not just by the decrease of C13, but also by the increase of C12. And since there is no way to know which is the predominent factor, there is no way to know how much is human caused and how much is nature caused.
Now, remember that fossil fuels are actually plant material which died millions of years ago. So it is plant material which contains no 14C, it's gone away due to radioactive decay. Burn some recent dead plants and you will not change the atmospheric 14C ratio much because you are adding "new" carbon to the atmosphere. Burn fossil fuels and you will see a decline in the ratio because you are adding old "depleted" carbon. What do we see in the atmosphere? A decline in the 14C ratio.
So we know that the increase in CO2 in the atmosphere is caused by the burning of plant material. Very old plant material. Fossil fuels.
Sort of, because season variability is caused by variations in plant activity. But remember? Fossil fuels are plants. That's why we know increasing CO2 levels are caused by the combustion of plants. Very old plants.
Because inter-annual natural variability of C13/C12 is exactly the same as the trends are.
No. It is a fact.
It's nothing but speculation at best.
edit on 4/26/2015 by Phage because: (no reason given)
a reply to: Phage
For clarity's sake of my above post, here's some more food for thought:
C3 plants absorb far more C13 than C4 plants do.
Trees are C4, grasses are C3 metabolism.
Less trees and more grasses means more C13 absorption, thus resulting in a decrease to C13.
So again...
The C13/C12 ratio is NOT a clear and definitive signature of human fossil fuel burning, specifically.
But if you stop and think about it, it's probably more likely to be a signature of a higher demand for more agriculture and deforestation due to a growing population.
In my mind, deforestation is ten times more damaging to our environment than driving SUV's is.
I don't disagree that we are leaving a nasty footprint on mother earth... but I do disagree that human CO2 is the cause of a warming planet.
There's just too much questionable speculation with the whole meme.
edit on 26-4-2015 by CranialSponge because: (no reason given)
a reply to: CranialSponge
That's what I said.
Now explain the reduction of 14C levels.
The C13/C12 ratio is NOT a clear and definitive signature of human fossil fuel burning, specifically.
That's what I said.
Now explain the reduction of 14C levels.
new topics
-
Women gravitated toward thugs
General Chit Chat: 4 minutes ago -
The UK is overrun with thugs
General Chit Chat: 14 minutes ago -
The Baloney aka BS Detection Kit
Social Issues and Civil Unrest: 5 hours ago -
Suspected Iranian agent working for Pentagon while U.S. coordinated defense of Israel
US Political Madness: 5 hours ago -
How does my computer know
Education and Media: 8 hours ago
top topics
-
Suspected Iranian agent working for Pentagon while U.S. coordinated defense of Israel
US Political Madness: 5 hours ago, 12 flags -
USO 10 miles west of caladesi island, Clearwater beach Florida
Aliens and UFOs: 12 hours ago, 9 flags -
The Baloney aka BS Detection Kit
Social Issues and Civil Unrest: 5 hours ago, 3 flags -
How does my computer know
Education and Media: 8 hours ago, 2 flags -
The UK is overrun with thugs
General Chit Chat: 14 minutes ago, 0 flags -
Women gravitated toward thugs
General Chit Chat: 4 minutes ago, 0 flags
active topics
-
Afterlife, unknown, so prepare, or just go into the unknown (bad)!!
ATS Skunk Works • 52 • : Terpene -
It has begun... Iran begins attack on Israel, launches tons of drones towards the country
World War Three • 632 • : FlyersFan -
Women gravitated toward thugs
General Chit Chat • 0 • : Anisoptera -
Marjorie Taylor Greene Files Motion to Vacate Speaker Mike Johnson
US Political Madness • 48 • : FlyersFan -
America's Infant Mortality Rate Increases for the First Time in 20 Years
Medical Issues & Conspiracies • 19 • : AwakeNotWoke -
The UK is overrun with thugs
General Chit Chat • 1 • : Anisoptera -
Running Through Idiot Protestors Who Block The Road
Rant • 54 • : DBCowboy -
NPR Employs 87 Democrats in Editorial Positions
US Political Madness • 41 • : WeMustCare -
How does my computer know
Education and Media • 14 • : AwakeNotWoke -
God is watching.
Politicians & People • 25 • : Kurokage