It looks like you're using an Ad Blocker.
Please white-list or disable AboveTopSecret.com in your ad-blocking tool.
Thank you.
Some features of ATS will be disabled while you continue to use an ad-blocker.

The polar ice caps are MELTING!
page: 2share:
originally posted by: InverseLookingGlass
a reply to: network dude
I think this image speaks a thousand words. See if you can spot where humans entered the picture.
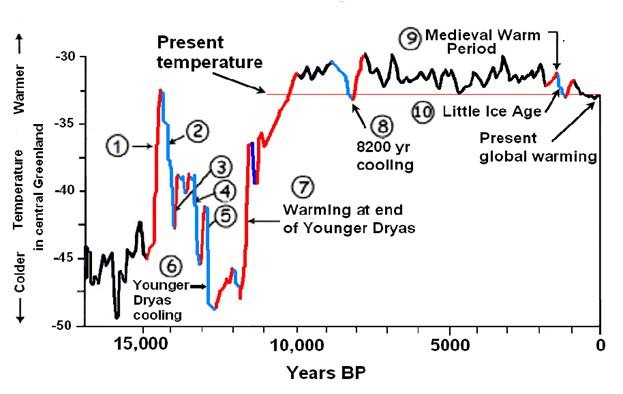
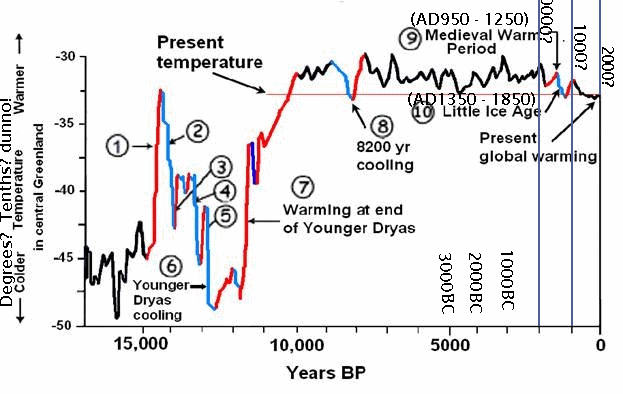
How about this image? It's a lot closer than calling the 1855 the 'present' (what a laugh):
You should be immediately distrustful and skeptical of any graph that is constructed like this (X years ago to 0). It gives you no real date. It's generally propaganda. What year is 0 on this graph? What does the Y axis measure - Degrees Celsius? Tenths of degrees? It's an awful graph made for propaganda.
edit: Here's a better illustration for why this graph is utter garbage:
edit on 18Fri, 27 Jun 2014 18:28:59 -0500America/ChicagovAmerica/Chicago6 by Greven because: (no reason
given)
a reply to: Phage
Yes, and it was -1.44º somewhere else.
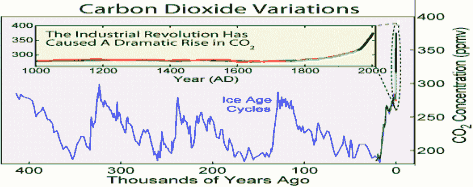
The point is, we don't use ice core data to determine current temps, now do we ? This is the problem with climatology combining different proxies to validate and justify their dogmatic theory to current "trends" using completely different proxies. AKA: They utilize historical ice core data to determine so-called historical levels of temps and CO2 levels, and lean on that to try to show that everything we're seeing today is "unprecidented".
And with that being said, I even question the established historical CO2 levels when you take Fick's Law into consideration.
But my own opinion aside, the current warming is not outside of naturally occuring climate trends of the past. It doesn't matter if we're looking at just the northern hemisphere or just the southern hemisphere, just Greenland, just Antactica, or all at the same time... Hell, even the global average warming is still within the established error margins, for crying out loud.
I don't think the poster was trying to make a claim that it hasn't warmed. I think he/she was just simply attempting to put things into its proper perspective. It doesn't matter if you're looking at one area's temps, or global averages... the temp increases overall are NOT the "OMG-we're-all-gonna-die" doomsday scenario that the MSM and "officials" are trying to pound into us.
I believe that's the point this poster was trying to make.
Again, climatology is guesstimate after guesstimate at best, particularly when it comes to historical data (as well as future trends).
Have we added to CO2 levels ? Yes.
Has the planet warmed up a bit more ? Yes.
Do we fully understand exactly why, what for, and how much ? Not a chance.
Maybe in another 20-30 years the science will get there, but we're no where near a full understanding yet.
Thus, should we really be implementing world policies based off of guesstimates and assumptions...? There's far too much at stake. Maybe if ourlords enslavers leaders could come up with better policies to push smarter technologies rather than just robbing us
blind with useless tax implementations, we might have something worthwhile to talk about.
I'm not sure where you're getting that 0.7º figure from. Are you talking about average global temperature? That's not what the posted chart represents. It shows reconstructed temperatures from a particular location in Greenland. With that in mind it may be more useful to look at what the increase near that location has been. The ten year average is more like 1.44º higher than it was then. Apparently warmer than it was during the Medieval warm period at that location.
Yes, and it was -1.44º somewhere else.
The point is, we don't use ice core data to determine current temps, now do we ? This is the problem with climatology combining different proxies to validate and justify their dogmatic theory to current "trends" using completely different proxies. AKA: They utilize historical ice core data to determine so-called historical levels of temps and CO2 levels, and lean on that to try to show that everything we're seeing today is "unprecidented".
And with that being said, I even question the established historical CO2 levels when you take Fick's Law into consideration.
But my own opinion aside, the current warming is not outside of naturally occuring climate trends of the past. It doesn't matter if we're looking at just the northern hemisphere or just the southern hemisphere, just Greenland, just Antactica, or all at the same time... Hell, even the global average warming is still within the established error margins, for crying out loud.
But using data from one particular location as indicator that warming has not occurred (as the person who posted the GISP2 graph apparently intended) is not really very convincing, especially when "current warming" is defined as being 159 year ago. Posting that chart was pointless, seeming to imply that warming has not been occurring at an accelerating rate.
I don't think the poster was trying to make a claim that it hasn't warmed. I think he/she was just simply attempting to put things into its proper perspective. It doesn't matter if you're looking at one area's temps, or global averages... the temp increases overall are NOT the "OMG-we're-all-gonna-die" doomsday scenario that the MSM and "officials" are trying to pound into us.
I believe that's the point this poster was trying to make.
Again, climatology is guesstimate after guesstimate at best, particularly when it comes to historical data (as well as future trends).
Have we added to CO2 levels ? Yes.
Has the planet warmed up a bit more ? Yes.
Do we fully understand exactly why, what for, and how much ? Not a chance.
Maybe in another 20-30 years the science will get there, but we're no where near a full understanding yet.
Thus, should we really be implementing world policies based off of guesstimates and assumptions...? There's far too much at stake. Maybe if our
a reply to: Greven
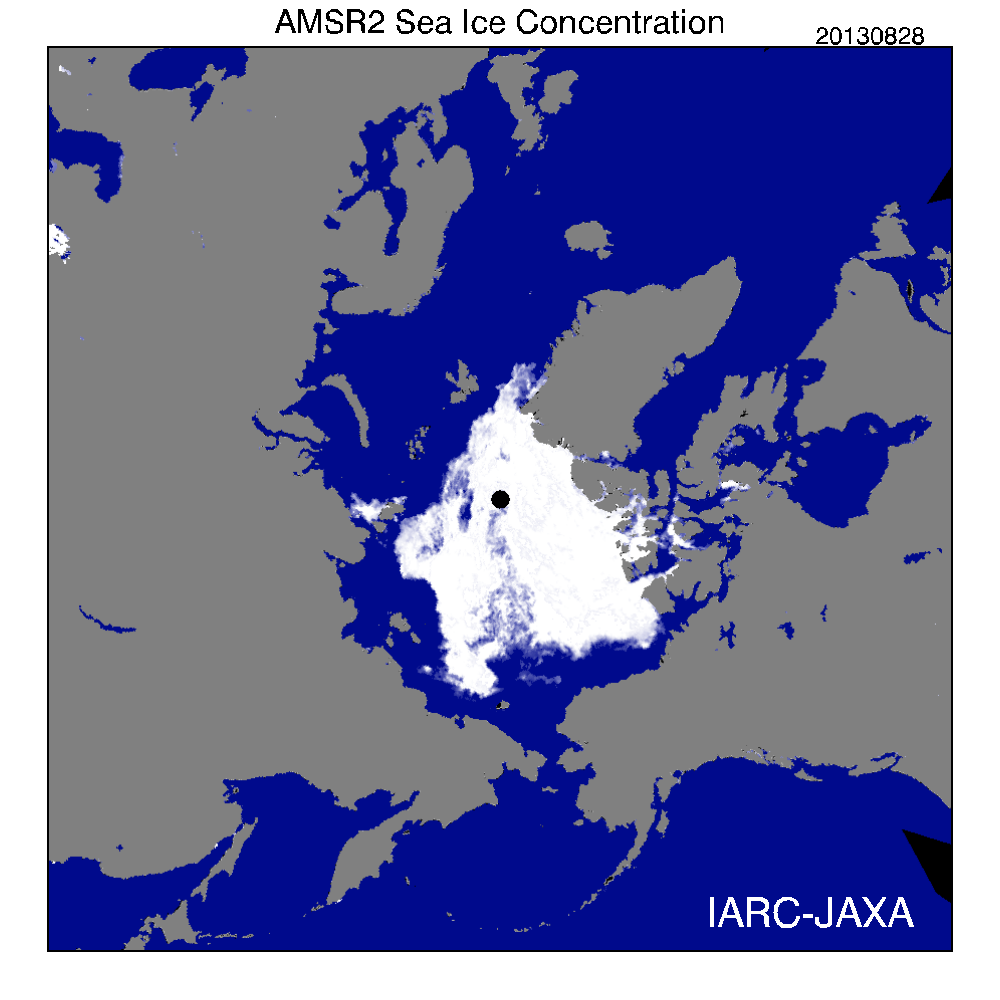
Melting its not.....
Arctic Ice
Melting its not.....
Arctic Ice
edit on 27 6 2014 by glend because: (no reason given)
a reply to: CranialSponge
Not guesstimates. Not assumptions. The science of radiative forcing. That is the basis. That cannot be disputed. How quickly will it happen can be. Will it happen, is it happening, cannot be.
And yes we should be implementing policies now because now is too late to do anything about the short term (50 year) changes that will occur but something can be done about the long term damage which will result from accelerating warming.
Those policies should include planning for the effects which are unavoidable. Those policies should include strategies for adapting for those changes. Those policies should include ways of mitigating the rate of change in order to allow time to implement all of those things.
Doing nothing is stupid. Doing nothing will cost far more in the long run, not just economically but socially. Unfortunately, doing nothing is human nature. Unfortunately doing something costs money. Unfortunately "What's in it for me and what's it going to cost me" is human nature and human nature is likely to prevail. Preserving our current lifestyle at any long term cost is all important. It's easy to say "It's not my problem", even easier to say "there is no problem." Sitting on your hands is easy.
Maybe in another 20-30 years the science will get there, but we're no where near a full understanding yet. Thus, should we really be implementing world policies based off of guesstimates and assumptions...?
Not guesstimates. Not assumptions. The science of radiative forcing. That is the basis. That cannot be disputed. How quickly will it happen can be. Will it happen, is it happening, cannot be.
And yes we should be implementing policies now because now is too late to do anything about the short term (50 year) changes that will occur but something can be done about the long term damage which will result from accelerating warming.
Those policies should include planning for the effects which are unavoidable. Those policies should include strategies for adapting for those changes. Those policies should include ways of mitigating the rate of change in order to allow time to implement all of those things.
Doing nothing is stupid. Doing nothing will cost far more in the long run, not just economically but socially. Unfortunately, doing nothing is human nature. Unfortunately doing something costs money. Unfortunately "What's in it for me and what's it going to cost me" is human nature and human nature is likely to prevail. Preserving our current lifestyle at any long term cost is all important. It's easy to say "It's not my problem", even easier to say "there is no problem." Sitting on your hands is easy.
edit on 6/28/2014 by Phage because: (no reason given)
a reply to: glend
One year? Are you kidding?
nsidc.org...
Arctic ice is going away.
One year? Are you kidding?
nsidc.org...
Arctic ice is going away.
edit on 6/28/2014 by Phage because: (no reason given)
a reply to: Phage
The point is, they aren't doing a damn thing.
They aren't implementing any viable policies... all they're doing is trying to mandate a ponzi tax scheme. How is that going to reduce our emissions ??
The proof is in the pudding, these guys don't give a damn about our futures, only their own.
If they were wanting to implement the types of policies such as the ones you're suggesting, I'd be the first one standing behind you cheering them on... whether I bought into this AGW stuff or not (which you know I don't).
I don't know of single AGW skeptic who would argue against implementing clean sustainable energy changes, viable mitigation/adaptation policies, smarter agricultural practices, reduction of petroleum dependencies, etc... and kicking the oil cartels to the curb once and for all.
According to Curryja, ( a lady climatologist) in her blog climate etc, the climate models used by climatologists does not include clouds! which shield
the ground from the sun, and oceans, seas, lakes, and ponds, also deliver rain, and sleet and snow, so how can the climate models be anywhere near
accurate?
i'm just wondering how everything is supposed to be.
how far off are we from the garden of eden climate?
how far off are we from the garden of eden climate?
originally posted by: Phage
a reply to: network dude
Cycles involving orbital and axial configurations which affect solar insolation, changes in solar irradiance, changes in ocean circulation patterns.
So if there has been significant melting in the past, what caused it? Whale farts possibly?
The argument that, because climate has changed naturally in the past it must mean that the current warming is natural doesn't hold any water. There were natural floods in the past. Does that mean a flood caused by a broken dam is a natural flood?
The factors which led to past warming are not occurring now. What is occurring now is that atmospheric CO2 levels are rising as a result of the burning of fossil fuels. That rise in CO2 levels increases radiative forcing. That increase in forcing increases the amount of heat captured by the atmosphere. The CO2 being released by burning fossil fuels is like that dam.
Phage, I was ready for you this time.
You missed this:
Our Earth is changing. It has been changing since 4.5 billion years ago. I can only assume it will continue to change. With, or without us.
Does this prove humans aren't doing terrible things to the Earth? nope. But it does shed some light on the global scare tactics that are being used.
Since I am not intelligent enough to KNOW for sure all these answers, I am just speculating and trying to learn. I will try like hell not to have to debate my way out of some statement I make that is wrong.
I didn't know if the ice caps had ever melted before, and when I found that information, it kind of surprised me. I wondered how the AGW crowd could make such a huge deal about it, if it's a natural occurrence.
a reply to: network dude
Yes they have melted many times in the past and at some point will probably refreeze again before melting again - it's a circular process.
Most of the flooding has already occurred that's why the North Sea and English channel are littered with so many mammoth and woolly rhino tusks and bones - 10,000's years ago the UK was not an island due to all the ice locked up at the poles. The land was also weighed down by the vast weights involved and northern landmasses have been 'springing' back up over the last few 1000 years steadily.
Has man's activity contributed to this - i would say probably but at a tiny fraction of the impact volcanic and solar activity have.
They should bring in a pollution tax not a carbon tax but that would cost them and not us.
a reply to: CranialSponge
Do you know what a Ponzi scheme is? It's a false investment scam. Taxation is not an investment but warming research (and more) which is funded by taxes is an investment...in our future.
ec.europa.eu...
www.whitehouse.gov...
www.epa.gov...
www.epa.gov...
Are you sure? Do you know what the US is doing? Planning? Do you know what the EU is doing? Have you seen the new EPA proposals? "They" are actually trying to do something but the noise from those who say there's nothing to worry about (oil) is awfully loud.
They aren't implementing any viable policies... all they're doing is trying to mandate a ponzi tax scheme. How is that going to reduce our emissions ??
Do you know what a Ponzi scheme is? It's a false investment scam. Taxation is not an investment but warming research (and more) which is funded by taxes is an investment...in our future.
ec.europa.eu...
www.whitehouse.gov...
www.epa.gov...
www.epa.gov...
edit on 6/28/2014 by Phage because: (no reason given)
Doing nothing is stupid. Doing nothing will cost far more in the long run, not just economically but socially. Unfortunately, doing nothing is human nature. Unfortunately doing something costs money. Unfortunately "What's in it for me and what's it going to cost me" is human nature and human nature is likely to prevail. Preserving our current lifestyle at any long term cost is all important. It's easy to say "It's not my problem", even easier to say "there is no problem." Sitting on your hands is easy.
Your wisdom rings true to me Phage.
I have recently gone back over the data, poured through the figures, and took a good long look into the mirror.
There is much for me to reconsider about much of the new data coming out.
Making me take another look into all this, as for hoaxes, stories, and yarns have at least 1 grain of truth within them.
So this whole Global Warming has earned a topic in my heart.
We teeter on the edge, and we are so smug to think otherwise. We are delusional beings, bound by our human nature.
edit on 17814285765 by
zysin5 because: Edit2
a reply to: Phage
Two years running.
www.ijis.iarc.uaf.edu...
What is significant is that Antartica's seasonal cover is also increasing against increasing CO2 atmospheric levels....
"The National Snow and Ice Data Centre said the rapid expansion had continued into May and the seasonal cover was now bigger than the record “by a significant margin’’"
a reply to: glend
No. That chart does not show 2013. But the data does.
6/27/13: 9,957,658
6/27/14: 9,507,130
A decline of 4.5% from last year. But I guess the obvious trend means nothing to you. You're more interesting in short term fluctuations.
nsidc.org...
nsidc.org...
Two years running.
No. That chart does not show 2013. But the data does.
6/27/13: 9,957,658
6/27/14: 9,507,130
A decline of 4.5% from last year. But I guess the obvious trend means nothing to you. You're more interesting in short term fluctuations.
nsidc.org...
Antarctic sea ice is quite different from Arctic sea ice (you can read about how it works and why increases in Antarctic sea ice extent are less subject to warming than the Arctic at the NSIDC site), but besides that I guess the loss of ice mass, when taking ice sheets into account, is insignificant.
What is significant is that Antarctica's seasonal cover is also increasing against increasing CO2 atmospheric levels....
nsidc.org...
edit on 6/28/2014 by Phage because: (no reason given)
a reply to: Phage
But in a world that is 4.54 billion years old we are both discussing short term fluctuations. As I have said once before if we go back a little in history we can see arctic growth/shrinkage from people that have mapped the sea ice extant for shipping.

But in a world that is 4.54 billion years old we are both discussing short term fluctuations. As I have said once before if we go back a little in history we can see arctic growth/shrinkage from people that have mapped the sea ice extant for shipping.
a reply to: glend
www.ijis.iarc.uaf.edu...
Do you really think that warming is not occurring?
Not annual fluctuations, trends. Downward trends. And what happened even 10 thousand years ago is of no concern. It's the next decades that matter.
But in a world that is 4.54 billion years old we are both discussing short term fluctuations.
Did they have satellite data? Did any of it look like this? Because none of those drawings do.
As I have said once before if we go back a little in history we can see arctic growth/shrinkage from people that have mapped the sea ice extant for shipping.
www.ijis.iarc.uaf.edu...
Do you really think that warming is not occurring?
edit on 6/28/2014 by Phage because: (no reason given)
a reply to: BABYBULL24
Absolutly. It's always the sun. For every ice age we enter or leave.
Anything else is just an excuse to raise taxes.
Absolutly. It's always the sun. For every ice age we enter or leave.
Anything else is just an excuse to raise taxes.
new topics
-
Are you ready for the return of Jesus Christ? Have you been cleansed by His blood?
Religion, Faith, And Theology: 1 hours ago -
Chronological time line of open source information
History: 2 hours ago -
A man of the people
Diseases and Pandemics: 3 hours ago -
Ramblings on DNA, blood, and Spirit.
Philosophy and Metaphysics: 4 hours ago -
4 plans of US elites to defeat Russia
New World Order: 5 hours ago -
Thousands Of Young Ukrainian Men Trying To Flee The Country To Avoid Conscription And The War
Other Current Events: 9 hours ago -
12 jurors selected in Trump criminal trial
US Political Madness: 11 hours ago
top topics
-
Israeli Missile Strikes in Iran, Explosions in Syria + Iraq
World War Three: 12 hours ago, 17 flags -
Iran launches Retalliation Strike 4.18.24
World War Three: 12 hours ago, 6 flags -
Thousands Of Young Ukrainian Men Trying To Flee The Country To Avoid Conscription And The War
Other Current Events: 9 hours ago, 6 flags -
12 jurors selected in Trump criminal trial
US Political Madness: 11 hours ago, 4 flags -
4 plans of US elites to defeat Russia
New World Order: 5 hours ago, 2 flags -
A man of the people
Diseases and Pandemics: 3 hours ago, 2 flags -
Chronological time line of open source information
History: 2 hours ago, 2 flags -
Ramblings on DNA, blood, and Spirit.
Philosophy and Metaphysics: 4 hours ago, 1 flags -
Are you ready for the return of Jesus Christ? Have you been cleansed by His blood?
Religion, Faith, And Theology: 1 hours ago, 0 flags
active topics
-
Are you ready for the return of Jesus Christ? Have you been cleansed by His blood?
Religion, Faith, And Theology • 7 • : chiefsmom -
Academia Has Become a Cancer in American Society
Education and Media • 8 • : FlyersFan -
Fossils in Greece Suggest Human Ancestors Evolved in Europe, Not Africa
Origins and Creationism • 66 • : Consvoli -
BREAKING: O’Keefe Media Uncovers who is really running the White House
US Political Madness • 17 • : pianopraze -
Russian intelligence officer: explosions at defense factories in the USA and Wales may be sabotage
Weaponry • 171 • : Oldcarpy2 -
So I saw about 30 UFOs in formation last night.
Aliens and UFOs • 32 • : Arbitrageur -
Israeli Missile Strikes in Iran, Explosions in Syria + Iraq
World War Three • 64 • : FlyersFan -
Two Serious Crimes Committed by President JOE BIDEN that are Easy to Impeach Him For.
US Political Madness • 17 • : TheSemiskepticII -
12 jurors selected in Trump criminal trial
US Political Madness • 33 • : Myhandle -
Biden--My Uncle Was Eaten By Cannibals
US Political Madness • 49 • : iaylyan