It looks like you're using an Ad Blocker.
Please white-list or disable AboveTopSecret.com in your ad-blocking tool.
Thank you.
Some features of ATS will be disabled while you continue to use an ad-blocker.

Quake Watch 2014
page: 68share:
a reply to: PuterMan
Nothing like another set of eyes to spot the mistakes! thanks.
Yes you are quite right, I made a mistake by adding the number of rows in the column, including the days of phase points, rather then the number of events, that gave an extra 48 lines, there were 139 as you say.
That changes the 2013 results, as does taking out the phase points in the Perigee-Apogee and Apogee-Perigee periods,
new numbers are
On point = 14/139 or 10.1%
Perigee-Apogee= 26/139 or 18.7%
Apogee-Perigee =61/139 or 43.9%
was previously
On point = 14/175 or 8%
Perigee-Apogee= 51/175 or 29.1%
Apogee-Perigee =86/175 or 49.1%
a reply to: PuterMan
I wondered if the I had the right calculation for the "on phase point %", maybe it should have been "count number on points /total number of phase points per year" rather "than count number on points/total number of events"
That would give for 2013 14/25 or 56% (versus 10.1%)
and for not quite half year 2014 7/13 or 53.8% (versus 9.6%)
I don't suppose it matters, as long as one says what the % is of.
edit on 06u16516514 by muzzy because: edited 4 times
F_E Region: South Africa
Time: 2014-06-15 14:16:28.1 UTC
Magnitude: 5.2
Epicenter: 26.55°E 26.87°S
Depth: 10 km
Status: A - automatic
geofon.gfz-potsdam.de...
usgs have 4.9mb± 0.104@5km reviewed
edit on 0600000016516514
by muzzy because: (no reason given)
can't find anything from SA News, but found this
9/56 YEAR CYCLE
and this
Simplified Geology and Selected Mineral Deposits map
haven't got time to compare quake location with mines right now ............ thats the suspicion
edit on 0600000016516514 by muzzy because: (no
reason given)
Moderate quake offshore the Iwaki, Japan coast:
USGS mag 5.7
geofon mag 5.6
ETA: Another one--same area, but closer to land, and twice as deep (makes sense, if they are on the subduction fault)
USGS Mag 5.6
geofon Mag 5.7
M 5.7 - 91km ESE of Iwaki, Japan
Time
2014-06-15 18:19:15 UTC
Location
36.643°N 141.781°E
Depth
22.8km
USGS mag 5.7
geofon mag 5.6
ETA: Another one--same area, but closer to land, and twice as deep (makes sense, if they are on the subduction fault)
USGS Mag 5.6
geofon Mag 5.7
edit on 6/15/2014 by Olivine because: add info
concerning a 2nd quake near Iwaki
a reply to: muzzy
Easy done!
I cobbled together this chart which shows the relationship of perigee and new moons - the two most geoeffective 'pulls'
Click the image to enlarge
The filled in blue spikes are perigee at the top and apogee at the bottom. The unfilled spikes which are black at the top and white at the bottom are black for new moon and white for full moon. Perigee and a new moon gives the greatest pull.
In Jan 2013 this was about the case and again in December - but it was very quiet then. The problem is that in order for this to be valid you would also need to know the aphelion and perihelion of the earth which of course we do and these are roughly the beginning of July and January respectively. This would therefore suggest that Earth's perihelion is off set by the lunar apogee as it is almost exactly opposed to the pull, in other words the Earth is a bit closer to the Sun but the Moon is a bit further from Earth.
Quite how it does not all fly off in different directions is beyond me. My brain hurts thinking about all this!!
Easy done!
I cobbled together this chart which shows the relationship of perigee and new moons - the two most geoeffective 'pulls'

Click the image to enlarge
The filled in blue spikes are perigee at the top and apogee at the bottom. The unfilled spikes which are black at the top and white at the bottom are black for new moon and white for full moon. Perigee and a new moon gives the greatest pull.
In Jan 2013 this was about the case and again in December - but it was very quiet then. The problem is that in order for this to be valid you would also need to know the aphelion and perihelion of the earth which of course we do and these are roughly the beginning of July and January respectively. This would therefore suggest that Earth's perihelion is off set by the lunar apogee as it is almost exactly opposed to the pull, in other words the Earth is a bit closer to the Sun but the Moon is a bit further from Earth.
Quite how it does not all fly off in different directions is beyond me. My brain hurts thinking about all this!!
a reply to: muzzy
I have yet to make my mind up whether David McMinn simply bends the data to fit the theory. He is well into the 55/56 year cycle and applies it to finance as well as earthquakes. He features often in various alternative geological publications. I sort of believe him as to the 55 year cycle, but the problem I have with this is, and other data, is that the data from anything earlier than 1920 or so is 'iffy' at best and his table is not easily understood unless I am being plain thick. Indeed he even states himself that it is a bit "iffy".
Now to me, if that is that case, you do not present the data instead of carrying on regardless!
I have yet to make my mind up whether David McMinn simply bends the data to fit the theory. He is well into the 55/56 year cycle and applies it to finance as well as earthquakes. He features often in various alternative geological publications. I sort of believe him as to the 55 year cycle, but the problem I have with this is, and other data, is that the data from anything earlier than 1920 or so is 'iffy' at best and his table is not easily understood unless I am being plain thick. Indeed he even states himself that it is a bit "iffy".
Problems arose in regard to the listing's suitability for appraisal and the result may be spurious.
Now to me, if that is that case, you do not present the data instead of carrying on regardless!
Just happened. Oklahoma, or there abouts. A significant earthquake just showed up on webicorders. I don't know how big because not all the trace has
completed. It's bigger than 4. -The rest of the trace came through. It's got to be around 4.5M . Just about an hour ago, there was another around
3.5M.
The usgs puts it at 4.2M? Whatevs...
There have also been a couple more in the 3 range that have followed the 4.whatever. They've really started this Monday off with a big fracking bang. Or, bangs.
The usgs puts it at 4.2M? Whatevs...
There have also been a couple more in the 3 range that have followed the 4.whatever. They've really started this Monday off with a big fracking bang. Or, bangs.
edit on 16-6-2014 by ericblair4891 because: (no reason given)
originally posted by: ericblair4891
Just happened. Oklahoma, or there abouts. A significant earthquake just showed up on webicorders. I don't know how big because not all the trace has completed. It's bigger than 4. -The rest of the trace came through. It's got to be around 4.5M . Just about an hour ago, there was another around 3.5M.
You sure it wasn't this 5.2 in Guatemala?
If my net connection wasn't to iffy right now (off & on with the DSL, line trouble somewhere) I'd have GEE going to watch the area in the event that it wasn't Guatemala's.
edit on 6/16/2014 by Nyiah because: (no reason given)
Edit: Nope, you're right, bud, 4.5 in Oklahoma according to the EMSC. Hot dang, that's not good
edit on 6/16/2014 by Nyiah because: (no reason given)
edit on 6/16/2014 by Nyiah because: (no reason
given)
M 6.1 - 31km ENE of Noatak, Alaska
The Preliminary quake was listed as 5.5
Time
2014-06-16 07:01:11 UTC-05:00
Location
67.704°N 161.999°W
Depth
15.6km
OK Edit
M 5.7 - 31km ENE of Noatak, Alaska
Time
2014-06-16 07:01:11 UTC-05:00
Location
67.702°N 162.000°W
Depth
16.0km
*******
M 5.8 - 42km ENE of Noatak, Alaska
Time
2014-06-16 07:00:33 UTC-05:00
Location
67.684°N 162.000°W
Depth
15.7km
So instead of one big one there are two big ones
edit on 16-6-2014 by berkeleygal because: (no reason given)
a reply to: berkeleygal
I think there's only one Alaskan earthquake. The AVO map doesn't have a webicorder that far north. But the Redout shows one clearly. Also, the USGS only shows one at the moment.
I also just checked others and it looks like one.
Also, to update Oklahoma, there's been about 5 earthquakes this morning. I am expecting a big earthquake in Alaska. This would be normal because Alaska is known for big earthquakes. I am also expecting a big earthquake in Oklahoma. This will not be normal, nor natural.
Oh, and one volcano is back. Etna. Check out Volcano Watch.
Also, in general, it doesn't seem so quiet anymore.
I love watching other trying to wrap their minds around the lunar cycle. Because, you can't simplify the problem to focus on one thing. Because yes, we have the earth's orbit around the sun as well. And I believe, you have to include our tilt on our axis into the mix. Plus, the makeup of the crust in relation to the amount of water in the system. You have drought and floods which will change this value. Etc, etc, etc...
I love the graphs guys.
Had to add. I just finished writing the quiet seems over when I saw another squiggle. It was on Momotombo and I thought the Alaskan one had shown up on the webicorder. But it looked to big. Yup, it wasn't Alaska, it was Columbia. 5.5
Did I say Columbia? No, that's the stupid USGS put it at. When you look at a map, well, it's out in the ocean, closer to Nicarauga, Costa Rica, and Panama. Ugh. - At least the EMSC put it north of Panama.
I'm so sorry that I am obsessed with the quiet cliche'. I looked again, and it's still kinds quiet.
The following is the Top 111 overused movie lines. Skip to minute 2:04 of the video for the "too quiet" line.
www.youtube.com...
I think there's only one Alaskan earthquake. The AVO map doesn't have a webicorder that far north. But the Redout shows one clearly. Also, the USGS only shows one at the moment.
I also just checked others and it looks like one.
edit on 16-6-2014 by ericblair4891 because: (no reason given)
Also, to update Oklahoma, there's been about 5 earthquakes this morning. I am expecting a big earthquake in Alaska. This would be normal because Alaska is known for big earthquakes. I am also expecting a big earthquake in Oklahoma. This will not be normal, nor natural.
Oh, and one volcano is back. Etna. Check out Volcano Watch.
edit on 16-6-2014 by ericblair4891 because: (no reason given)
Also, in general, it doesn't seem so quiet anymore.
I love watching other trying to wrap their minds around the lunar cycle. Because, you can't simplify the problem to focus on one thing. Because yes, we have the earth's orbit around the sun as well. And I believe, you have to include our tilt on our axis into the mix. Plus, the makeup of the crust in relation to the amount of water in the system. You have drought and floods which will change this value. Etc, etc, etc...
I love the graphs guys.
Had to add. I just finished writing the quiet seems over when I saw another squiggle. It was on Momotombo and I thought the Alaskan one had shown up on the webicorder. But it looked to big. Yup, it wasn't Alaska, it was Columbia. 5.5
Did I say Columbia? No, that's the stupid USGS put it at. When you look at a map, well, it's out in the ocean, closer to Nicarauga, Costa Rica, and Panama. Ugh. - At least the EMSC put it north of Panama.
I'm so sorry that I am obsessed with the quiet cliche'. I looked again, and it's still kinds quiet.
The following is the Top 111 overused movie lines. Skip to minute 2:04 of the video for the "too quiet" line.
www.youtube.com...
edit on 16-6-2014 by ericblair4891 because: (no reason given)
a reply to: ericblair4891
Yep, there's only one. The 5.7, followed by two 3.1's and a 3.8.
6 total for today, so far
3.8
35km ENE of Noatak, Alaska
2014-06-16 07:56:50 UTC-05:00
13.3 km
3.1
31km E of Noatak, Alaska
2014-06-16 07:28:57 UTC-05:00
5.4 km
3.1
25km NE of Noatak, Alaska
2014-06-16 07:23:07 UTC-05:00
21.3 km
5.7
31km ENE of Noatak, Alaska
2014-06-16 07:01:08 UTC-05:00
24.2 km
4.2
29km ENE of Noatak, Alaska
2014-06-16 07:00:30 UTC-05:00
15.4 km
3.1
41km E of Noatak, Alaska
2014-06-16 06:38:41 UTC-05:00
17.0 km
Meteorologist reacts, when Oklahoma earthquake hits during forecast!
www.wtae.com... v%2Bpittsburgh
WOQ
www.wtae.com... v%2Bpittsburgh
WOQ
a reply to: ericblair4891
I agree with you that Okie is going to have a 6+
I am uneasy as my daughter is attending a gymnastics camp at the U, and are staying with family in Edmond...right smack dab in the middle of the action
I agree with you that Okie is going to have a 6+
I am uneasy as my daughter is attending a gymnastics camp at the U, and are staying with family in Edmond...right smack dab in the middle of the action
All morning I've been wanting to avoid writing this post. I've been trying to ignore Alaska, but my bones won't let me. (Oh that reminds me, I have a
story on the swarm in the north of Alaska. Mysterious!!!) For several weeks, I have been refamiliarizing with the Alaskan webicorders so I know what's
"normal". At times, I've been bored stiff. But not today. There may be something brewing. Alaska is even outpacing Oklahoma to regain it's position as
#1 earthquake state in Americer. Wow. There's been about a dozen. And, that EMSC didn't carry many of them. 2.5+. Puterman, and Muzzy, do you guys
have your own lists that manage to gathering all the reporting in one real list. I know you've discussed this issue, but I can't remember where the
idea went. I just wish for one spot to look if I'm rushed. I always find myself cross-referencing. I do that anyway, but only when I want to watch an
area closer. When I'm trying to browse list to get a feel for the activity in general, and when I'm trying to key on a region that's starting to wind
up, I can't because none of the services have a full list. I don't care if it's too long, and has every little burp, I just want to follow it fully.
And, it ain't happening now due to gaps in those lists. I'll stop, and let you guys get back to harping about them, and I'll just watch my little area
of the globe. Oh, Ubanis is back with a new webcam. And, in general, volcanic activity seems to be at a mild increase. But not really, because others
have ebbed for now. I'll try to look at Puterman's graphs on volcano watch.
Before I mess up and erase what I just wrote, here's the webicorder from Redoubt.
Here's the article about the Alaskan swarm.
www.adn.com.../99/188/
I've mentioned before that the original activity began with coupled earthquakes. Hmmm. I'm not even sure why I am so interested in "double taps". This swarm doesn't not have a main shocks. So, no preshocks or aftershocks. Just shocks. The activity first happened in April, and April was when we had a very significant clustering of large quakes. I think no coincidence. (how do I spell, hmph? - my kid has been doing that noise, whatever it is or means.)( i'm old, old old bones... but they're wise, foolish bones.) Sorry, the weather is hot, I am reluctant to get into the garden, and I think I'm not thinking right...)_
edit on 17-6-2014 by ericblair4891 because: (no reason given)
edit on 17-6-2014 by ericblair4891
because: (no reason given)
M4.1 - 9km N of Spencer, Oklahoma 2014-06-18 10:53:02 UTC
earthquake.usgs.gov...
Is it just me, or are the 4's in Oklahoma becoming much more frequent recently? At any rate, I don't think Oklahoma's finished putting it's 2 cents' worth in yet.
earthquake.usgs.gov...
Is it just me, or are the 4's in Oklahoma becoming much more frequent recently? At any rate, I don't think Oklahoma's finished putting it's 2 cents' worth in yet.
a reply to: Nyiah
It's not just you. Oklahoma is a conundrum.
t's as if the past century of oil drilling, coupled with high-pressure waste-injection wells, and possibly drought, have conspired to rearrange the bedrock. I fear another moderately strong quake is on the horizon for our Sooner friends.
I'd love to see the state experiment with a month long moritorium on injection well activity, just to see if things quiet down.
*************************
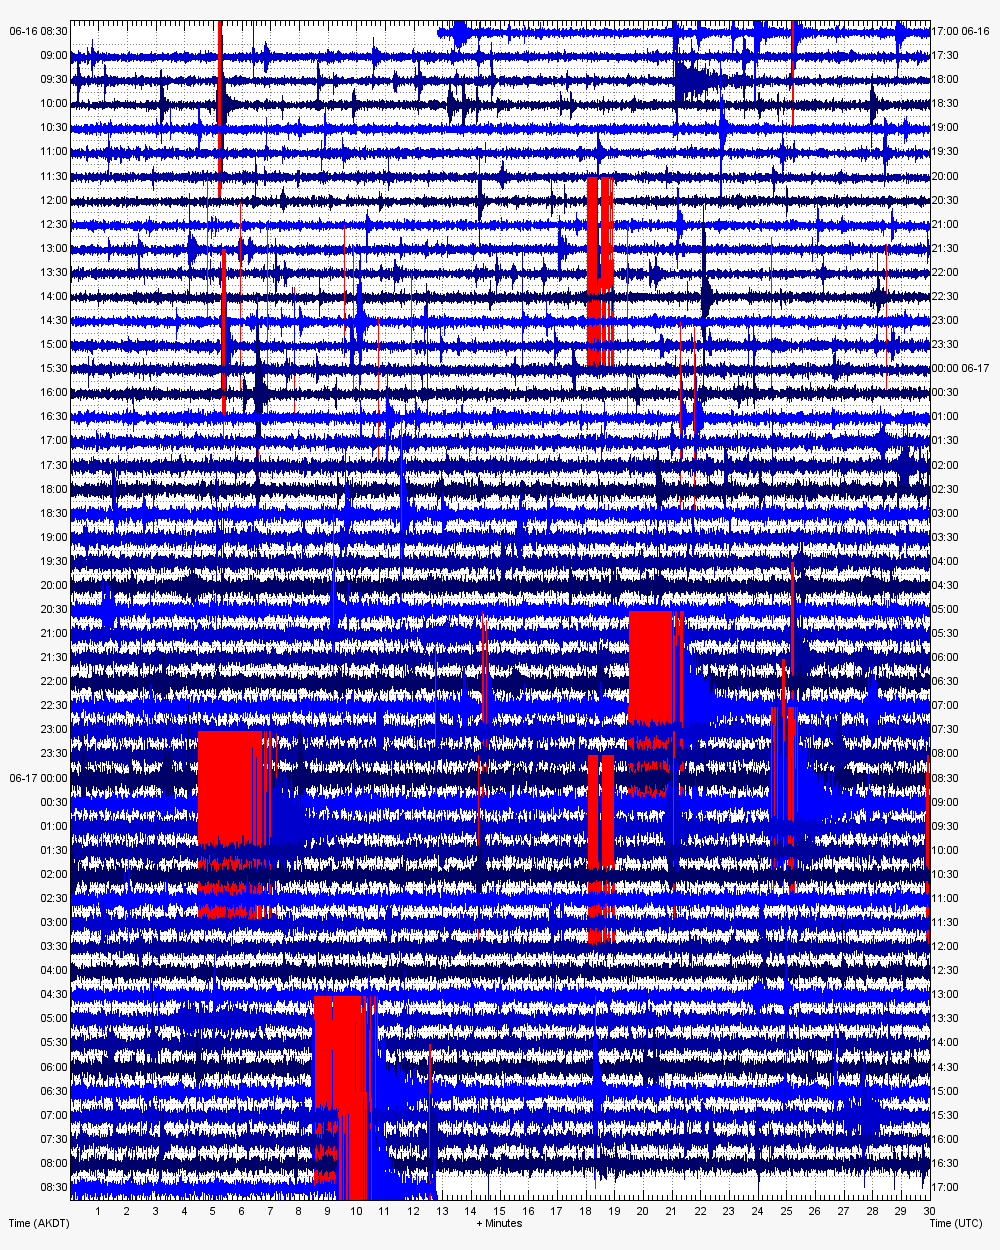
I think we just had a small earthquake north of me. I felt suddenly dizzy, so I went looking and found this:
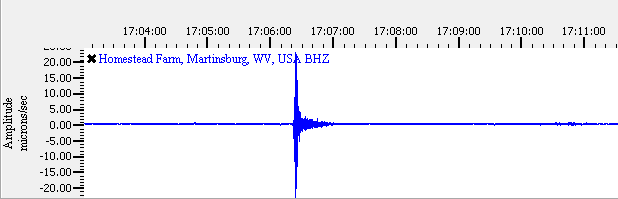
TA.P57A..BHZ near Martinsburg, WV
************************
Oklahoma just had another mag 3+, looking at the Tulsa seismo, in GEE....
It's not just you. Oklahoma is a conundrum.
t's as if the past century of oil drilling, coupled with high-pressure waste-injection wells, and possibly drought, have conspired to rearrange the bedrock. I fear another moderately strong quake is on the horizon for our Sooner friends.
I'd love to see the state experiment with a month long moritorium on injection well activity, just to see if things quiet down.
*************************
I think we just had a small earthquake north of me. I felt suddenly dizzy, so I went looking and found this:
TA.P57A..BHZ near Martinsburg, WV
************************
Oklahoma just had another mag 3+, looking at the Tulsa seismo, in GEE....
a reply to: Nyiah
Oklahoma quake information (maps and lists) can be read here at CERI
This page has Analytical tools which are quite good, you can get cross-section, mag-time, depth-time and cumulative# graphs with a few clicks of your mouse, although personally I don't like the style of the graphs (with the plot tails) myself.
here is how you work it;
move the map around to where you want it, zoom in if necessary,
select Analyze
then follow the instructions
here I have the area selected Largest:4.3, Smallest: 0.4, Latest: 2014/6/18, Earliest: 2013/12/19 (*that is all that is available here)
 (click image for larger version, opens in new
tab/window)
(click image for larger version, opens in new
tab/window)
Plot Type below is Mag-Time
 (click image for larger version, opens in new
tab/window)
(click image for larger version, opens in new
tab/window)
I've cropped the height a bit, as the graph doesn't show below M2.5 anyway
If you a have a play with it you may have to redo the proceedure several times as the map resets itself occasionally without any manual input.
here is another one, M4>
 (click image for larger version, opens in new
tab/window)
(click image for larger version, opens in new
tab/window)
Is it just me, or are the 4's in Oklahoma becoming much more frequent recently?
Oklahoma quake information (maps and lists) can be read here at CERI
This page has Analytical tools which are quite good, you can get cross-section, mag-time, depth-time and cumulative# graphs with a few clicks of your mouse, although personally I don't like the style of the graphs (with the plot tails) myself.
here is how you work it;
move the map around to where you want it, zoom in if necessary,
select Analyze
then follow the instructions
here I have the area selected Largest:4.3, Smallest: 0.4, Latest: 2014/6/18, Earliest: 2013/12/19 (*that is all that is available here)

Plot Type below is Mag-Time

I've cropped the height a bit, as the graph doesn't show below M2.5 anyway
If you a have a play with it you may have to redo the proceedure several times as the map resets itself occasionally without any manual input.
edit on 06u16816814 by muzzy because: (no reason given)
here is another one, M4>

edit on 06u16816814 by muzzy because: (no reason given)
Okie-Dokie Okies .................
I'm sure I've done this before, but probably due for an update
You can also get this information from the OGS with basic maps and lists, but not the whole 96 years and 10,698 earthquakes at once or on one graph, this is where the Leonard Geophysical Observatory comes in handy, Catalog is here
 (click image for larger version, opens in
new tab/window)
(click image for larger version, opens in
new tab/window)
How much does improved technology in recording earthquakes play in the data? looks to me is probably a bit behind everywhere else in the World, here there is no uptick after 1945, it takes until the 1960's to see the smaller quakes showing up. This isn't to say they were not happening, just they weren't recorded.
Biggest quake remains the 5.6Mw of 06/11/2011 in Lincoln County, closely followed by the 5.5Mw of 11/04/1952 in Canadian County.
End of 1975 seen the start of a steady rate of quakes (2-3 a month, but scattered locations) through 1979 (up to 31 in one day on 18/03/1979, in Canadian County), not sure if this is the advent of "fracking" or not, seems a bit early, perhaps others can elaborate on this?
1979 to end 1999 steady at 1-2 a day with the odd day with 7 (eg Grady County on 16/04/1999)
relatively quiet 1999 through to 2009 (2-11 per month, scattered locations), *(interesting that all data for 2009 is USGS, not OGS (was this the Period of Denial?))
then it really took off in 2010, to the frenzy it is today (17-22 per day in the last 3 days)
I've split that graph back to those periods mentioned above, below;
If anyone want's to see closer/other timelines or split into Counties, just ask and I'll do the graph and or map.
1975-79
 (click image for larger version, opens in
new tab/window)
(click image for larger version, opens in
new tab/window)
1980-1999
 (click image for larger version, opens in
new tab/window)
(click image for larger version, opens in
new tab/window)
2000-2009
 (click image for larger version, opens in
new tab/window)
(click image for larger version, opens in
new tab/window)
2010-2014
 (click image for larger version, opens in
new tab/window)
(click image for larger version, opens in
new tab/window)
I'll do an interactive map, but, 10,698 is a LOT of icons, will probably have to limit the text inside the popups to get it to work.
edit:
correction, 10,605, I took out the lines that had 0 magnitude.
File was 7.5MB while loading to Google Earth, saved the file off GE and it was only 389KB
A lot of the early ones are on top of each other, (only 1 decimal point in the lat/long)
 (click image for interactive map, opens in new tab/window)
I'm sure I've done this before, but probably due for an update
You can also get this information from the OGS with basic maps and lists, but not the whole 96 years and 10,698 earthquakes at once or on one graph, this is where the Leonard Geophysical Observatory comes in handy, Catalog is here

How much does improved technology in recording earthquakes play in the data? looks to me is probably a bit behind everywhere else in the World, here there is no uptick after 1945, it takes until the 1960's to see the smaller quakes showing up. This isn't to say they were not happening, just they weren't recorded.
Biggest quake remains the 5.6Mw of 06/11/2011 in Lincoln County, closely followed by the 5.5Mw of 11/04/1952 in Canadian County.
End of 1975 seen the start of a steady rate of quakes (2-3 a month, but scattered locations) through 1979 (up to 31 in one day on 18/03/1979, in Canadian County), not sure if this is the advent of "fracking" or not, seems a bit early, perhaps others can elaborate on this?
1979 to end 1999 steady at 1-2 a day with the odd day with 7 (eg Grady County on 16/04/1999)
relatively quiet 1999 through to 2009 (2-11 per month, scattered locations), *(interesting that all data for 2009 is USGS, not OGS (was this the Period of Denial?))
then it really took off in 2010, to the frenzy it is today (17-22 per day in the last 3 days)
I've split that graph back to those periods mentioned above, below;
If anyone want's to see closer/other timelines or split into Counties, just ask and I'll do the graph and or map.
1975-79

1980-1999

2000-2009

2010-2014

I'll do an interactive map, but, 10,698 is a LOT of icons, will probably have to limit the text inside the popups to get it to work.
edit:
correction, 10,605, I took out the lines that had 0 magnitude.
File was 7.5MB while loading to Google Earth, saved the file off GE and it was only 389KB
A lot of the early ones are on top of each other, (only 1 decimal point in the lat/long)
edit on 0600000016916914 by muzzy because: add interactive map
new topics
-
This is our Story
General Entertainment: 2 hours ago -
President BIDEN Vows to Make Americans Pay More Federal Taxes in 2025 - Political Suicide.
2024 Elections: 4 hours ago -
Ode to Artemis
General Chit Chat: 5 hours ago -
Ditching physical money
History: 8 hours ago -
One Flame Throwing Robot Dog for Christmas Please!
Weaponry: 9 hours ago -
Don't take advantage of people just because it seems easy it will backfire
Rant: 9 hours ago -
VirginOfGrand says hello
Introductions: 10 hours ago -
Should Biden Replace Harris With AOC On the 2024 Democrat Ticket?
2024 Elections: 10 hours ago
top topics
-
University student disciplined after saying veganism is wrong and gender fluidity is stupid
Education and Media: 13 hours ago, 12 flags -
Police clash with St George’s Day protesters at central London rally
Social Issues and Civil Unrest: 16 hours ago, 9 flags -
President BIDEN Vows to Make Americans Pay More Federal Taxes in 2025 - Political Suicide.
2024 Elections: 4 hours ago, 9 flags -
TLDR post about ATS and why I love it and hope we all stay together somewhere
General Chit Chat: 17 hours ago, 7 flags -
Should Biden Replace Harris With AOC On the 2024 Democrat Ticket?
2024 Elections: 10 hours ago, 6 flags -
Don't take advantage of people just because it seems easy it will backfire
Rant: 9 hours ago, 4 flags -
One Flame Throwing Robot Dog for Christmas Please!
Weaponry: 9 hours ago, 4 flags -
God lived as a Devil Dog.
Short Stories: 14 hours ago, 3 flags -
Ditching physical money
History: 8 hours ago, 3 flags -
VirginOfGrand says hello
Introductions: 10 hours ago, 2 flags
active topics
-
This is our Story
General Entertainment • 1 • : Encia22 -
The Reality of the Laser
Military Projects • 32 • : DronesandUFOs -
whistleblower Captain Bill Uhouse on the Kingman UFO recovery
Aliens and UFOs • 17 • : vance2 -
DerBeobachter - Electric Boogaloo 2
Introductions • 13 • : DerBeobachter2 -
One Flame Throwing Robot Dog for Christmas Please!
Weaponry • 7 • : OzBiker -
University student disciplined after saying veganism is wrong and gender fluidity is stupid
Education and Media • 26 • : DerBeobachter2 -
President BIDEN Vows to Make Americans Pay More Federal Taxes in 2025 - Political Suicide.
2024 Elections • 4 • : 727Sky -
British TV Presenter Refuses To Use Guest's Preferred Pronouns
Education and Media • 128 • : Consvoli -
Terrifying Encounters With The Black Eyed Kids
Paranormal Studies • 70 • : burritocat -
Tucker Carlson UFOs are piloted by spiritual entities with bases under the ocean and the ground
Aliens and UFOs • 42 • : Jukiodone