It looks like you're using an Ad Blocker.
Please white-list or disable AboveTopSecret.com in your ad-blocking tool.
Thank you.
Some features of ATS will be disabled while you continue to use an ad-blocker.

Quake Watch 2014
page: 26share:
reply to post by radpetey
No I don't believe they do.
Only YMR is showing anything interesting and it looks more like snow blowers than harmonic tremor.
No I don't believe they do.
Only YMR is showing anything interesting and it looks more like snow blowers than harmonic tremor.
Reviewing data is very important, especially when you are following trends or compiling graphs.
I did it for a while on my NZ earthquakes blog a few years back, but it was too much work, especially when the Christchurch quakes hit, actually it might have been the 2009 Dusky Sound 7.6 that made me throw the files away.
But I've got back into it, partly with the help of QVS DataPro to get the Preliminary data, its faster.
Here is a prime example of what difference a review can make.
One event. Source: Geonet
ID: 2014p159748
Status: preliminary
Date/Time UTC: 01/03/2014 02:33:59
Latitude, Longitude: -36.51749, 178.80264
Magnitude: 3.59ML
Energy Released (TTNT): 3.6594
Depth: 125.9km
Location: Auckland-Coromandel-Whakatane Seamount
Ref: 2014p159748
Status: reviewed, Updated on: 05/03/2014 04:39:10
When: 01/03/2014 02:33:47 UTC (12 second difference)
Lat/Long: -35.6084 179.764 (different location)
Depth: 33 km (shallower)
Mag: 4.0942 ML (bigger)
No. of Phases used: 53
Location: Whangarei-Rumble3-Healy (now in a totally different GL Region)
now the most significant difference
Energy Released: 20.8789 tonnes of TNT
17.2 Tonnes of TNT makes a BIG difference in the energy released when building a monthly/yearly ER graph.
the difference of TTNTER, thats about a M4.04, on top of the M3.59 !!!!!
gsaim.wordpress.com...
*I believe I don't need ex tags, as I created the data myself, source is mentioned
edit on 03u656514 by muzzy because: F_E for
GL
PuterMan
reply to post by radpetey
No I don't believe they do.
Only YMR is showing anything interesting and it looks more like snow blowers than harmonic tremor.
I did not think so at all.....some other fellow on another site was having a doomgasam about these seismos.
Thank you for responding!
Something is perking in Puerto Rico.
UTC Time Lat Long Depth Mag Network RMS ERH ERZ GAP Q Int nStat
2014-03-07 04:51:19:55 19.526 -67.9745 34 2.71 md RSPR 0.29 2.55 18.56 294 C I 6
2014-03-07 04:54:07:77 19.4688 -67.959 34 2.68 md RSPR 0.26 2.49 16.66 298 C I 5
2014-03-07 06:16:21:84 19.543 -67.9456 30 3.88 md RSPR 0.36 2.00 22.27 267 C I 24
2014-03-07 10:05:28:46 19.6996 -64.2823 24 3.25 md RSPR 0.05 1.16 9.37 313 B I 4
2014-03-07 15:02:32:54 18.1433 -65.8291 4 1.40 md RSPR 0.08 10.60 1.20 192 C I 3
2014-03-07 15:44:34:58 18.0755 -67.2215 22 1.90 md RSPR 0.09 0.75 0.81 253 B I 6
2014-03-07 18:20:12:88 19.143 -67.3251 35 2.98 md RSPR 0.21 1.38 6.24 300 C I 8
2014-03-07 19:11:05:20 19.1473 -67.199 6 2.94 md RSPR 0.31 1.73 1.79 247 C I 13
2014-03-07 22:28:20:97 18.9141 -65.3208 72 3.30 md RSPR 0.31 3.18 3.73 236 C I 11
2014-03-07 22:43:18:41 19.0003 -65.295 66 3.14 md RSPR 0.28 3.07 5.09 244 C I 7
2014-03-07 22:50:42:88 17.9141 -66.8141 9 2.16 md RSPR 0.24 0.74 1.16 190 C I 9
2014-03-07 22:57:24:13 19.0476 -65.345 49 2.81 md RSPR 0.30 4.26 8.95 267 C I 7
2014-03-07 23:15:29:76 19.0838 -65.3253 45 3.38 md RSPR 0.23 1.95 6.06 243 C I 13
2014-03-07 23:26:39:02 19.021 -65.307 56 3.14 md RSPR 0.25 2.69 5.88 267 C I 6
2014-03-07 23:35:08:21 18.9615 -65.2918 77 3.14 md RSPR 0.26 3.15 4.08 264 C I 7
2014-03-07 23:38:50:49 19.0631 -65.3526 34 3.67 md RSPR 0.26 1.45 8.38 260 C I 15
2014-03-07 23:41:07:84 18.7425 -65.3328 90 2.97 md RSPR 0.17 2.16 1.55 239 C I 7
2014-03-07 23:43:26:14 18.9193 -65.3746 60 3.24 md RSPR 0.40 4.05 6.17 255 C I 11
2014-03-08 00:01:09:57 18.8346 -65.3463 74 3.01 md RSPR 0.25 2.80 3.34 249 C I 7
2014-03-08 00:55:19:28 19.6246 -67.8791 12 3.32 md RSPR 0.18 3.81 5.78 283 C I 8
2014-03-08 01:17:36:43 19.043 -65.3428 44 3.27 md RSPR 0.20 1.92 5.50 259 C I 12
Source:
redsismica.uprm.edu...
WOQ
edit on 7-3-2014 by wasobservingquietly because: (no reason given)
The 1918 Puerto Rico earthquake caused a tsunami so as long as people are prepared we hopefully won't see another Indonesia or Japan situation if a
big one hits that trench. I don't know if they have some sort of a siren system. If they don't I think this should be a top priority.
The Midwest quakes are also worrying (Oklahoma). The repetitive 3.1's from California for months now seem weird (even for California), but it's difficult to know what to think about California so unless one of the experts draws attention I don't think much of it. I will say the August 2012 swarm in Southern Cali (over 100 in what I think was a day) still sticks with me as significant. I feel that from out frame of reference (in the past so isolated) it doesn't mean a lot - but in the long run (in hindsight) we might see it as a warning of something more.
That last statement is not based on anything scientific (from me) but rather it was so hugely unusual that it fits into other things going on over the past couple of years more than I believe we currently understand. Or...maybe it has been included in someone's analysis herein and I'm not aware of that.
reply to post by Dianec
The Oklahoma quakes are not in the least worrying, in the sense that the cause is unknown. Worrying indeed that they happen but......
The Church is admitting that the disposal of waste water is the culprit.
Source
Note that this is an update to earlier releases.
The Oklahoma quakes are not in the least worrying, in the sense that the cause is unknown. Worrying indeed that they happen but......
The United States Geological Survey (USGS) issued a press release (Released: 3/6/2014 [US Date] 5:00:00 PM ) indicating that the magnitude 5.7 earthquake that struck Prague, Oklahoma in 2011 was unintentionally human-induced.
The Church is admitting that the disposal of waste water is the culprit.
The 5.7 magnitude quake in Prague followed an injection of waste-water approximately 650 feet away from the Wilzetta fault zone, a complex fault system about 124 miles in length. All three earthquakes exhibited a slip-strike motion, and did so at three different locations, indicating that three separate areas of the fault zone were activated.
Source
Note that this is an update to earlier releases.
edit on 8/3/2014 by PuterMan because: (no reason given)
muzzy
more on Ryukyu Islands post by muzzy
blah blah blah etc
* I noticed on that interactive map from 04/2007 (7 days worth) the lack of earthquakes in the Hitachi Mountains (I don't know what their real name is, but they are just north of Hitachi (which is NE of Tokyo, on the east coast)), compared to recent times. The daily maps I'm doing on GSAIM have heaps of them in the NEID Preliminary data every day, and even on JMA Reviewed data there would be about a dozen per day average over 7 days in those mountains now, I wonder if those were "triggered" by the 11/2011 M9.0 Tohoku monster? and are ongoing since then?
Interesting.
yeah those mountains got wacked with a 5.6 and a 5.7 on the day of the 9.0, quite significant earthquakes in their own right, in fact those were the biggest quakes on land in the first 9 hours after the big one.
So the current activity could still be related to those, or any subsequent large quakes ( I haven't checked yet)
9.0 Tohoku interactive map
Just going over our most recent M6 event here on land in New Zealand 46 days afterwards.
Again REVIEW changes a lot of things;
Status: PRELIMINARY
Date/Time (UTC): 20/01/2014 02:52:00
Main shock
Lat: -40.6193 Long: 175.8499
Magnitude: 6.1814ML
Depth: 33.4766 km
Location: 15 km east of Eketahuna
Catalog Source: GeoNet Rapid earthquake catalogue
Status: REVIEWED
Date/Time (UTC): 20/01/2014 02:52:46
Main shock
Lat: -40.6206 Long: 175.865
Magnitude: 6.2298ML
Depth: 34.1797 km
Updated on: 29/01/2014 03:07:04
Location: 15 km east of Eketahuna
Catalog Source: GeoNet earthquake catalogue
What was really surprising initially was the lack of aftershocks for the first two hours and forty minutes, usually the big aftershocks hit within that time period.
Ha! on REVIEW an extra 78 (new) aftershocks in those 2:40 hrs, M2's,3's and 4's
3 HOURS PRELIMINARY
mag1= 2 , mag2= 7 , mag3= 0
mag4= 0 , mag5= 0 , mag6= 1
total= 10, total energy released= 28,217.64 TTNT
goo.gl...
3 HOURS ON REVIEW
mag1= 3 , mag2= 62 , mag3= 20
mag4= 3 , mag5= 0 , mag6= 1
total= 89, total energy released= 33,466.911TTNT
goo.gl...
I finished the preliminary maps at 15 days, and that has changed a bit too, an extra 64 earthquakes, so some must have been deleted as well.
Quite likely those ones down near Castlepoint (string of M3's on the preliminary map below that are no longer on the reviewed map)
15 DAYS PRELIMINARY
mag1= 1192 , mag2= 508 , mag3= 65
mag4= 2 , mag5= 0 , mag6= 1
total= 1768, total energy released= 28,521.06 TTNT
goo.gl...
15 DAYS ON REVIEW
mag1= 1200 , mag2= 548 , mag3= 72
mag4= 11 , mag5= 0 , mag6= 1
total= 1832, total energy released= 34,134.94 TTNT
goo.gl...
so wheres it at right now?
46 DAYS ON REVIEW
mag1= 1945 , mag2= 724 , mag3= 86
mag4= 11 , mag5= 0 , mag6= 1
total= 2767, total energy released= 34,188.751TTNT
goo.gl...
Interest in the Eketahuna quake is low compared to some of the other big events I have tracked
Views - Page
23 - Eketahuna (8 on the EarthQuake Archives version)
42 - Dusky Sound
69 - Canterbury (13 on EQA)
70 - Cook Strait (12 on EQA)
I sometimes wonder if I go too overboard with these pages/maps?
None of those have anywhere near the readership of this one on EQA, which has only one map and one graph.
135 - Ölüdeniz Açiklari-Muğla, Turkey 6.0 Aftershocks. Must have been local interest, there was nothing really outstanding about the quake itself, could have been the page name?, Turks searching specifically for those words ........
even L’Aquila, Italy 06/04/2009, 6.3Mw and aftershocks page which is the most comprehensive page I have done yet, only has had 17 views
Maybe less is best?
Damn it I want to know for myself, thats why I bother doing them, one day someone will see the value of it.
Still no Bath's Law aftershock one magnitude less # than the main shock, biggest so far was a M4.8 on 21st Jan.
Maybe there is more in that Pa Valley Fault yet? looking at all those 2766 icons, thats a darn lot of settling!
edit on 03000000666614 by muzzy
because: add another comment
reply to post by muzzy
You seem a little jaded that people do not read them. I thought I would input my view. I do not often go to those pages, but I certainly pay very close attention to your posts making conclusions from those pages.
Sort of like doing a 50 page report and 99% of people only read the 3 page executive summary, but, if I think the report is wrong I would read the whole thing. Your work is mostly flawless, so I am always happy and delighted with the executive summary.
Your work is brilliant and I admire your dedication Muzzy.
P
I sometimes wonder if I go too overboard with these pages/maps? None of those have anywhere near the readership of this one on EQA, which has only one map and one graph.
You seem a little jaded that people do not read them. I thought I would input my view. I do not often go to those pages, but I certainly pay very close attention to your posts making conclusions from those pages.
Sort of like doing a 50 page report and 99% of people only read the 3 page executive summary, but, if I think the report is wrong I would read the whole thing. Your work is mostly flawless, so I am always happy and delighted with the executive summary.
Your work is brilliant and I admire your dedication Muzzy.
P
Thanks pheonix.
I only do those maps because you can't find them anywhere else.
If I was living on a farm on Pa Valley Rd for example (Eketahuna quake) I suppose I would check in every day to see where the aftershocks were at, otherwise its probably just curiosity that brings the readers.
I only do those maps because you can't find them anywhere else.
If I was living on a farm on Pa Valley Rd for example (Eketahuna quake) I suppose I would check in every day to see where the aftershocks were at, otherwise its probably just curiosity that brings the readers.
6.3 goin down in mexico...
6.3
P-waves are showing up fairly good from this one... at lots of stations... kinda a weird spot though.. guess well see what happens
6.3
edit on 01/04/2009 by steve95988 because: (no reason
given)
P-waves are showing up fairly good from this one... at lots of stations... kinda a weird spot though.. guess well see what happens
edit on
01/04/2009 by steve95988 because: (no reason given)
reply to post by steve95988
5.8mwb manually revised
weird spot in what way???
Mex January map show its quite an active area, other monthly maps for the area show the same
goo.gl...
5.8mwb manually revised
weird spot in what way???
Mex January map show its quite an active area, other monthly maps for the area show the same
goo.gl...
hmm, some kind of quake just hit on or near the west coast USA... details in a minute...
TrueAmerican
hmm, some kind of quake just hit on or near the west coast USA... details in a minute...
About 10.20 here Crescent City, shook our house real good. Guess there is no Tsunami watch for this one.
Ok wait a minute - are these 3 different 6.ers now or are they just changing their mags. The tsunami warming page had it listed as two but USGS has it
as one and another just came through.
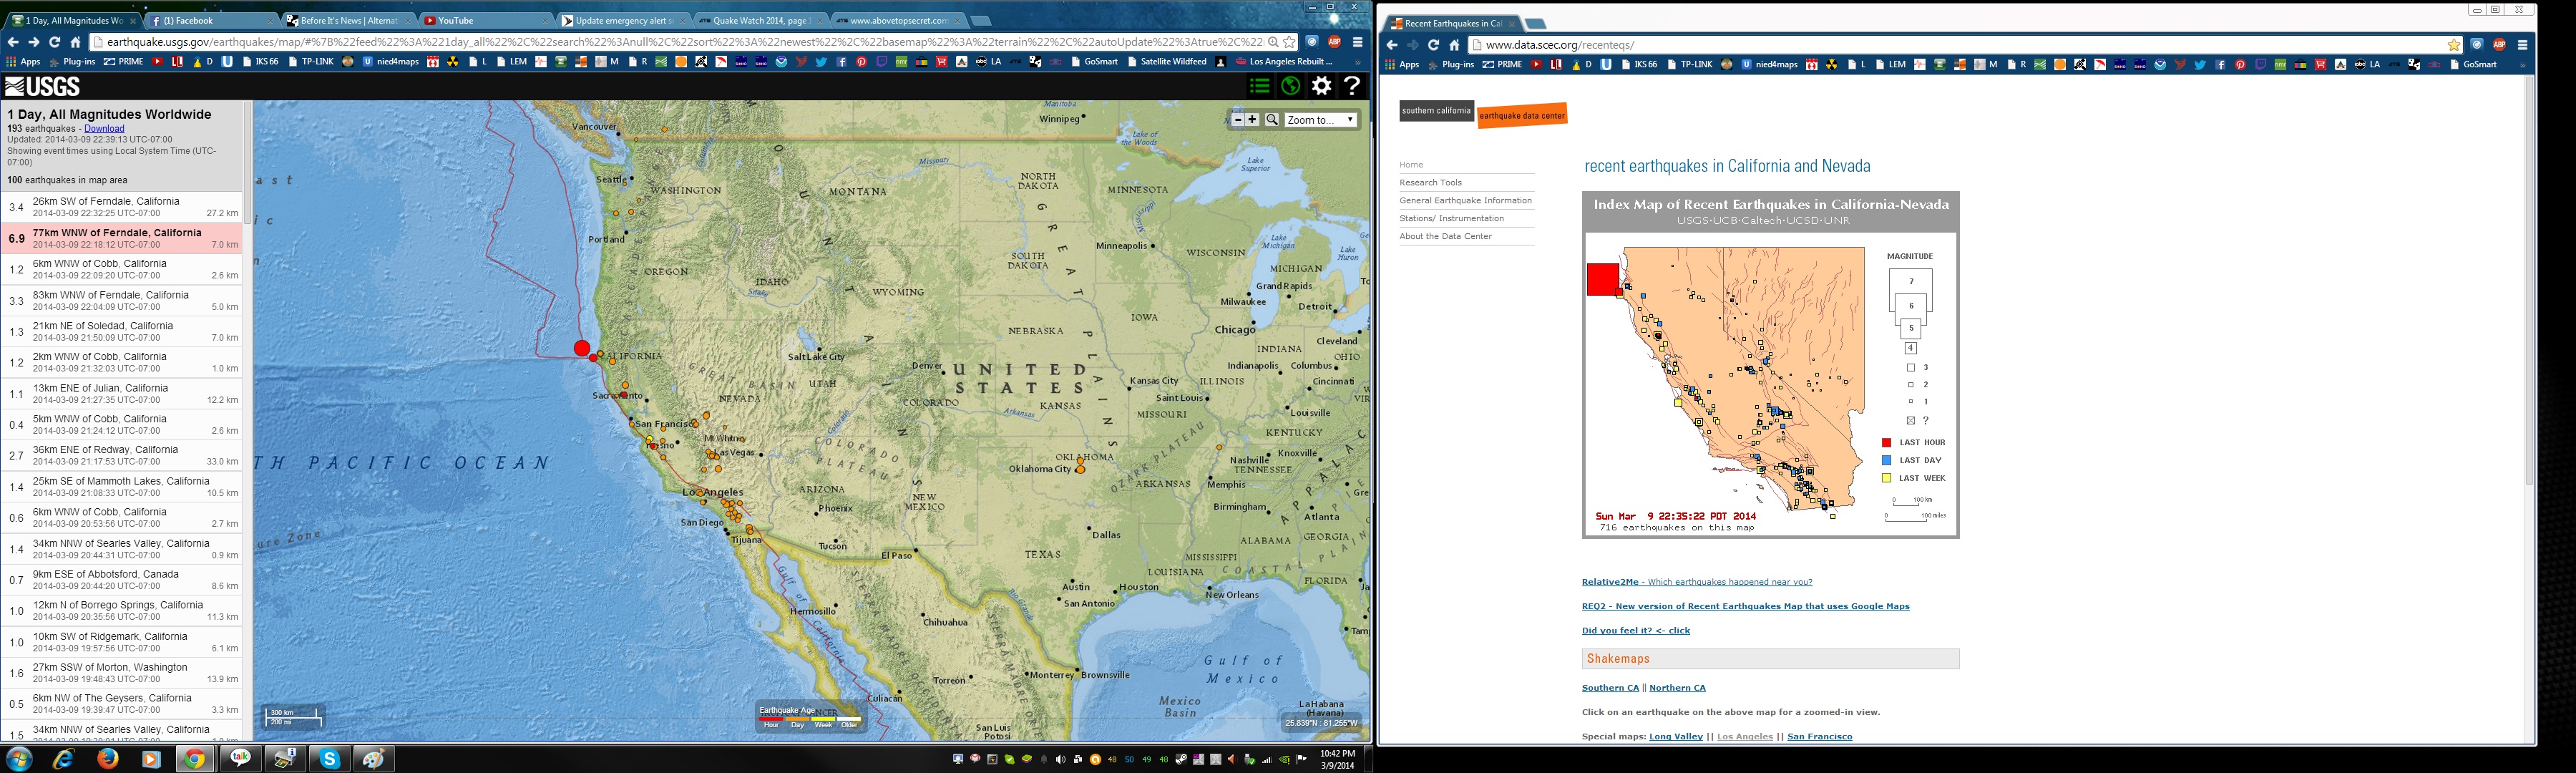
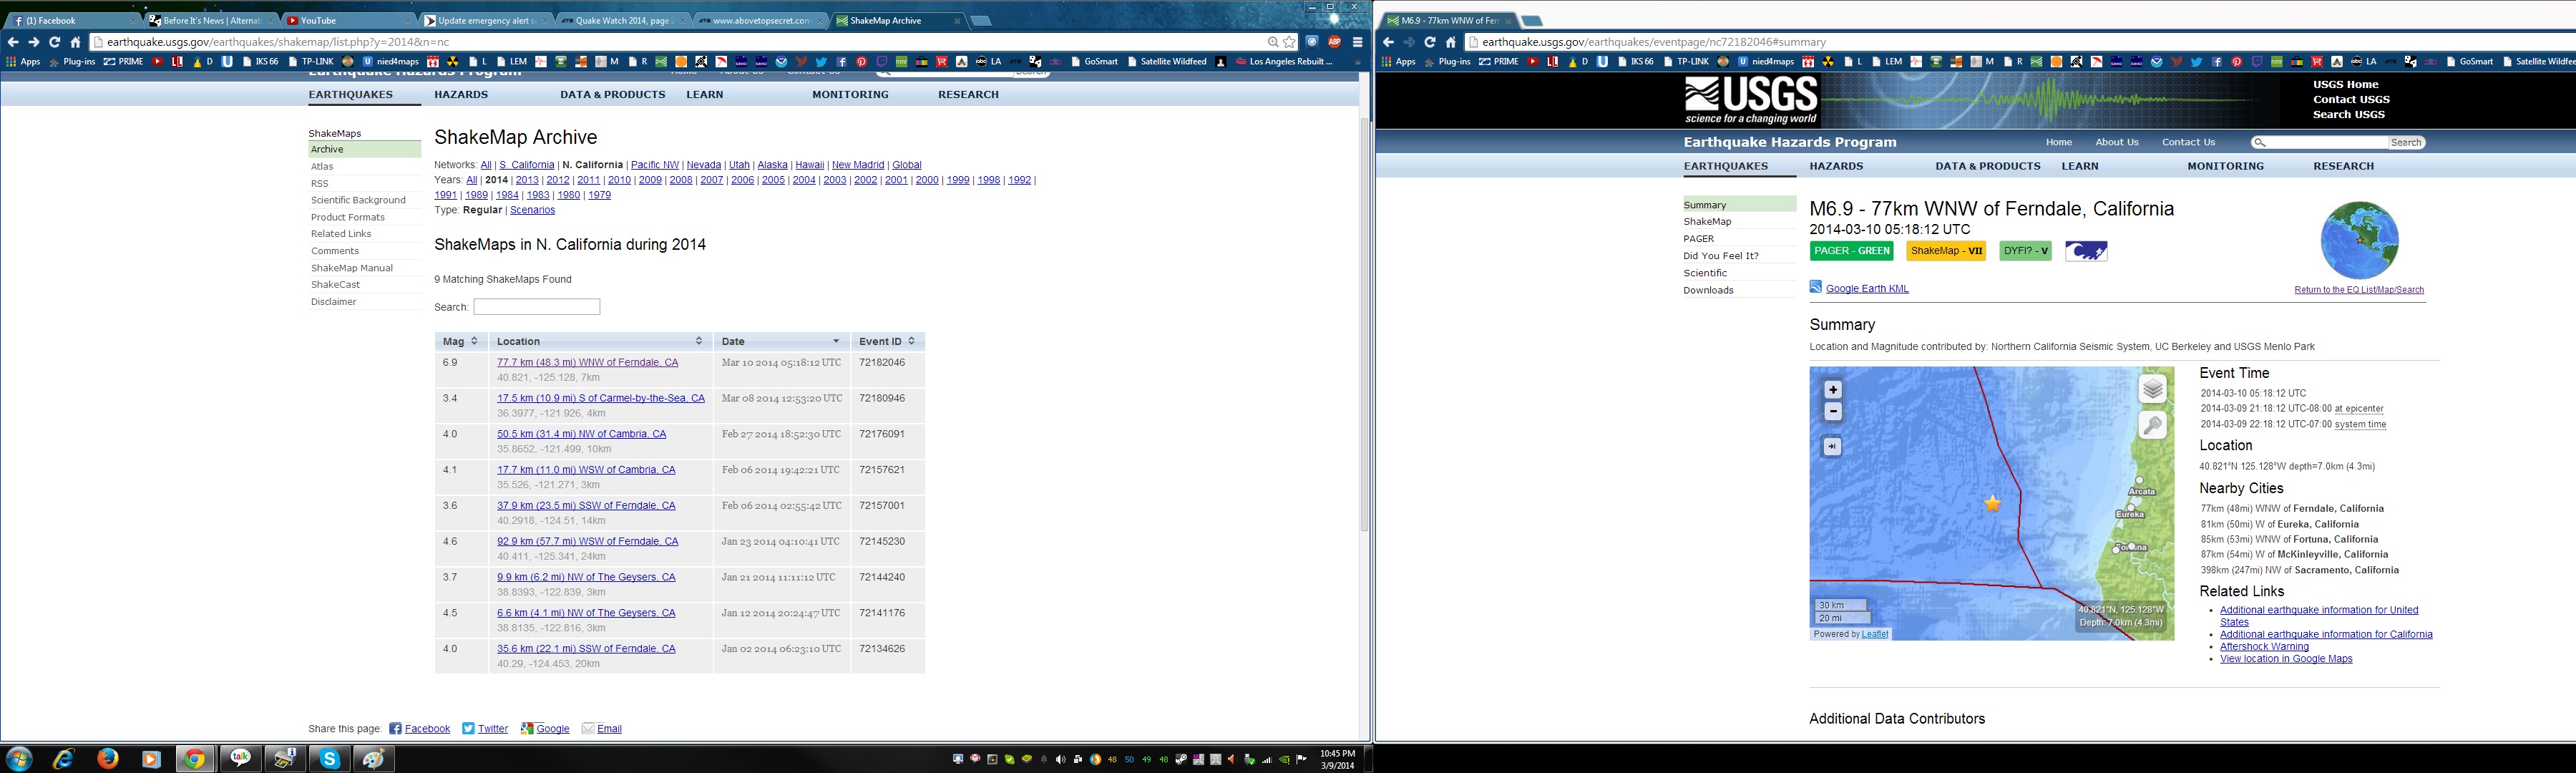
earthquake.usgs.gov...
M6.9
- 77km WNW of Ferndale, California
2014-03-10 05:18:12 UTC
Event Time
2014-03-10 05:18:12 UTC
2014-03-09 21:18:12 UTC-08:00 at epicenter
2014-03-09 22:18:12 UTC-07:00 system time
Location
40.821°N 125.128°W depth=7.0km (4.3mi)
Nearby Cities
77km (48mi) WNW of Ferndale, California
81km (50mi) W of Eureka, California
85km (53mi) WNW of Fortuna, California
87km (54mi) W of McKinleyville, California
398km (247mi) NW of Sacramento, California
files.abovetopsecret.com...
M6.9 info incoming
earthquake.usgs.gov...
files.abovetopsecret.com...
files.abovetopsecret.com...
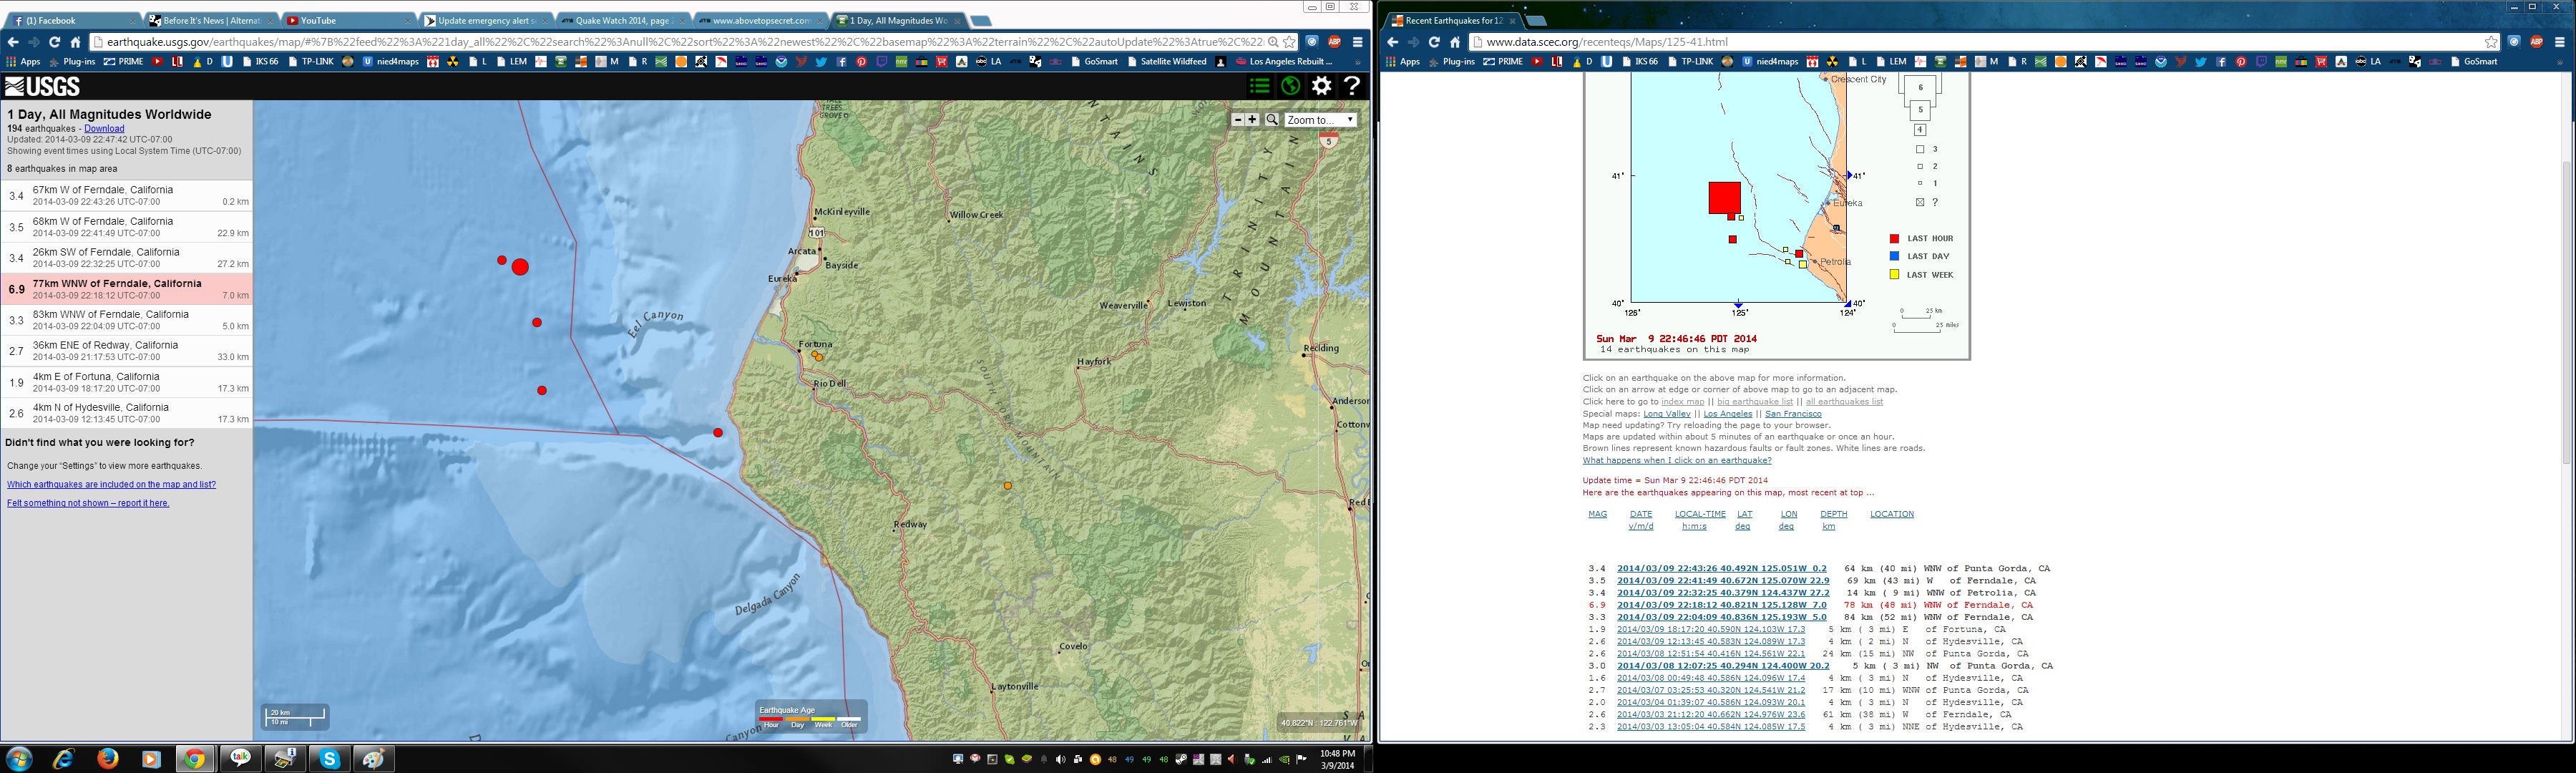
www.data.scec.org...
4.6 2014/03/09 22:51:11 40.599N 125.165W 2.5 76 km (47 mi) W of Ferndale, CA
3.4 2014/03/09 22:43:26 40.492N 125.051W 0.2 64 km (40 mi) WNW of Punta Gorda, CA
3.5 2014/03/09 22:41:49 40.672N 125.070W 22.9 69 km (43 mi) W of Ferndale, CA
3.4 2014/03/09 22:32:25 40.379N 124.437W 27.2 14 km ( 9 mi) WNW of Petrolia, CA
6.9 2014/03/09 22:18:12 40.821N 125.128W 7.0 78 km (48 mi) WNW of Ferndale, CA
3.3 2014/03/09 22:04:09 40.836N 125.193W 5.0 84 km (52 mi) WNW of Ferndale, CA
earthquake.usgs.gov...
files.abovetopsecret.com...
files.abovetopsecret.com...
www.data.scec.org...
4.6 2014/03/09 22:51:11 40.599N 125.165W 2.5 76 km (47 mi) W of Ferndale, CA
3.4 2014/03/09 22:43:26 40.492N 125.051W 0.2 64 km (40 mi) WNW of Punta Gorda, CA
3.5 2014/03/09 22:41:49 40.672N 125.070W 22.9 69 km (43 mi) W of Ferndale, CA
3.4 2014/03/09 22:32:25 40.379N 124.437W 27.2 14 km ( 9 mi) WNW of Petrolia, CA
6.9 2014/03/09 22:18:12 40.821N 125.128W 7.0 78 km (48 mi) WNW of Ferndale, CA
3.3 2014/03/09 22:04:09 40.836N 125.193W 5.0 84 km (52 mi) WNW of Ferndale, CA
edit on 7/30/2012 by dreamfox1 because: (no reason
given)
edit on 7/30/2012 by dreamfox1 because: (no reason given)
Can someone explain why they have it listed as a 7 on the tsunami tab and then also list a 7 in Hawaii? Maybe this is what it is out at sea and comes
in at a lesser magnitude inland?
www.tsunami.gov...
www.tsunami.gov...
new topics
-
Maestro Benedetto
Literature: 8 minutes ago -
Is AI Better Than the Hollywood Elite?
Movies: 16 minutes ago -
Las Vegas UFO Spotting Teen Traumatized by Demon Creature in Backyard
Aliens and UFOs: 3 hours ago -
2024 Pigeon Forge Rod Run - On the Strip (Video made for you)
Automotive Discussion: 4 hours ago -
Gaza Terrorists Attack US Humanitarian Pier During Construction
Middle East Issues: 4 hours ago -
The functionality of boldening and italics is clunky and no post char limit warning?
ATS Freshman's Forum: 6 hours ago -
Meadows, Giuliani Among 11 Indicted in Arizona in Latest 2020 Election Subversion Case
Mainstream News: 6 hours ago -
Massachusetts Drag Queen Leads Young Kids in Free Palestine Chant
Social Issues and Civil Unrest: 6 hours ago -
Weinstein's conviction overturned
Mainstream News: 8 hours ago -
Supreme Court Oral Arguments 4.25.2024 - Are PRESIDENTS IMMUNE From Later Being Prosecuted.
Above Politics: 9 hours ago
top topics
-
Krystalnacht on today's most elite Universities?
Social Issues and Civil Unrest: 9 hours ago, 9 flags -
Supreme Court Oral Arguments 4.25.2024 - Are PRESIDENTS IMMUNE From Later Being Prosecuted.
Above Politics: 9 hours ago, 8 flags -
Weinstein's conviction overturned
Mainstream News: 8 hours ago, 7 flags -
University of Texas Instantly Shuts Down Anti Israel Protests
Education and Media: 12 hours ago, 6 flags -
Massachusetts Drag Queen Leads Young Kids in Free Palestine Chant
Social Issues and Civil Unrest: 6 hours ago, 6 flags -
Gaza Terrorists Attack US Humanitarian Pier During Construction
Middle East Issues: 4 hours ago, 6 flags -
Meadows, Giuliani Among 11 Indicted in Arizona in Latest 2020 Election Subversion Case
Mainstream News: 6 hours ago, 5 flags -
Las Vegas UFO Spotting Teen Traumatized by Demon Creature in Backyard
Aliens and UFOs: 3 hours ago, 3 flags -
2024 Pigeon Forge Rod Run - On the Strip (Video made for you)
Automotive Discussion: 4 hours ago, 2 flags -
Any one suspicious of fever promotions events, major investor Goldman Sachs card only.
The Gray Area: 14 hours ago, 2 flags
active topics
-
University of Texas Instantly Shuts Down Anti Israel Protests
Education and Media • 210 • : DBCowboy -
Is AI Better Than the Hollywood Elite?
Movies • 1 • : 5thHead -
British TV Presenter Refuses To Use Guest's Preferred Pronouns
Education and Media • 164 • : Annee -
VP's Secret Service agent brawls with other agents at Andrews
Mainstream News • 56 • : CarlLaFong -
Maestro Benedetto
Literature • 0 • : BrotherKinsMan -
Massachusetts Drag Queen Leads Young Kids in Free Palestine Chant
Social Issues and Civil Unrest • 11 • : marg6043 -
Electrical tricks for saving money
Education and Media • 7 • : chr0naut -
Definitive 9.11 Pentagon EVIDENCE.
9/11 Conspiracies • 424 • : Zanti Misfit -
Las Vegas UFO Spotting Teen Traumatized by Demon Creature in Backyard
Aliens and UFOs • 8 • : Macenroe82 -
SHORT STORY WRITERS CONTEST -- April 2024 -- TIME -- TIME2024
Short Stories • 23 • : DontTreadOnMe