It looks like you're using an Ad Blocker.
Please white-list or disable AboveTopSecret.com in your ad-blocking tool.
Thank you.
Some features of ATS will be disabled while you continue to use an ad-blocker.

Quake Watch 2014
page: 18share:
reply to post by dreamfox1
4 x >5. earthquakes in the space of 3 hours.
wonder how high it will go ????
4 x >5. earthquakes in the space of 3 hours.
wonder how high it will go ????
reply to post by muzzy
No responses?,
So I take that as no one is against the idea then!??
So I'll do it.
High event count (106)but low TTNT energy release (8.625TTNT) again today for NZ,
high risk of another 5+ within the next 6 days
No responses?,
So I take that as no one is against the idea then!??
So I'll do it.
High event count (106)but low TTNT energy release (8.625TTNT) again today for NZ,
high risk of another 5+ within the next 6 days
reply to post by muzzy
nothing of any intelluctual value to add - just letting you know a lot of people pay attention to this thread - don't want to gum it up with stupid # - like I just did.
We appreciate all the work you do and we watch....
nothing of any intelluctual value to add - just letting you know a lot of people pay attention to this thread - don't want to gum it up with stupid # - like I just did.
We appreciate all the work you do and we watch....
Dorothy might not want to go home to Kansas.
Because, in the simplest terms, injecting fracking water is dumping. Dorothy's Kansas is turning into a dump. Or better yet, because injection has to do with water, a toilet. A toxic dumping ground. It really sounds like a bad sci-fi movie from the 1980's. I believe chemical dumping resulted in "Humanoids from the Deep."
Really, there's nothing new here other than the quakes are on the Kansas side of the border, and the quakes are not in Oklahoma.
www.kake.com...
There have been a few more little ones around Oklahoma but not listed.
edit on 4-2-2014 by ericblair4891 because: (no reason given)
Hi and happy 2014!
I am pretty sure I felt an earthquake today but can't find any record of it ... anywhere. Almaty, Kazakhstan 12.33 pm local time. I was in my classroom (I'm a teacher) when I felt a shake that lasted around 5 seconds or so. The speakers hanging off the side of my whiteboard where shaking quite heavily, that's what made me convinced it was an earthquake.
But none of my colleagues has felt it and again, nothing on the usual websites.
Call me crazy or whatever, normally I don't believe in stuff like this, but since yesterday, I have a really bad feeling in my guts about an
earthquake in Tokyo or Osaka, maybe Teheran.
I am not sure why, I just feel like something like this will happen.
Like I said normally I don't believe in feelings like this, but somehow this is constantly there since yesterday.
I hope I will be wrong and I am 99% sure I will be wrong.
I am not sure why, I just feel like something like this will happen.
Like I said normally I don't believe in feelings like this, but somehow this is constantly there since yesterday.
I hope I will be wrong and I am 99% sure I will be wrong.
Hm, another one heard from the Cuban peanut gallery...
M4.3 - 26km NNE of Marti, Cuba 2014-02-05 03:19:31 UTC
Not sure what to make of that, to be honest. My eyebrow wants to go up to the stratosphere, but my common sense side wants to tie it to the PR Trech quake's influence on the plate.
Real quick edit: Before anyone quips, "That's quite a distance from the Trench, Nyiah", yes, I know. I'd imagine, however, that that big of a quake would get things moving and/or jostled along it for quite a ways, even that far NW & after time. Sort of a shuffling & resettling along the plate.
Edit 2: Or duh, it's probably related to the previous Cuban quake. SMH, I need to just go back to bed. Too little sleep and way too early for me to try to think productively yet.
M4.3 - 26km NNE of Marti, Cuba 2014-02-05 03:19:31 UTC
Location
23.168°N 80.821°W depth=12.6km (7.8mi)
Nearby Cities
26km (16mi) NNE of Marti, Cuba
31km (19mi) NW of Corralillo, Cuba
41km (25mi) ENE of Cardenas, Cuba
44km (27mi) E of Varadero, Cuba
159km (99mi) E of Havana, Cuba
Not sure what to make of that, to be honest. My eyebrow wants to go up to the stratosphere, but my common sense side wants to tie it to the PR Trech quake's influence on the plate.
Real quick edit: Before anyone quips, "That's quite a distance from the Trench, Nyiah", yes, I know. I'd imagine, however, that that big of a quake would get things moving and/or jostled along it for quite a ways, even that far NW & after time. Sort of a shuffling & resettling along the plate.
edit on 2/5/2014 by Nyiah because: (no reason given)
Edit 2: Or duh, it's probably related to the previous Cuban quake. SMH, I need to just go back to bed. Too little sleep and way too early for me to try to think productively yet.
edit on 2/5/2014 by Nyiah because: (no reason given)
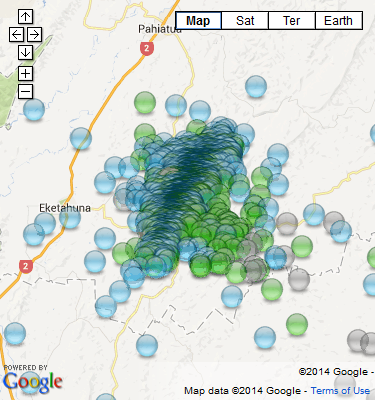
14 day aftershock update for Eketahuna 6.3Mw of 20/01/2014
summary
mag1= 1153 ,
mag2= 494 ,
mag3= 62
mag4= 2 ,
mag5= 0 ,
mag6= 1
total= 1712
total energy released= 28,514.098 TTNT
42 maps
4 graphs
(click image for interactive maps,
opens in new tab/window)(be patient!)
(click image for larger version, opens in new tab/window)
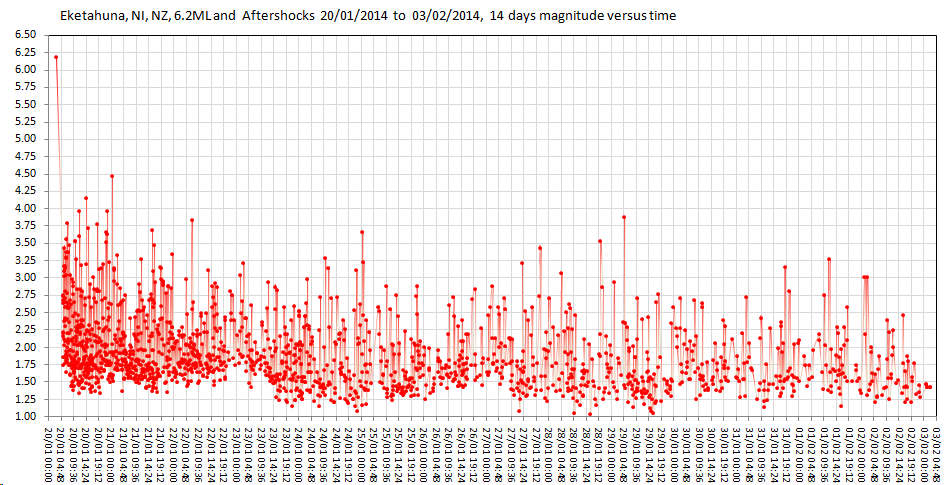
I hope Xcel added those figures up correctly, I lost the plot at 4 days, after the 28th Jan data download malfunctioned and I had to get it directly off Geonet.
Still no M5 (one magnitude less than mainshock (Baths Law))
back to Kefalonia!
An interesting read on frost quakes:
news.msn.com...
Source: MSN News
WOQ
news.msn.com...
Source: MSN News
WOQ
edit on 5-2-2014 by wasobservingquietly because: (no reason given)
If I'm looking a GEE correctly, it looks like a fair- sized quake just hit near the central California coast.
Waiting on SCEC/USGS....
Meh, Mag4.3 4.2 San Simeon, CA. A bit of
oblique-thrust slip, but nothing to get excited about.
Waiting on SCEC/USGS....
Meh, Mag
edit on 2/6/2014 by Olivine because: update
edit on 2/6/2014 by Olivine because: downgraded...shocking!
Olivine
If I'm looking a GEE correctly, it looks like a fair- sized quake just hit near the central California coast.
Waiting on SCEC/USGS....
Meh, Mag4.34.2 San Simeon, CA. A bit of oblique-thrust slip, but nothing to get excited about.
edit on 2/6/2014 by Olivine because: update
edit on 2/6/2014 by Olivine because: downgraded...shocking!
Quite a few 3's and 4's in that junction area in the last couple of months!!
Just sayin'!
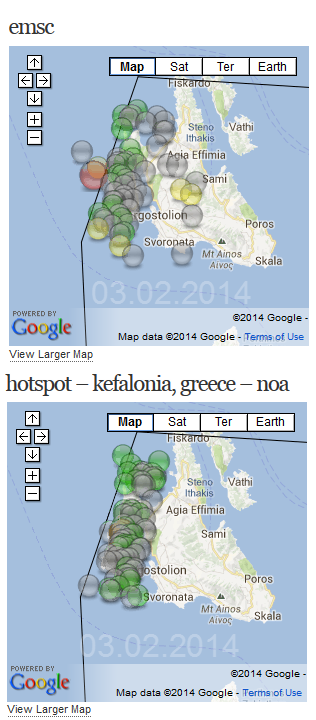
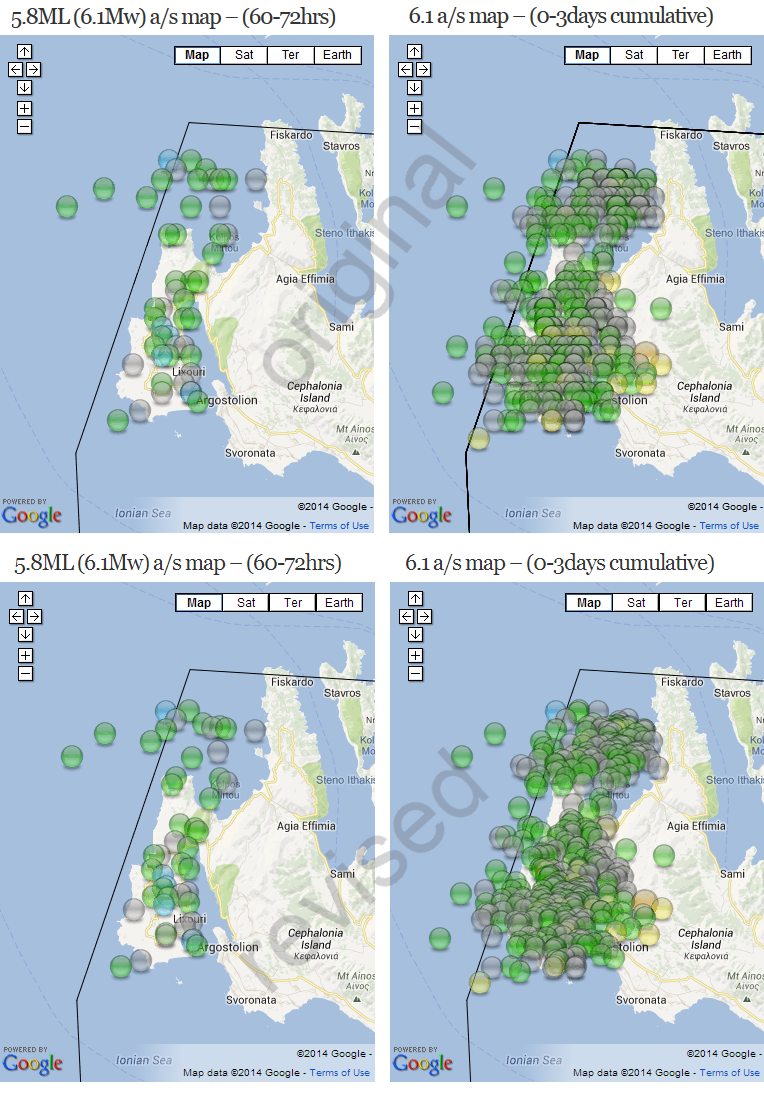
Kelafonia, Greece, 6.1Mw, 26/01/2014 and
aftershocks page has been revised, but not with new events.
The original data came off NOA Recent Quakes page, which only has 2 decimal points for the Lat/Long co-ordinates, and has no named locations.
The NOA Revised Monthly Lists page gives 4 decimal points and the names such as x km from y etc
The comparison is shown below. The difference is subtle, until you see 372 markers together. The original events are laid out in a grid like fashion. This doesn't usually show up until you have hundreds of markers in a confined area, but it is one reason I have never used EMSC much, they also run on 2 decimal points.
I guess to most people it doesn't really matter, it was 12 days ago after all since the first quake, a 2nd M6 has occurred with another 236 aftershocks from that one to get your head around.
However for us "Archivists" accuracy is important!, when the 2nd M6 comes on the maps the aftershocks of that will have both the elapsed time from the 1st M6 and also the elapsed time from the 2nd M6, something I also did for the Cook Strait series in July/Aug 2013.
All this helps when comparing series to series.
click on the image for one a wee bit bigger

edit on 02u363614 by muzzy because: never seemed to have this trouble when I was at school, writing with a pen rather than a keyboard seemed
easier
reply to post by wasobservingquietly
Yeah interesting. Wonder what the TTNT energy released number was, a few grams???
Reminds me of the Ice Quakes in Antarctica, there was apparently some of M7 size at one time, can't remember the link sorry.
McMurdo/Scott Base IRIS recorder records heaps of trace signals, but its hard to tell if they are from Ice Quakes or Mt. Erebus volcano (SB alternative siesmo here)
Mag 6.5 Vanuatu EMSC
Location in Google Maps
Derived from Event Data Source: USGS
Powered by QVSData
GFZ Potsdam 6.3 Automatic not confirmed
Magnitude 6.5 - Vanuatu Islands (186) [T]
Location in Google Maps
- Date-Time: Friday, February 07, 2014 @ 08:40:12 UTC
- Earthquake location: 15.057°S, 167.302°E,
- Earthquake depth: 111.2 km
- Distances:
27km (16mi) E of Port-Olry, Vanuatu
54km (33mi) NNE of Luganville, Vanuatu
315km (195mi) NNW of Port-Vila, Vanuatu
648km (402mi) N of We, New Caledonia
789km (490mi) N of Paita, New Caledonia
- Event ID: usc000mjye
Derived from Event Data Source: USGS
Powered by QVSData
GFZ Potsdam 6.3 Automatic not confirmed
edit on 7/2/2014 by PuterMan because: (no reason given)
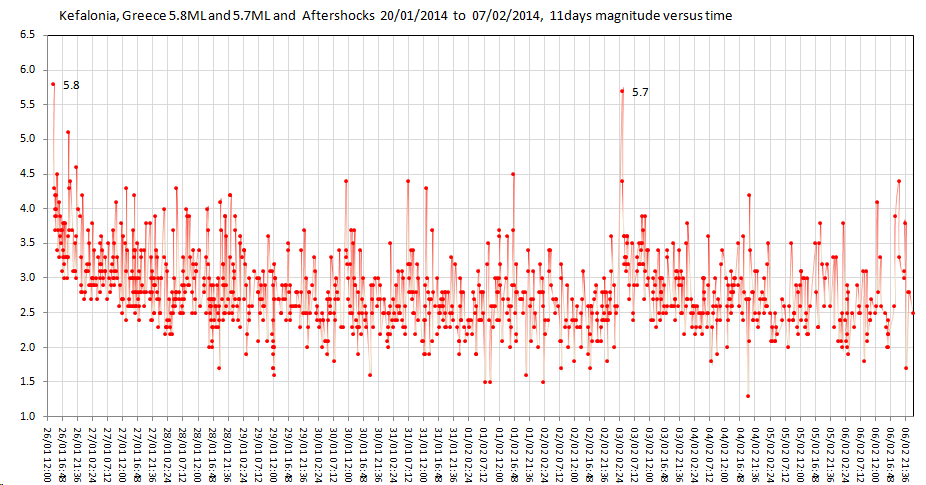
Kelafonia, Greece, 6.1Mw, 26/01/14 and 6.0Mw,
03/02/14, and aftershocks update to 11 days after the first M6Mw.
Heaps of maps and graphs.
Interesting to compare the 0-12 period after each M6Mw, not much in the 0.1 of a Mw difference , first one had 65 aftershocks, 2nd one had 51, but they are still widespread with most of the 2nd lot on the peninsula of Paliki.
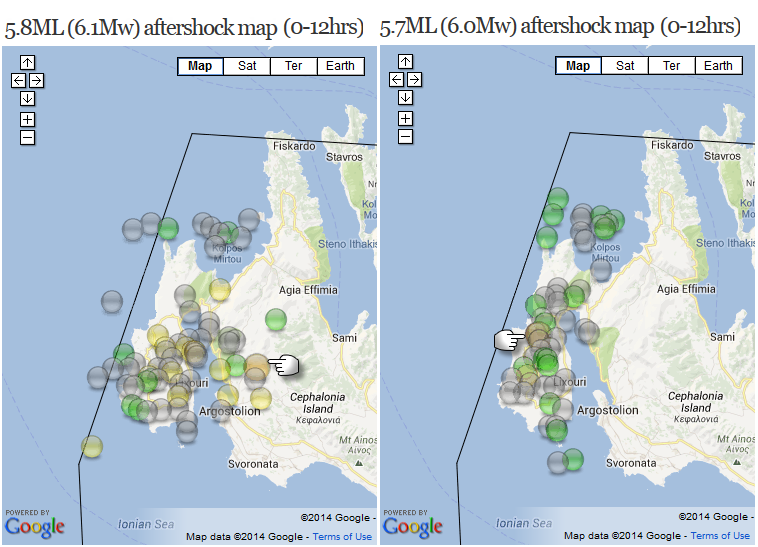
heres the 11 day graph for those that can't be bothered scrolling to the bottom of the page for it.
Never been there, but was in Corfu further north back in the 1980's, guess there will be quite a bit of rubble around.
EMSC have some pics here
Heaps of maps and graphs.
Interesting to compare the 0-12 period after each M6Mw, not much in the 0.1 of a Mw difference , first one had 65 aftershocks, 2nd one had 51, but they are still widespread with most of the 2nd lot on the peninsula of Paliki.
heres the 11 day graph for those that can't be bothered scrolling to the bottom of the page for it.
Never been there, but was in Corfu further north back in the 1980's, guess there will be quite a bit of rubble around.
EMSC have some pics here
I need some help. Can someone set me straight on reading BSM (borehole strainmeter) data? Please!
I've been looking at PBO data for over a year, and this has me puzzled because of the large "units" involved.
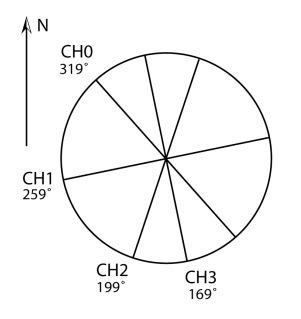
The BSM in question is B934, in Leggett, CA. You can see its location and channel orientations in this 2-page .pdf.
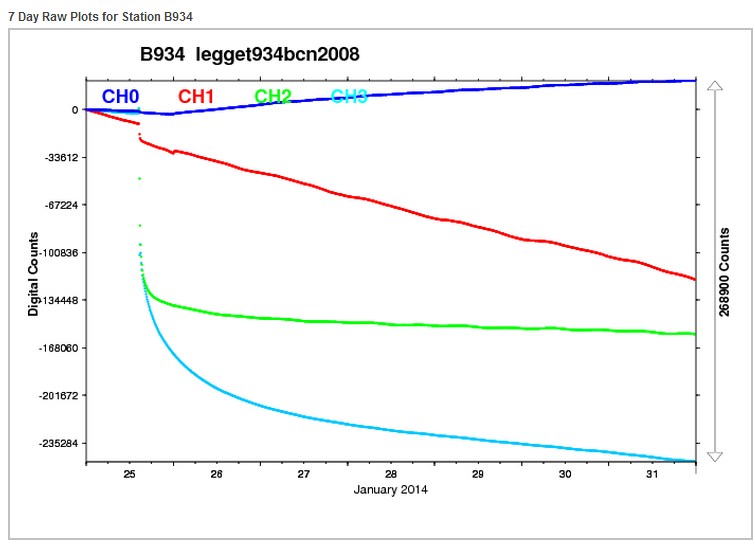
Here are 2 images I grabbed from a few days ago (yes, I'm too lazy to update them, lol), showing a large increase in compression on channels 2 & 3. The 1st shows 7 days, the 2nd, the past 30.:
(upward/postitive slopes are extensional, downward/negative slopes show compression)
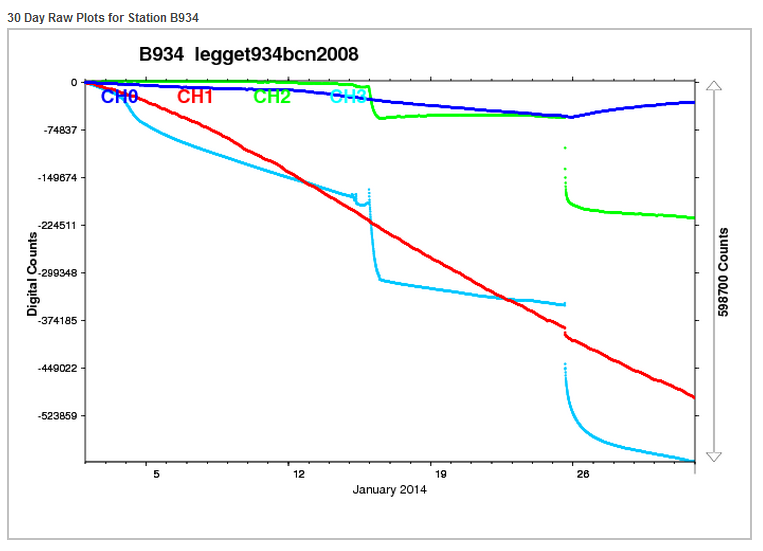
If you click the B934 link above, and scroll down to the "all data" (since installation) you see a total of 5,245,000 counts.
The last 30 days show 513,900 counts.
So, almost 10% of the total compressive strain has accumulated in only the last month, out of a total of 64 months since installation. That seems significant to me.
Unfortunately, only 1 other of the regional BSM's has data available, meter B045, and it doesn't show the same increase; probably because it is located North and East of the Mendocino Triple Junction, whereas B934 is South and East---different stress regimes.
The 2 days that show the large increases, 15 January & 26 January do not coincide with any large, moderate, or even small quakes of interest in the area. Borehole strainmeters are sensitive to pore pressures and barometric pressures, but the closest rainfall was on the 11th/12th & and 28th/29th, as shown here.
This is getting long-winded, but one more page to share.
If you look at the processed data for the past 30-days, the strain scale used is nearly 10 microstrain.
Strain is dimensionless, but is talked about as if it had "units". Most strainmeters can pickup sensitivities of 0.1 nanostrain (equal to 1 part per 10 billion---pretty sensitive).
Evelyn Roeloffs, USGS, states that, "10 microstrain is a ballpark value for the coseismic strain within 5 km of a M7 earthquake". source, page 9
Um, that's big, especially for this location.
So......was this large increase in compression from the S-SSW direction from asesimic slip? It looks to have occurred over several hours in each instance.
An instrument malfunction?
Or am I completely misreading this data--which is entirely possible.
Set me straight people.
I've been looking at PBO data for over a year, and this has me puzzled because of the large "units" involved.
The BSM in question is B934, in Leggett, CA. You can see its location and channel orientations in this 2-page .pdf.
Here are 2 images I grabbed from a few days ago (yes, I'm too lazy to update them, lol), showing a large increase in compression on channels 2 & 3. The 1st shows 7 days, the 2nd, the past 30.:
(upward/postitive slopes are extensional, downward/negative slopes show compression)
If you click the B934 link above, and scroll down to the "all data" (since installation) you see a total of 5,245,000 counts.
The last 30 days show 513,900 counts.
So, almost 10% of the total compressive strain has accumulated in only the last month, out of a total of 64 months since installation. That seems significant to me.
Unfortunately, only 1 other of the regional BSM's has data available, meter B045, and it doesn't show the same increase; probably because it is located North and East of the Mendocino Triple Junction, whereas B934 is South and East---different stress regimes.
The 2 days that show the large increases, 15 January & 26 January do not coincide with any large, moderate, or even small quakes of interest in the area. Borehole strainmeters are sensitive to pore pressures and barometric pressures, but the closest rainfall was on the 11th/12th & and 28th/29th, as shown here.
This is getting long-winded, but one more page to share.
If you look at the processed data for the past 30-days, the strain scale used is nearly 10 microstrain.
Strain is dimensionless, but is talked about as if it had "units". Most strainmeters can pickup sensitivities of 0.1 nanostrain (equal to 1 part per 10 billion---pretty sensitive).
Evelyn Roeloffs, USGS, states that, "10 microstrain is a ballpark value for the coseismic strain within 5 km of a M7 earthquake". source, page 9
Um, that's big, especially for this location.
So......was this large increase in compression from the S-SSW direction from asesimic slip? It looks to have occurred over several hours in each instance.
An instrument malfunction?
Or am I completely misreading this data--which is entirely possible.
Set me straight people.
reply to post by Olivine
Oli, I think you might have linked to the raw data. The processed data shows not such a big variance after removal of trend, tide, and barometric (look at the red lines for those). Might have to click on the actual processed data tab- edit- yup, the link takes you to the raw data tab, so you must click on the processed data tab manually...
Oli, I think you might have linked to the raw data. The processed data shows not such a big variance after removal of trend, tide, and barometric (look at the red lines for those). Might have to click on the actual processed data tab- edit- yup, the link takes you to the raw data tab, so you must click on the processed data tab manually...
edit on Sat Feb 8th 2014 by TrueAmerican
because: (no reason given)
reply to post by TrueAmerican
Thanks for looking.
Your right, the images I posted are showing the raw data, in counts, without tides removed, detrending, etc.
But lower down my long post I referenced the processed data. Here is an image of the processed data for channels 2 & 3 over the past 30 days. Notice the scale-- 9.795 microstrain--that's a large value.
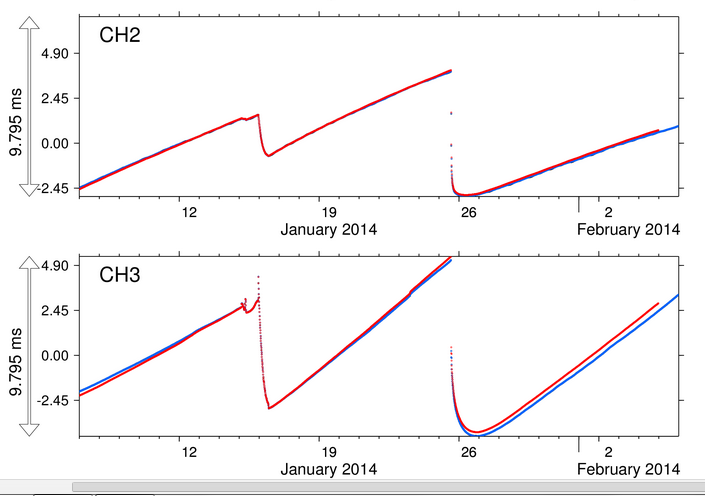
For comparison, check out the scale of the processed 30 day data at B022 (Seaside, OR--picked at random). The scale is 0.355 microstrain, over 27 times smaller in scale.
In the big scheme of things, it's probably not significant.
Thanks for looking.
Your right, the images I posted are showing the raw data, in counts, without tides removed, detrending, etc.
But lower down my long post I referenced the processed data. Here is an image of the processed data for channels 2 & 3 over the past 30 days. Notice the scale-- 9.795 microstrain--that's a large value.
For comparison, check out the scale of the processed 30 day data at B022 (Seaside, OR--picked at random). The scale is 0.355 microstrain, over 27 times smaller in scale.
In the big scheme of things, it's probably not significant.
edit on 2/8/2014 by Olivine because: forgot a word
reply to post by Olivine
Oli, if you have a hunch about increased strain, either dilational or compressional, that you feel warrants attention or is out of the ordinary, then why don't you email someone at the USGS and ask? There is no one here that I know of that is going to be an expert at deciphering strain meters. It could be important- and as you know, they easily could have missed it. I really feel you should.
Oli, if you have a hunch about increased strain, either dilational or compressional, that you feel warrants attention or is out of the ordinary, then why don't you email someone at the USGS and ask? There is no one here that I know of that is going to be an expert at deciphering strain meters. It could be important- and as you know, they easily could have missed it. I really feel you should.
new topics
-
Las Vegas UFO Spotting Teen Traumatized by Demon Creature in Backyard
Aliens and UFOs: 2 hours ago -
2024 Pigeon Forge Rod Run - On the Strip (Video made for you)
Automotive Discussion: 3 hours ago -
Gaza Terrorists Attack US Humanitarian Pier During Construction
Middle East Issues: 3 hours ago -
The functionality of boldening and italics is clunky and no post char limit warning?
ATS Freshman's Forum: 4 hours ago -
Meadows, Giuliani Among 11 Indicted in Arizona in Latest 2020 Election Subversion Case
Mainstream News: 5 hours ago -
Massachusetts Drag Queen Leads Young Kids in Free Palestine Chant
Social Issues and Civil Unrest: 5 hours ago -
Weinstein's conviction overturned
Mainstream News: 6 hours ago -
Supreme Court Oral Arguments 4.25.2024 - Are PRESIDENTS IMMUNE From Later Being Prosecuted.
Above Politics: 8 hours ago -
Krystalnacht on today's most elite Universities?
Social Issues and Civil Unrest: 8 hours ago -
Chris Christie Wishes Death Upon Trump and Ramaswamy
Politicians & People: 9 hours ago
top topics
-
Krystalnacht on today's most elite Universities?
Social Issues and Civil Unrest: 8 hours ago, 9 flags -
Supreme Court Oral Arguments 4.25.2024 - Are PRESIDENTS IMMUNE From Later Being Prosecuted.
Above Politics: 8 hours ago, 8 flags -
Weinstein's conviction overturned
Mainstream News: 6 hours ago, 7 flags -
University of Texas Instantly Shuts Down Anti Israel Protests
Education and Media: 11 hours ago, 6 flags -
Meadows, Giuliani Among 11 Indicted in Arizona in Latest 2020 Election Subversion Case
Mainstream News: 5 hours ago, 5 flags -
Gaza Terrorists Attack US Humanitarian Pier During Construction
Middle East Issues: 3 hours ago, 4 flags -
Massachusetts Drag Queen Leads Young Kids in Free Palestine Chant
Social Issues and Civil Unrest: 5 hours ago, 4 flags -
Las Vegas UFO Spotting Teen Traumatized by Demon Creature in Backyard
Aliens and UFOs: 2 hours ago, 2 flags -
Chris Christie Wishes Death Upon Trump and Ramaswamy
Politicians & People: 9 hours ago, 2 flags -
Any one suspicious of fever promotions events, major investor Goldman Sachs card only.
The Gray Area: 13 hours ago, 2 flags
active topics
-
Meadows, Giuliani Among 11 Indicted in Arizona in Latest 2020 Election Subversion Case
Mainstream News • 10 • : chr0naut -
Supreme Court Oral Arguments 4.25.2024 - Are PRESIDENTS IMMUNE From Later Being Prosecuted.
Above Politics • 75 • : Vermilion -
University student disciplined after saying veganism is wrong and gender fluidity is stupid
Education and Media • 50 • : watchitburn -
VP's Secret Service agent brawls with other agents at Andrews
Mainstream News • 55 • : CarlLaFong -
Cats Used as Live Bait to Train Ferocious Pitbulls in Illegal NYC Dogfighting
Social Issues and Civil Unrest • 23 • : Ravenwatcher -
-@TH3WH17ERABB17- -Q- ---TIME TO SHOW THE WORLD--- -Part- --44--
Dissecting Disinformation • 680 • : 777Vader -
Is there a hole at the North Pole?
ATS Skunk Works • 40 • : Oldcarpy2 -
Fossils in Greece Suggest Human Ancestors Evolved in Europe, Not Africa
Origins and Creationism • 89 • : whereislogic -
University of Texas Instantly Shuts Down Anti Israel Protests
Education and Media • 197 • : NorthOS -
Candidate TRUMP Now Has Crazy Judge JUAN MERCHAN After Him - The Stormy Daniels Hush-Money Case.
Political Conspiracies • 790 • : Oldcarpy2