It looks like you're using an Ad Blocker.
Please white-list or disable AboveTopSecret.com in your ad-blocking tool.
Thank you.
Some features of ATS will be disabled while you continue to use an ad-blocker.

Volcano Watch 2014
page: 59share:
originally posted by: LadyTrick
The iceland uni tweeted that bardarbunga crater GPS has been moved/lifted due to it almost being covered in snowfall. So nobody panic (like I did) when you see the huge rise on the graph.
Now the caldera has subsided so much that the gps sensor is deep below caldera rim, which prevents the signal between sensor and relay station on Kverkfjöll. They obviously need satellite connection now, or longer antennas.
From Icelandic Met Office
Until recently, point measurements of the subsidence of the Bárðarbunga caldera were available in near real time as the IMO mounted a GPS station there, 12 September. This station has now subsided so much that it is out of sight of the neccessary relay station in Kverkfjöll and therefore no signal is received.
The subsidence of the Bárðarbunga caldera has also been observed by doing flights along a certain north-south section repeatedly. For convenience, the results are presented schematically, see below. The lower graph has a sixfold exaggeration of the vertical axis and on the upper one the difference in hight is multiplied by a factor of 120. The intention is not to make an image which resembles the volcano but to distinguish clearly and graphically between the results derived after each surveillance flight. Eight flight measurements are shown, from 5 September to 26 November 2014. The Institute of Earth Sciences makes these measurements and interprets the results. A comparison of the black line and the light blue one reveals that the subsidence has not only continued since September but also broadened, affecting a larger area.
Icelandic Met Office

Lower graph shows how much there is actually ice. The height in lower graph is exaggerated 6 times while upper has exaggeration of 120 times.
edit on 1-12-2014 by Thebel because: (no reason given)
Meanwhile at Cape Verde
The Fogo volcano returned to activity in 2014, having started erupting about 09:45 (local time) of Sunday, 23 November 2014.[4] There had been a few days of heightened seismic activity,[4] but they worsened beginning at 8 p.m. of Saturday night.
more info
news link (w/video footage) 1
portuguese news link (w/video footage) 2
resume of some events since the eruption in 23 November
The Fogo volcano returned to activity in 2014, having started erupting about 09:45 (local time) of Sunday, 23 November 2014.[4] There had been a few days of heightened seismic activity,[4] but they worsened beginning at 8 p.m. of Saturday night.
The population of Chã das Caldeiras, totaling around 1,000 inhabitants, spent the night outside their homes due to the strong earthquakes,[4] and started being evacuated when the eruption began.[5] Like in 1995, some people initially refused to abandon their homes, but have gradually heeded the authorities' instructions.
more info
news link (w/video footage) 1
portuguese news link (w/video footage) 2
resume of some events since the eruption in 23 November
bit of heavier action on the south rim yesterday, one a 5.23
Date/Time: 1/12/2014 12:52:30
Lat: 64.61721 Long: -17.42799
Magnitude: 5.23 ML
Depth: 4 km
Quality: 99%
Energy Released: 1055.3787 TTNT
Catalog Source: Icelandic Meteorological Office (preliminary list)
edit on 12u33533514 by muzzy because: (no reason given)
I'm losing interest in this Bardarbunga, a bit like everyone else, same old same old, even the Caldera is getting boring to watch daily.
except
more from the Scientific Advisory Board of the Icelandic Civil Protection review
From now on I'm just going to do a weekly update, maybe animated, and maybe interactive, as long as there isn't more than 700 events.
Tomorrow.
except
The activity peaked in first half of September, it has slowly decreased since then, but activity remains intense. The period of seismic unrest is one of the largest ever recorded in a volcano globally.........
......... the subsidence of Bardarbunga and the volcanic eruption on Holuhraun will continue for at least some months
more from the Scientific Advisory Board of the Icelandic Civil Protection review
From now on I'm just going to do a weekly update, maybe animated, and maybe interactive, as long as there isn't more than 700 events.
Tomorrow.
edit on 1200000034134114 by muzzy because: (no reason given)
Entering a new phase of mapping due to Google Classic Maps becoming redundant Feb 2015 I'm going to change the layout of the Bardarbunga-Holuhraun
pages to weekly posts, already 150 maps are on it, too much work to change them all.
The Scientific Advisory Board of the Icelandic Civil Protection seem to think this is going to go on well into 2015.
The weekly map will be an animation, and I'll have to change the daily graph to a weekly graph. Its a bit too condensed at the size I have the daily map so will have to expand it
Two choices of graph, and I will consider ATS opinions on this before retroposting the entire series
right click "view image" for full size (clearer)
IMO Verdur style
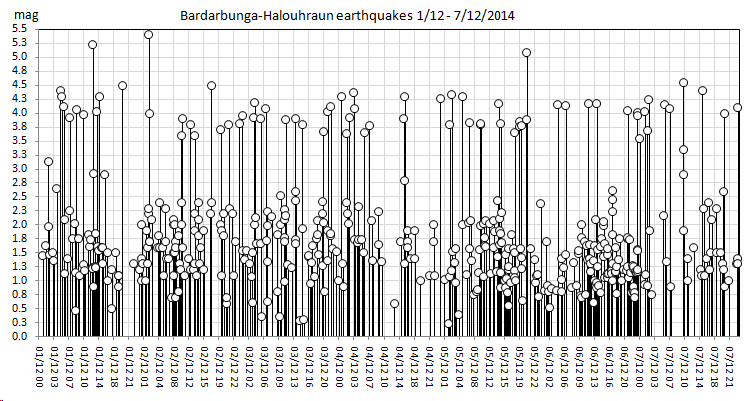
Muzzy style
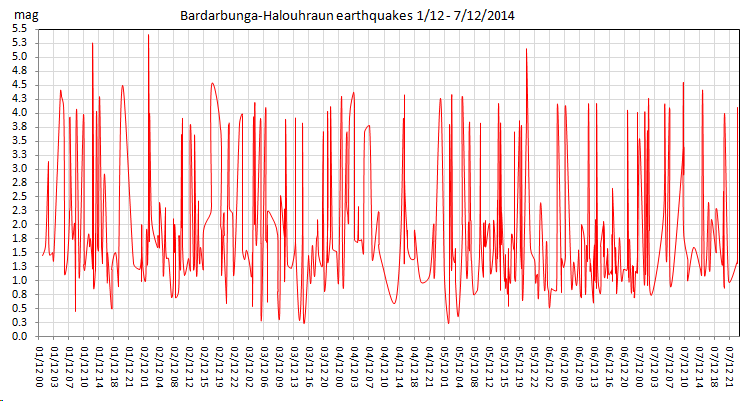
I quite like the IMO Verdur style myself, the Muzzy aftershock style doesn't really fit the weekly data well, as its pretty much just a wave of traces. Although it is in the Verdur style it's a little bit different, more like the GPS graph, but with round tops rather than square.
I'm not trying to compete with IMO, but add value to the comprehensive data they do a great job in gathering.
Also of concern regarding the mapping, it appears GPS Visualiser is having also difficulties with this Google Classic to MyMaps change too, when I create the GIF images, it takes ages for the icons to load, and there is a status popup at the bottom of the screen saying "waiting for google api" which I have never seen before. Lets hope Adam can get on top of this, as the only other option is to create my own maps on Excel, which is a major undertaking.
here is an example of a weekly animation, I made it smaller than the other Caldera animations I have made previously, so that I don't blow out my storage space on Wordpress too quickly, each animation is 200kb so 5 months of animations will only be 10MB.
I'm trying to get away from having to use Google at all, yesterday I had trouble loading the NZ KMZ files and graphs onto Google Drive Storage.
The Scientific Advisory Board of the Icelandic Civil Protection seem to think this is going to go on well into 2015.
The weekly map will be an animation, and I'll have to change the daily graph to a weekly graph. Its a bit too condensed at the size I have the daily map so will have to expand it
Two choices of graph, and I will consider ATS opinions on this before retroposting the entire series
right click "view image" for full size (clearer)
IMO Verdur style
Muzzy style
I quite like the IMO Verdur style myself, the Muzzy aftershock style doesn't really fit the weekly data well, as its pretty much just a wave of traces. Although it is in the Verdur style it's a little bit different, more like the GPS graph, but with round tops rather than square.
I'm not trying to compete with IMO, but add value to the comprehensive data they do a great job in gathering.
Also of concern regarding the mapping, it appears GPS Visualiser is having also difficulties with this Google Classic to MyMaps change too, when I create the GIF images, it takes ages for the icons to load, and there is a status popup at the bottom of the screen saying "waiting for google api" which I have never seen before. Lets hope Adam can get on top of this, as the only other option is to create my own maps on Excel, which is a major undertaking.
here is an example of a weekly animation, I made it smaller than the other Caldera animations I have made previously, so that I don't blow out my storage space on Wordpress too quickly, each animation is 200kb so 5 months of animations will only be 10MB.
I'm trying to get away from having to use Google at all, yesterday I had trouble loading the NZ KMZ files and graphs onto Google Drive Storage.
edit on 12u34234214 by muzzy because: (no reason given)
Bardarbunga 08/12 – 14/12/2014 Map ANimation and Graph available for viewing
usual place
summary
mag~1= 121
mag1= 364
mag2= 79
mag3= 84
mag4= 42
mag5= 0
total= 690
total energy released= 2,702.785TTNT
usual place
summary
mag~1= 121
mag1= 364
mag2= 79
mag3= 84
mag4= 42
mag5= 0
total= 690
total energy released= 2,702.785TTNT
Bardabunga - Herdubreid since 11th August
mag~1= 3,279
mag1= 6,937
mag2= 2,372
mag3= 853
mag4= 470
mag5= 70
total= 13,981
TTNT= 127,320.391
99% quality data from IMO
Area Lat/Long
Lat 64.2 to 65.4
Long -16.2 to -18.4
mag~1= 3,279
mag1= 6,937
mag2= 2,372
mag3= 853
mag4= 470
mag5= 70
total= 13,981
TTNT= 127,320.391
99% quality data from IMO
Area Lat/Long
Lat 64.2 to 65.4
Long -16.2 to -18.4
Thank you so much, following Bardarbunga Muzzy. And everything that you post.
I have been a die hard watching this volcano, and I have come to the concusion, that this thing is just gonna do it;s own thing.
To me it's agood thing. But there is a side to me that was soooo excited to see this thing totally collapse.
This is nature in it's own way of saying....... I do what the heck I want, when I want, and how I want.
Reminds me of my children. (21-24) There gonna do what they are gonna do.
I need to get a life.
Damn, It felt good to say that.
I'll still be watching, but I have to remember, I am only an observer.
I will be prepared!!!!!
If I have learned anything in my study of Earthquakes, it has been to be aware of your surroundings. Know the area where you live.
Have a plan. Just in case!!!!
Thanks crappiekat, its only because other people (like yourself) are interested too that I bother to keep at it.
Its probably like following NZ quakes, as soon as you take your eye off it something happens and you miss it.
There is so much you can do with the data, here is a map I created just now using the entire list of 13,981 earthquakes.
I'm working my way backwards on a weekly basis, using the reviewed data rather than the preliminary data off IMO, just when I have the time.
right click "view image " for full size
a reply to: crappiekat
Oh yeah, didn't see it until you mentioned it
very good
Oh yeah, didn't see it until you mentioned it
very good
edit on 12u35035014 by muzzy because: (no reason given)
next years volcano watchs thread is open for business, its missing the normal links to verious websites . but all of the older threads are linked .
yes i vant you people to work that index finger and go clicking happy . lol no seriously we ve had a busy year with icelands volcano still erupting ,
in fact its become boring . i want to thank everybody for their faithful and continued research and posting to these by years end amazing threads
.. and yes i do read every post .. lately i just prefer to remain in the backround .. peace out and happy holidays everyone ...
www.abovetopsecret.com...
www.abovetopsecret.com...
Bardabunga 15/12 - 21/12/2014
I loaded the KML onto NZ Topo Maps and it works!
In initailly it opens to a map of New Zealand, but then it shifts to Iceland automatically.
By default it opens to a Light Blue background, you will need to then click to get Satellite or Map
At least the map loads the 478 icons!, unlike the "new" Google My Maps which is a total waste of time bothering with now.
Click on icons for details of each event.
link here
edit on 12u35535514 by muzzy because: (no reason given)
There seems to be lot of tectonic activity happening in Iceland, you can clearly see the pattern.

What is interesting is the new activity near Geysir, south from Langjökull. Its minor volcano and Langjökull area is not very well known, the activity there is much lower than other areas, there is at least 2 volcanic systems, but very likely more.
The activity in Geysir has died down, but this swarm is first for a long time.
This tectonic activity in Iceland may have effects on Bardarbunga activity. The Bardarbunga has been quite quiet lately.
There is still ongoing activity near Geysir in Iceland. This activity is unusual and I have never seen such strong activity there during my monitoring
activity. The strongest earthquake there has been 3.1 so far, there has been 141 earthquakes during 48h period. There is not known volcano there. The
Geysir erupts 3 times a day, but there has been times when its activity has stopped. It spews the water about 70 meters into the air.

So far there is no news about its activity changing. The swarm still continues.
So far there is no news about its activity changing. The swarm still continues.
new topics
-
University of Texas Instantly Shuts Down Anti Israel Protests
Education and Media: 1 hours ago -
Any one suspicious of fever promotions events, major investor Goldman Sachs card only.
The Gray Area: 3 hours ago -
God's Righteousness is Greater than Our Wrath
Religion, Faith, And Theology: 8 hours ago -
Electrical tricks for saving money
Education and Media: 11 hours ago
top topics
-
VP's Secret Service agent brawls with other agents at Andrews
Mainstream News: 12 hours ago, 10 flags -
Cats Used as Live Bait to Train Ferocious Pitbulls in Illegal NYC Dogfighting
Social Issues and Civil Unrest: 16 hours ago, 8 flags -
Nearly 70% Of Americans Want Talks To End War In Ukraine
Political Issues: 13 hours ago, 4 flags -
Sunak spinning the sickness figures
Other Current Events: 13 hours ago, 4 flags -
Electrical tricks for saving money
Education and Media: 11 hours ago, 4 flags -
Late Night with the Devil - a really good unusual modern horror film.
Movies: 15 hours ago, 2 flags -
Any one suspicious of fever promotions events, major investor Goldman Sachs card only.
The Gray Area: 3 hours ago, 2 flags -
University of Texas Instantly Shuts Down Anti Israel Protests
Education and Media: 1 hours ago, 1 flags -
God's Righteousness is Greater than Our Wrath
Religion, Faith, And Theology: 8 hours ago, 0 flags
active topics
-
Nearly 70% Of Americans Want Talks To End War In Ukraine
Political Issues • 39 • : Dandandat3 -
So this is what Hamas considers 'freedom fighting' ...
War On Terrorism • 260 • : network dude -
University of Texas Instantly Shuts Down Anti Israel Protests
Education and Media • 5 • : FlyersFan -
Hate makes for strange bedfellows
US Political Madness • 43 • : network dude -
Sunak spinning the sickness figures
Other Current Events • 13 • : Xtrozero -
Any one suspicious of fever promotions events, major investor Goldman Sachs card only.
The Gray Area • 7 • : seekshelter -
-@TH3WH17ERABB17- -Q- ---TIME TO SHOW THE WORLD--- -Part- --44--
Dissecting Disinformation • 663 • : MetalThunder -
Russia Ukraine Update Thread - part 3
World War Three • 5731 • : Freeborn -
President BIDEN Vows to Make Americans Pay More Federal Taxes in 2025 - Political Suicide.
2024 Elections • 137 • : CriticalStinker -
I think this life means something.
Philosophy and Metaphysics • 59 • : seekshelter