It looks like you're using an Ad Blocker.
Please white-list or disable AboveTopSecret.com in your ad-blocking tool.
Thank you.
Some features of ATS will be disabled while you continue to use an ad-blocker.

The Debt to GDP Ratio Lie
page: 1share:
I am writing this thread because I wanted to elaborate on a point I made in a different thread, but found that my elaborations were enough to warrant
its own thread. As you can guess from the title of the thread, I will be speaking about the debt to GDP ratio that countries use to determine a
healthy debt level. In Europe, the Euro convergence criteria says that the ratio should be below 60%.
Debt-to-GDP ratio
On the surface, this seems like a decent ratio to gauge a country's debt level as opposed to just using the actual debt level. Yet there are several problems with this ratio that I intend to expand upon below. First here is a chart showing a timeline of the United States' Debt to GDP ratio:
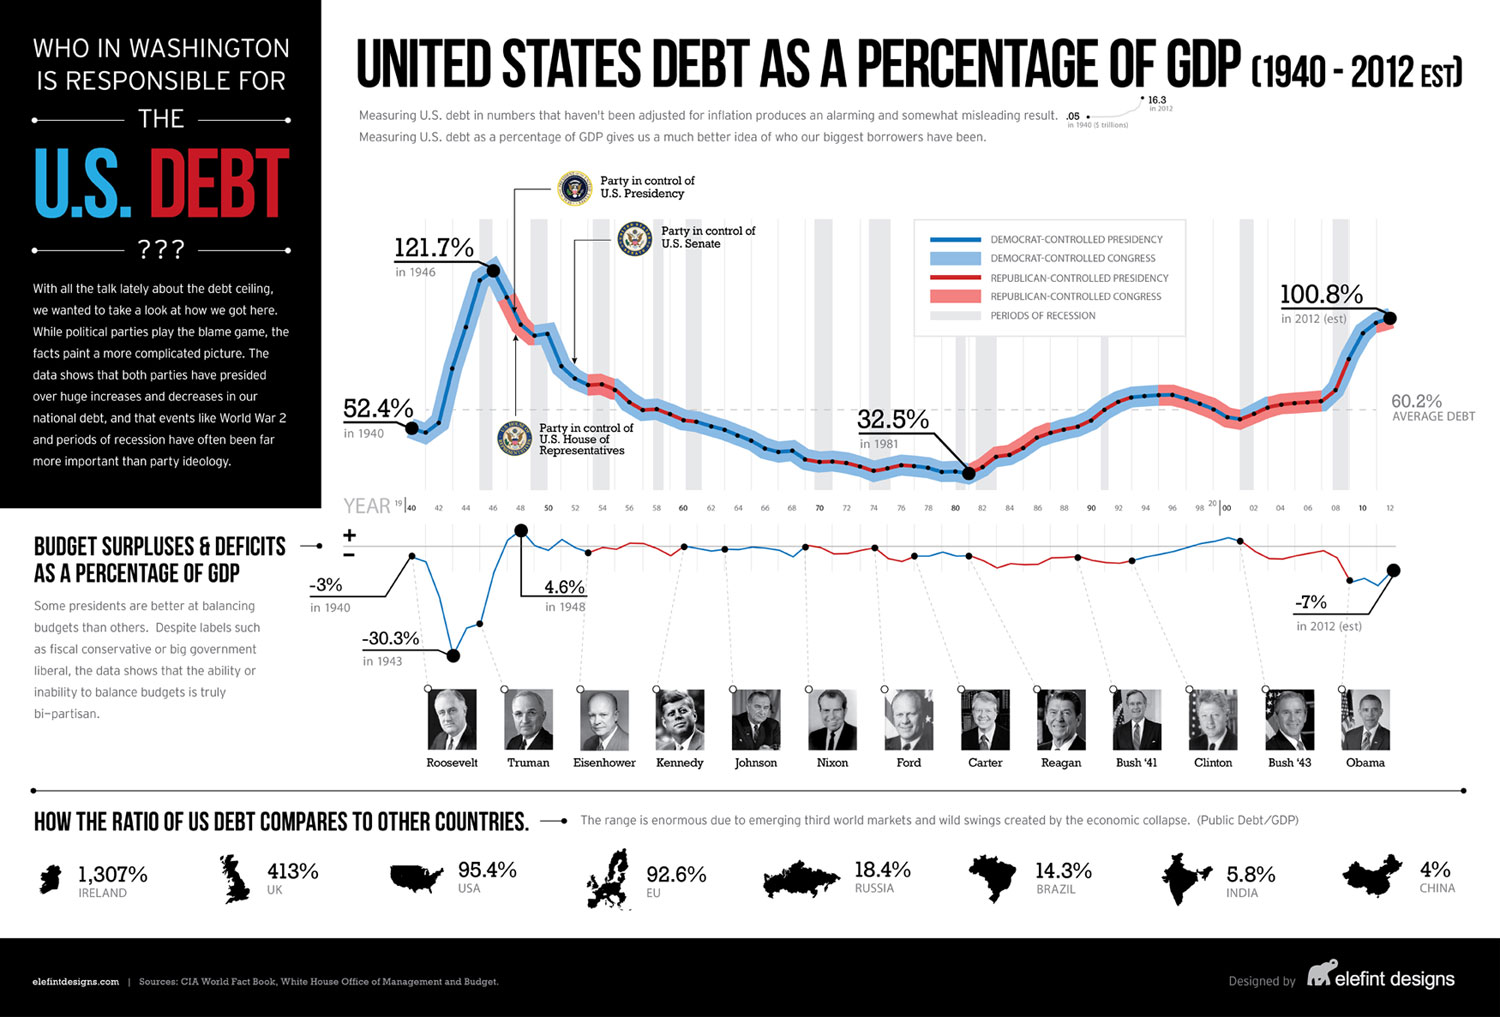
Right off the bat, 100% is not a good number (I know it is lower now, but it isn't at that 60% level I mentioned earlier). So even going by the government's crappy statistic, they are out of bounds for the debt level. Also keep in mind that the Fed puts $85 billion into the economy every month, so the government grows its debt by $85 billion a month as well as increases its GDP by some multiplier (depends on the current fractional reserve limit) each month. That is like taking out a loan every month to pay the bills and when filling out the application, you put the loan amount as part of your income.
GDP is defined as:
Well here is the kicker about GDP. It recounts a dollar bill multiple times or rather every time it is spent. This means that the GDP cannot be used to repay any debts what so ever. Once an entity spends a dollar, it cannot respend that same dollar. Also, since GDP keeps track of all transactions, it is looking at everyone's spending habits. One cannot use other people's money to repay their own debt, that is just called moving debt around. So why is GDP coupled with debt to show a healthy economy?
Now the private sector does use a ratio to determine if an individual can take on more debt. This ratio is called the income to debt ratio and makes far more sense. This ratio measures a person's debt as a percentage of their income. This ratio makes more sense, because it shows that based on your income and debt level whether you can afford to take on more debt and continue paying on it all.
Going by the above paragraph, it would make more sense to look at a government's debt to income ratio to determine a healthy debt level. Except you'd have to rename the ratio since a government's income is called taxes. Let's go ahead and calculate that ratio. So first off what was the United States' total taxes from last year?
US Government Revenue in Recent Decades
Based off of that link above, Government taxes is sitting around $3.6 trillion. So what is the current debt? Here is everyone's favorite link U.S. National Debt Clock which puts our debt at $16.96 trillion.
Do some quick math: 16.96/3.6 * 100 = 471.111
Yes that is right, our country is 471% leveraged against our income. HOLY COW! Seems like a much worse number to report when talking about our economy.
This brings me to my conclusion, it is much better to placate the masses and wave your hand while saying "All is fine" when you use a low number like 100% debt to gdp (not that that number is that great either...) as opposed to 471% debt to taxes. If our government were a private entity, I'm sure all of our creditors would have started filing lawsuits against us LONG ago for raising our debt so high.
Debt-to-GDP ratio
On the surface, this seems like a decent ratio to gauge a country's debt level as opposed to just using the actual debt level. Yet there are several problems with this ratio that I intend to expand upon below. First here is a chart showing a timeline of the United States' Debt to GDP ratio:
Right off the bat, 100% is not a good number (I know it is lower now, but it isn't at that 60% level I mentioned earlier). So even going by the government's crappy statistic, they are out of bounds for the debt level. Also keep in mind that the Fed puts $85 billion into the economy every month, so the government grows its debt by $85 billion a month as well as increases its GDP by some multiplier (depends on the current fractional reserve limit) each month. That is like taking out a loan every month to pay the bills and when filling out the application, you put the loan amount as part of your income.
GDP is defined as:
Gross domestic product (GDP) is the market value of all officially recognized final goods and services produced within a country in a given period of time. GDP per capita is often considered an indicator of a country's standard of living;[2][3]
Well here is the kicker about GDP. It recounts a dollar bill multiple times or rather every time it is spent. This means that the GDP cannot be used to repay any debts what so ever. Once an entity spends a dollar, it cannot respend that same dollar. Also, since GDP keeps track of all transactions, it is looking at everyone's spending habits. One cannot use other people's money to repay their own debt, that is just called moving debt around. So why is GDP coupled with debt to show a healthy economy?
Now the private sector does use a ratio to determine if an individual can take on more debt. This ratio is called the income to debt ratio and makes far more sense. This ratio measures a person's debt as a percentage of their income. This ratio makes more sense, because it shows that based on your income and debt level whether you can afford to take on more debt and continue paying on it all.
Going by the above paragraph, it would make more sense to look at a government's debt to income ratio to determine a healthy debt level. Except you'd have to rename the ratio since a government's income is called taxes. Let's go ahead and calculate that ratio. So first off what was the United States' total taxes from last year?
US Government Revenue in Recent Decades
Based off of that link above, Government taxes is sitting around $3.6 trillion. So what is the current debt? Here is everyone's favorite link U.S. National Debt Clock which puts our debt at $16.96 trillion.
Do some quick math: 16.96/3.6 * 100 = 471.111
Yes that is right, our country is 471% leveraged against our income. HOLY COW! Seems like a much worse number to report when talking about our economy.
This brings me to my conclusion, it is much better to placate the masses and wave your hand while saying "All is fine" when you use a low number like 100% debt to gdp (not that that number is that great either...) as opposed to 471% debt to taxes. If our government were a private entity, I'm sure all of our creditors would have started filing lawsuits against us LONG ago for raising our debt so high.
edit on 10-10-2013 by Krazysh0t
because: (no reason given)
reply to post by Krazysh0t
Not a whole lot to add to this you've already broken it down in crayons so that even a child could grasp this. This is something I have tried to explain to people I know for years. If you relate the world to how things actually happen in reality like say how it occurs in your own life you will go a long way to seeing through to BS fed every day. Thanks for the great breakdown I hope this ends up front page.
Not a whole lot to add to this you've already broken it down in crayons so that even a child could grasp this. This is something I have tried to explain to people I know for years. If you relate the world to how things actually happen in reality like say how it occurs in your own life you will go a long way to seeing through to BS fed every day. Thanks for the great breakdown I hope this ends up front page.
reply to post by RickyD
Yes, I get tired of seeing people argue that our debt level is fine based off of the Debt to GDP ratio. It's absurd.
Also, here is a wikipedia link to the debt to income ratio I mentioned in the OP, so it can be explained better.
Debt-to-income ratio
Going by the 28/36 rule in the link I get these numbers for allowable debt:
$3,600 billion * .28 = $1,008 billion for debt expense
$3,600 billion * .36 = $1,296 billion for debt expense plus recurring debt
I see those numbers are nowhere near $16,960 billion.
edit on 10-10-2013 by Krazysh0t because: (no reason given)
reply to post by Krazysh0t
Yep same math I get here. Now the next one to tackle is the unemployment rate. How do you get people to understand the real numbers and why as discussed in another recent thread companies post a ton more jobs than are available.
Yep same math I get here. Now the next one to tackle is the unemployment rate. How do you get people to understand the real numbers and why as discussed in another recent thread companies post a ton more jobs than are available.
edit on 10-10-2013 by RickyD because: (no reason
given)
reply to post by Krazysh0t
To put the 471% number in my OP in perspective, if you were to make $60,000 a year, you'd need to have $282,600 in debt. That's a combination of a decent house, a nice car, and a sizable chunk of credit card debt. I'm sure people like that exist in the states but, they are probably also on the verge of bankruptcy or have creditors breathing down their necks.
To put the 471% number in my OP in perspective, if you were to make $60,000 a year, you'd need to have $282,600 in debt. That's a combination of a decent house, a nice car, and a sizable chunk of credit card debt. I'm sure people like that exist in the states but, they are probably also on the verge of bankruptcy or have creditors breathing down their necks.
reply to post by RickyD
You mean like this? www.abovetopsecret.com... Yea, all is fine. Nothing to see here folks, move along.
You mean like this? www.abovetopsecret.com... Yea, all is fine. Nothing to see here folks, move along.
gee...I wonder what happened in 2008, 2009, 2010....can't put my finger on it, it's like something bad happened to the economy (sarcasm intended)
I have heard several times (usually from those wanting to sell gold or silver) that the derivatives scam we are on the hook for is someplace between
170 & 230 trillion... Insane numbers... as if 17 trillion was not bad enough already... Hey it is just electrons or paper... as long as people take
paper or numbers in a bank account for worth, we are sitting pretty, NOT! Grumbles and walks away....
reply to post by Krazysh0t
Even if you do not do the math how you suggest there is another bit of subterfuge. You can not count the salaries of government types. That is mixing both sides of the ledger since they are the black hole down which our taxes disappear.
Actually you should be only looking at WEALTH production. That is manufacturing, mining, forestry and farming.
I will be speaking about the debt to GDP ratio that countries use to determine a healthy debt level.
Even if you do not do the math how you suggest there is another bit of subterfuge. You can not count the salaries of government types. That is mixing both sides of the ledger since they are the black hole down which our taxes disappear.
Actually you should be only looking at WEALTH production. That is manufacturing, mining, forestry and farming.
reply to post by RickyD
I use Shadow Statistics pretty pictures CHARTS and Williams explanation of how the Government scammed us. LINK
Unfortunately most people swallow the government propaganda printed by the MSM.
“One of the saddest lessons of history is this: If we’ve been bamboozled long enough, we tend to reject any evidence of the bamboozle. We’re no longer interested in finding out the truth. The bamboozle has captured us. It’s simply too painful to acknowledge, even to ourselves, that we’ve been taken. Once you give a charlatan power over you, you almost never get it back.” ― Carl Sagan
Now the next one to tackle is the unemployment rate. How do you get people to understand the real numbers
I use Shadow Statistics pretty pictures CHARTS and Williams explanation of how the Government scammed us. LINK
Unfortunately most people swallow the government propaganda printed by the MSM.
“One of the saddest lessons of history is this: If we’ve been bamboozled long enough, we tend to reject any evidence of the bamboozle. We’re no longer interested in finding out the truth. The bamboozle has captured us. It’s simply too painful to acknowledge, even to ourselves, that we’ve been taken. Once you give a charlatan power over you, you almost never get it back.” ― Carl Sagan
You sure income is 3.6 trillion?
According this link:
useconomy.about.com...
2011:
According this link:
useconomy.about.com...
For fiscal year 2012, the U.S. Federal government received $2.450 trillion in revenue. Income taxes contributed the lion's share.
2011:
For the Fiscal Year 2011 Budget, the U.S. Federal government planned to take in $2.6 trillion in revenue. Income taxes contributed 45%, social security taxes were 34%, corporate taxes were only 12%, and the remaining 9% was to come from excise taxes. Unfortunately, revenue only came in at $2.303 trillion.
edit on 10-10-2013 by Plugin because: (no reason given)
reply to post by Krazysh0t
Yes.
Forbes had an article about how great Obama was doing because the stock market was strong (rolls eyes)
First most international corporations are not tied to the USA or even the EU so stocks have nothing to actually do with the US economy. Second the idiot was quoting the 'Official" unemployment and the 'Recovery' (barf, gag)
I and a couple others jump on this with both feet. FINALLY one of the other Forbes authors grudgingly admitted there were 'Discouraged Workers' and these were the highly payed older workers (55-65) who had been forced into early retirement because there were no decent jobs available to them. He had been working with them it seems.
Think about it. These are the 'Rich' that Obama and the left wants to hike taxes on.... Except they are no longer employed!
You mean like this?
Yes.
Forbes had an article about how great Obama was doing because the stock market was strong (rolls eyes)
First most international corporations are not tied to the USA or even the EU so stocks have nothing to actually do with the US economy. Second the idiot was quoting the 'Official" unemployment and the 'Recovery' (barf, gag)
I and a couple others jump on this with both feet. FINALLY one of the other Forbes authors grudgingly admitted there were 'Discouraged Workers' and these were the highly payed older workers (55-65) who had been forced into early retirement because there were no decent jobs available to them. He had been working with them it seems.
Think about it. These are the 'Rich' that Obama and the left wants to hike taxes on.... Except they are no longer employed!
edit on 10-10-2013
by crimvelvet because: (no reason given)
reply to post by Plugin
Interesting and a good illustration of why the 'Recovery' is political bull patties smeared on paper and sold as news.
It brings home not only are less people working but those working are earning smaller wages. An interesting line of thought to tug.
You sure income is 3.6 trillion?
Interesting and a good illustration of why the 'Recovery' is political bull patties smeared on paper and sold as news.
It brings home not only are less people working but those working are earning smaller wages. An interesting line of thought to tug.
reply to post by crimvelvet
Wow good point. Throw military paychecks in there as well. Let's keep exposing the subterfuge. The surface may be fine, but there is a huge riptide underneath that is just ready to drag the whole country to the depths.
Wow good point. Throw military paychecks in there as well. Let's keep exposing the subterfuge. The surface may be fine, but there is a huge riptide underneath that is just ready to drag the whole country to the depths.
reply to post by Plugin
Well I was going off of that source which didn't exactly spell out what the revenue was, just gave a graph. If you show it as lower than what I said, that makes the situation even worse off. Great find with your sources, I was having a bit of trouble when I was searching for mine.
At $2.3 trillion the ratio looks like this: 737%, So at $60,000 that would be the equivalent of owing $442,200. That's almost half a million dollars on an income barely above the national average.
edit on 10-10-2013 by Krazysh0t because: (no reason given)
reply to post by Plugin
It is interesting to compare that number for 2012 to 2007
HMMMmmm format change...
Not back up to 2007 levels of revenue.
listing of U.S. Federal Budget Deficit 1960 to present
You sure income is 3.6 trillion?
It is interesting to compare that number for 2012 to 2007
For Fiscal Year 2007, the Federal government received $2.568 trillion in revenue. Income taxes contributed 45%, social security taxes were 34%, corporate taxes were 12%, and the remaining 9% came from excise and other miscellaneous taxes. useconomy.about.com...
For Fiscal Year 2009, the Federal government received $2.1 trillion in revenue. Income taxes contributed 45%, social security taxes were 34%, corporate taxes were only 12%, and the remaining 9% was from excise taxes. Revenue was reduced by the recession. useconomy.about.com...
Fiscal Year 2010 Budget Revenue: In Fiscal Year 2010, the Federal government took in $2.165 trillion in revenue. It had budgeted receipts of $2.6 trillion, but the recession took a bite out of the projections. Income taxes contributed 45%, social security taxes were 34%, corporate taxes were 12%, and the remaining 9% was from excise taxes. useconomy.about.com...
Fiscal Year 2011 Budget Revenue: For the Fiscal Year 2011 Budget, the U.S. Federal government planned to take in $2.6 trillion in revenue. Income taxes contributed 45%, social security taxes were 34%, corporate taxes were only 12%, and the remaining 9% was to come from excise taxes. Unfortunately, revenue only came in at $2.303 trillion useconomy.about.com...
For fiscal year 2012, the U.S. Federal government received $2.450 trillion in revenue. Income taxes contributed the lion's share -- $1.132 trillion or 46.2%. Payroll taxes added 34.5%, as follows... useconomy.about.com...
HMMMmmm format change...
Not back up to 2007 levels of revenue.
listing of U.S. Federal Budget Deficit 1960 to present
reply to post by Krazysh0t
I have a bunch of posts in the thread: IMF, World Bank 2013 annual meeting in Washington looking at the international picture.
The US government shutdown is not what you think.
The Annual Meetings of the World Bank Group (WBG) and the International Monetary Fund (IMF) ... take place in Washington, D.C., October 11-13, 2013
The meeting schedule was actually moved up. to October 7 Schedule
The International Bankers plans are in complete disarray. China, Russia and the BRICS countries out maneuvered them and they now have to rethink what they want to do.
Sep 5, 2013 - BRICS agree to capitalize development bank at $100bn
This means the IMF and World Bank now have a rival that the City of London Banksters DO NOT CONTROL.
Time for more popcorn!
Let's keep exposing the subterfuge
I have a bunch of posts in the thread: IMF, World Bank 2013 annual meeting in Washington looking at the international picture.
The US government shutdown is not what you think.
The Annual Meetings of the World Bank Group (WBG) and the International Monetary Fund (IMF) ... take place in Washington, D.C., October 11-13, 2013
The meeting schedule was actually moved up. to October 7 Schedule
The International Bankers plans are in complete disarray. China, Russia and the BRICS countries out maneuvered them and they now have to rethink what they want to do.
Sep 5, 2013 - BRICS agree to capitalize development bank at $100bn
This means the IMF and World Bank now have a rival that the City of London Banksters DO NOT CONTROL.
Time for more popcorn!
reply to post by crimvelvet
Well that is worrying since traditionally countries under our financial system tend to wage war against their rivals and if BRICS can now rival the IMF, that may be a precursor to world war.
Well that is worrying since traditionally countries under our financial system tend to wage war against their rivals and if BRICS can now rival the IMF, that may be a precursor to world war.
Krazysh0t
reply to post by RickyD
Yes, I get tired of seeing people argue that our debt level is fine based off of the Debt to GDP ratio. It's absurd.
Also, here is a wikipedia link to the debt to income ratio I mentioned in the OP, so it can be explained better.
Debt-to-income ratio
Going by the 28/36 rule in the link I get these numbers for allowable debt:
$3,600 billion * .28 = $1,008 billion for debt expense
$3,600 billion * .36 = $1,296 billion for debt expense plus recurring debt
I see those numbers are nowhere near $16,960 billion.edit on 10-10-2013 by Krazysh0t because: (no reason given)
Why are you using a formula to calculate the recommended maximum debt repayment levels to calculate maximum debt levels?
Debt-to-Income
A debt-to-income ratio (often abbreviated DTI) is the percentage of a consumer's monthly gross income that goes toward paying debts.
By the DtI ratio (28/36) the US would be capable of carrying between $812.5 Billion and $1.045 Trillion in debt repayment per year.
The current debt service cost is approx $420 Billion.
By DtI ratios, the US is fine...which is why DtI ratios aren't used, past personal borrowing, very often.
reply to post by peck420
Well it was a solution to a problem that I tried to come up with. Too many threads highlight problems in our country yet fail to provide a solution. I thought maybe this would be a good try. Well, if DtI ratio is a poor solution, then I am out of them... I'll try to keep thinking of one and update my OP if I think of one or one is posted by another member.
Well it was a solution to a problem that I tried to come up with. Too many threads highlight problems in our country yet fail to provide a solution. I thought maybe this would be a good try. Well, if DtI ratio is a poor solution, then I am out of them... I'll try to keep thinking of one and update my OP if I think of one or one is posted by another member.
new topics
-
Israel attacking Iran again.
Middle East Issues: 16 minutes ago -
Michigan school district cancels lesson on gender identity and pronouns after backlash
Education and Media: 20 minutes ago -
When an Angel gets his or her wings
Religion, Faith, And Theology: 1 hours ago -
Comparing the theology of Paul and Hebrews
Religion, Faith, And Theology: 2 hours ago -
Pentagon acknowledges secret UFO project, the Kona Blue program | Vargas Reports
Aliens and UFOs: 2 hours ago -
Boston Dynamics say Farewell to Atlas
Science & Technology: 3 hours ago -
I hate dreaming
Rant: 3 hours ago -
Man sets himself on fire outside Donald Trump trial
Mainstream News: 5 hours ago -
Biden says little kids flip him the bird all the time.
Politicians & People: 5 hours ago -
The Democrats Take Control the House - Look what happened while you were sleeping
US Political Madness: 6 hours ago
top topics
-
The Democrats Take Control the House - Look what happened while you were sleeping
US Political Madness: 6 hours ago, 17 flags -
In an Historic First, In N Out Burger Permanently Closes a Location
Mainstream News: 8 hours ago, 14 flags -
Biden says little kids flip him the bird all the time.
Politicians & People: 5 hours ago, 8 flags -
A man of the people
Medical Issues & Conspiracies: 13 hours ago, 8 flags -
Man sets himself on fire outside Donald Trump trial
Mainstream News: 5 hours ago, 7 flags -
Pentagon acknowledges secret UFO project, the Kona Blue program | Vargas Reports
Aliens and UFOs: 2 hours ago, 5 flags -
4 plans of US elites to defeat Russia
New World Order: 15 hours ago, 4 flags -
Sheetz facing racial discrimination lawsuit for considering criminal history in hiring
Social Issues and Civil Unrest: 6 hours ago, 3 flags -
Boston Dynamics say Farewell to Atlas
Science & Technology: 3 hours ago, 3 flags -
Are you ready for the return of Jesus Christ? Have you been cleansed by His blood?
Religion, Faith, And Theology: 11 hours ago, 3 flags
active topics
-
Israeli Missile Strikes in Iran, Explosions in Syria + Iraq
World War Three • 103 • : dragonridr -
Israel attacking Iran again.
Middle East Issues • 6 • : MetalThunder -
The Democrats Take Control the House - Look what happened while you were sleeping
US Political Madness • 63 • : NoCorruptionAllowed -
Michigan school district cancels lesson on gender identity and pronouns after backlash
Education and Media • 2 • : MetalThunder -
Candidate TRUMP Now Has Crazy Judge JUAN MERCHAN After Him - The Stormy Daniels Hush-Money Case.
Political Conspiracies • 402 • : Zanti Misfit -
Thousands Of Young Ukrainian Men Trying To Flee The Country To Avoid Conscription And The War
Other Current Events • 50 • : DBCowboy -
I hate dreaming
Rant • 6 • : Hecate666 -
Man sets himself on fire outside Donald Trump trial
Mainstream News • 32 • : cherokeetroy -
Pentagon acknowledges secret UFO project, the Kona Blue program | Vargas Reports
Aliens and UFOs • 5 • : Ophiuchus1 -
-@TH3WH17ERABB17- -Q- ---TIME TO SHOW THE WORLD--- -Part- --44--
Dissecting Disinformation • 546 • : MetalThunder