It looks like you're using an Ad Blocker.
Please white-list or disable AboveTopSecret.com in your ad-blocking tool.
Thank you.
Some features of ATS will be disabled while you continue to use an ad-blocker.

Global Warming Slowdown Is Not Good News
page: 4share:
reply to post by CranialSponge
Might want to check this out. The post explains each item in detail later on.
Skeptical Science
Might want to check this out. The post explains each item in detail later on.
Skeptical Science
Anthropogenic CO2?
The human-caused origin (anthropogenic) of the measured increase in atmospheric concentrations of CO2 is a cornerstone of predictions of future temperature rises. As such, it has come under frequent attack by people who challenge the science of global warming. One thing noteworthy about those attacks is that the full range of evidence supporting the anthropogenic nature of the CO2 increase seems to slip from sight. So what is the full range of supporting evidence? There are ten main lines of evidence to be considered:
The start of the growth in CO2 concentration coincides with the start of the industrial revolution, hence anthropogenic;
Increase in CO2 concentration over the long term almost exactly correlates with cumulative anthropogenic emissions, hence anthropogenic;
Annual CO2 concentration growth is less than Annual CO2 emissions, hence anthropogenic;
Declining C14 ratio indicates the source is very old, hence fossil fuel or volcanic (ie, not oceanic outgassing or a recent biological source);
Declining C13 ratio indicates a biological source, hence not volcanic;
Declining O2 concentration indicate combustion, hence not volcanic;
Partial pressure of CO2 in the ocean is increasing, hence not oceanic outgassing;
Measured CO2 emissions from all (surface and beneath the sea) volcanoes are one-hundredth of anthropogenic CO2 emissions; hence not volcanic;
Known changes in biomass too small by a factor of 10, hence not deforestation; and
Known changes of CO2 concentration with temperature are too small by a factor of 10, hence not ocean outgassing.
Kali74
"Many warmers don't take into account the earth's ability to absorb damage or correct things out of the normal. The things that were causing warming 20 years ago are already gone. "
According to who?
According to Earth still being here, and all the life on it, in spite of the fact that the climate has had disaster after disaster, from meteors to volcanoes to ice ages, life has always continued to "find a way", you dont need someone else to tell you that, you just think about it for 5 minutes and it becomes apparently obvious.
edit on 20139America/Chicago09pm9pmWed, 25 Sep 2013 12:28:50 -05000913 by OneManArmy because: (no reason given)
CranialSponge
But quite frankly, I can't be bothered with this AGW topic anymore... it's been done to death. And will continue to do so until finally, one day, mother nature will show us her unequivocal empirical evidence that will completely flush this AGW theory down the toilet.
But until that day comes… we'll continue to pollute and destroy (nothing to do with AGW) the only home we have because TPTB don't really give a flying rat's butt about anything other than the bottom line.

Whilst I disagree with you insofar that I am 100% certain that human activity is causing warming (and, more important IMO, precipitation pattern change) - notwithstanding which many natural factors are also involved both in warming and cooling - I totally agree with you on the rest
I wish we would spend more effort on fighting tropical deforestation etc and general pollution, but I guess that'll only happen when Western Govts think of a scam by which they can raise even more taxes from it ....
edit on 25-9-2013 by AndyMayhew because: (no reason given)
Another, omg the sky is falling because of Human beings are polluting the air.. The global warming movement is a globalist agenda.. There is no
PROOF, no in your face proof, that shows Human being are creating such an impact to our atmosphere that we JUST us humans are creating global warming.
I agree on not littering, I agree on not dumping oil and other toxic waste into our sea, lands air etc.
Yet I am not ever until its proven going to think, or believe WE Humans, are making global warming.
Now here is something for you to think about who believe humans are making Global warming for Earth.
if anything humans are trying to change the weather..... If I had to hypothesis its due to the weakening magnetic field..
The sun is shutting down magnetically... These are changing things not only on EARTH.. BUT IN The solar SYSTEM!!!!!
For humans to be so nit witted to think the universe revolves around themselves is pathetic..
Our planet is avoiding changes.. Venus has bigger plights that have just recently started to happen then on EARTH!
Venus's rotation has slowed by minutes......And big surges in wind speed that would be devastating for Earth.. Jupiter is changing.. Saturn's super storm is off its timed schedule.... Their are bigger changes on the other planets in our Solar system that are a bit more critical then what is happening on Earth.. Earth is a Disney movie compared to the changes on some of these planets, Venus, Jupiter, Saturn etc.
Their shift from NORMAL, IS more severe then what we are trying to say HUMANS are doing to EARTH..
In my opinion we are trying to control the weather, and climate etc.. Due to bigger changes than what they are blaming us for.
all the examples I suggested can simply be found with some amateur research with the internet, or a library...
edit on 25-9-2013 by Bicent76 because: (no reason given)
reply to post by Krakatoa
I'm sure there's a graph out there that shows what you're looking for, I just didn't have luck finding one. Sorry.
I'm sure there's a graph out there that shows what you're looking for, I just didn't have luck finding one. Sorry.
Kali74
reply to post by Krakatoa
I'm sure there's a graph out there that shows what you're looking for, I just didn't have luck finding one. Sorry.
Perhaps you didn't do a Google search on "Vostock ice core data"? If you did, you would find this disussion happened right here at ATS in 2009.
Quick Link to AGW Discussion on ATS with Vostock Data (Thread: Carbon levels dramatically changed 7,000 years ago. Sudden human knowledge?)
Also, digging a little deeper, this page uses the actual Vostock ice core data (as well as 8 additional data sources), which shows the last 12,000 years in detail (i.e. real data, not conjecture based upon emotion).
Temperature Graph of Last 12,000 years
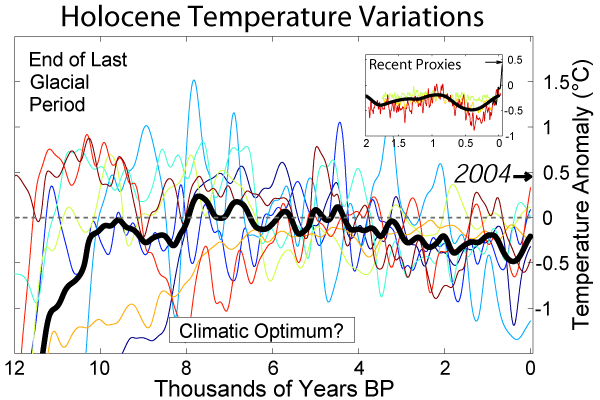
Note: It was warmer for longer approx 11,000 years ago, and humans were here, but not as numerous nor burning fossil fuels at the same level as today, yet the temps coming out of the last ice-age were still higher.
Key snippets from the page related to this discussion are, IMO:
During the Holocene itself, there is general scientific agreement that temperatures on the average have been quite stable compared to fluctuations during the preceding glacial period. The above average curve supports this belief.
Because of the limitations of data sampling, each curve in the main plot was smoothed (see methods below) and consequently, this figure can not resolve temperature fluctuations faster than approximately 300 years. Further, while 2004 appears warmer than any other time in the long-term average, and hence might be a sign of global warming, it should also be noted that the 2004 measurement is from a single year (actually the fourth highest on record, see Image:Short Instrumental Temperature Record.png for comparison). It is impossible to know whether similarly large short-term temperature fluctuations may have occurred at other times, but are unresolved by the available resolution. The next 150 years will determine whether the long-term average centered on the present appears anomalous with respect to this plot.
While any conclusions to be drawn from the long-term average must be considered crude and potentially controversial, one can comment on a number of well established inferences from the individual curves contributing to the average. First, at many locations, there exist large temperature fluctuations on multi-centennial scales.
Boiled down, this translates to "we don't know yet, more data collection over the next 150 years is needed". IMO, if the AGW doomers would change their message to "let's try to save the human race" or "we might be headed for human extinction" as opposed to "save the planet" it would be more relevant to most people. Think about it, the Earth has been through more than what we little short-lived species could ever do, and nature will wipe us out long before we can destroy the planet.
But, that's my opinion, based upon empirical data and not emotion or fear of "doom".
References:
Actual Vostock Data Set
Citation:
Petit, J.R., et al., 2001,
Vostok Ice Core Data for 420,000 Years, IGBP PAGES/World Data Center
for Paleoclimatology Data Contribution Series #2001-076.
NOAA/NGDC Paleoclimatology Program, Boulder CO, USA.)
edit on 9/26/2013 by Krakatoa because: Added data citation
reply to post by Kali74
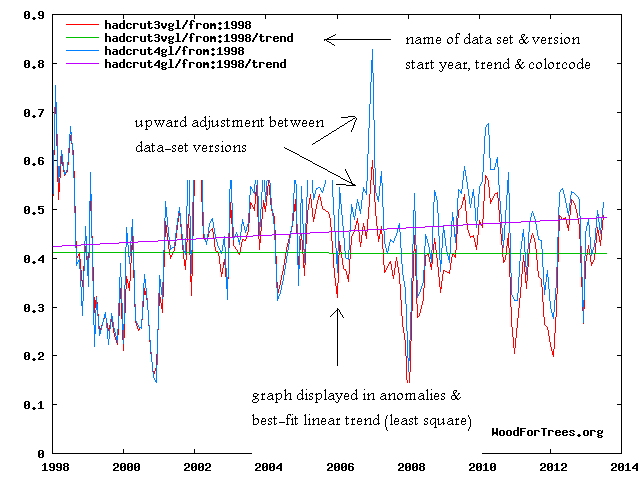
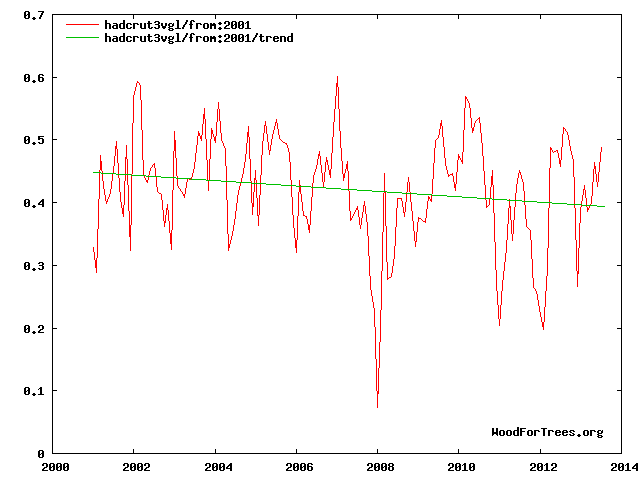
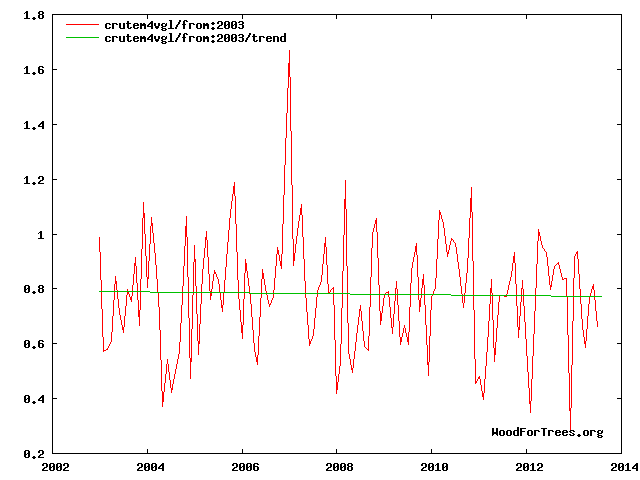
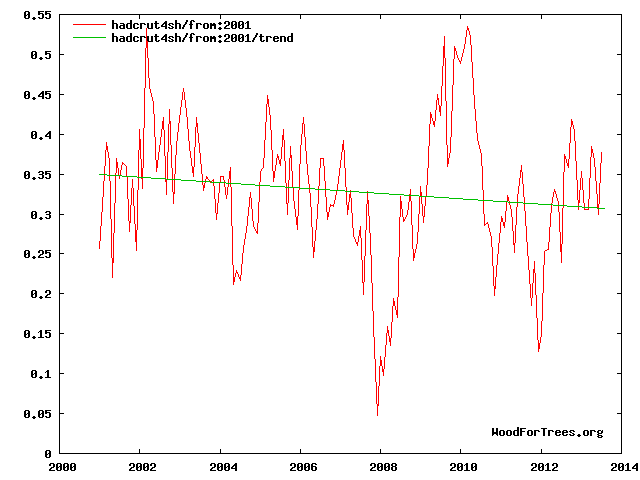
WoodForTrees is a very convenient tool to create graphs for temperature time series. The two main data sets for official surface temperature records are provided (monthly updated) with hemisphere subsets, sea surface, land only plus remote sensing satellite data.
HadCRUT, NASA's GisTEMP and NCDC NOAA (not included) are all based on the same surface station raw data-set. The methods to 'homogenize' and 'adjust' the source data produce slightly different results in the three time series, but the bias is always upwards.
How to use the interface is explained here.
Least squares or best-fit trend lines depend primarily on the source data, time series longer than a decade with enough data points (monthly or annual means) are sufficient to display trends with statistical significance.
Since surface temperature can't be accurately measured to a hundredth of a degree, trends below the threshold of one sigma Standard deviation are considered 'not statistically significant' (here nsts). The threshold would be +/- 0.1°C.
____________________________________________________________________________________
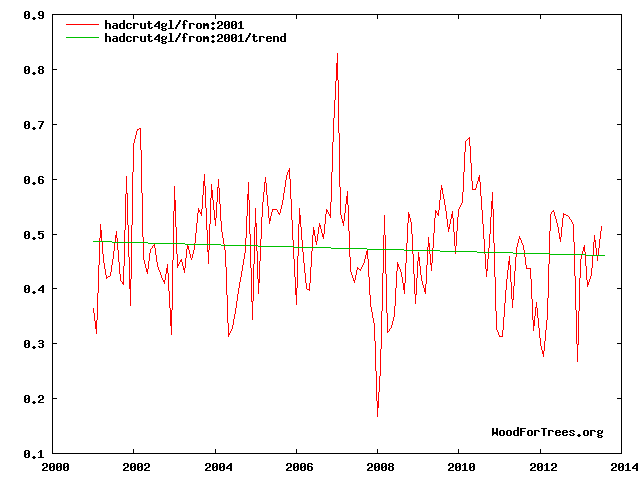 - HadCRUT4: 2001 - 2013 -0.024°C (nsts)
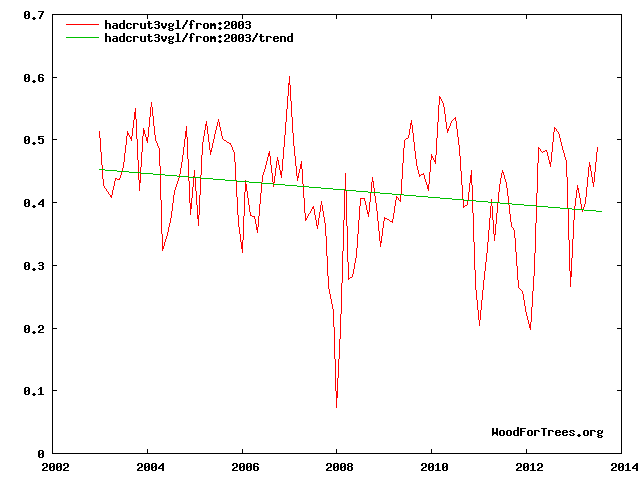
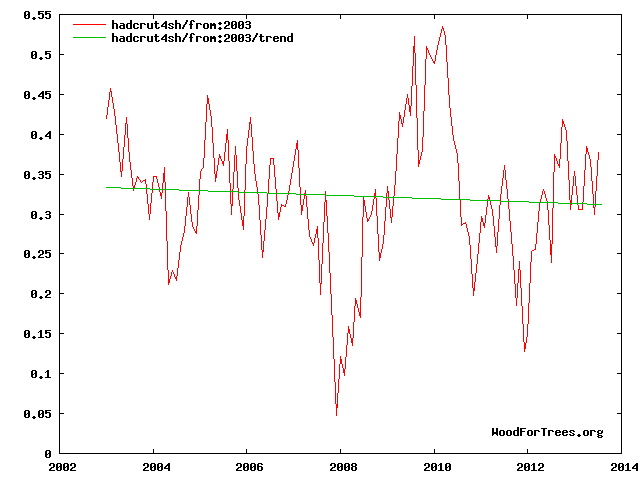
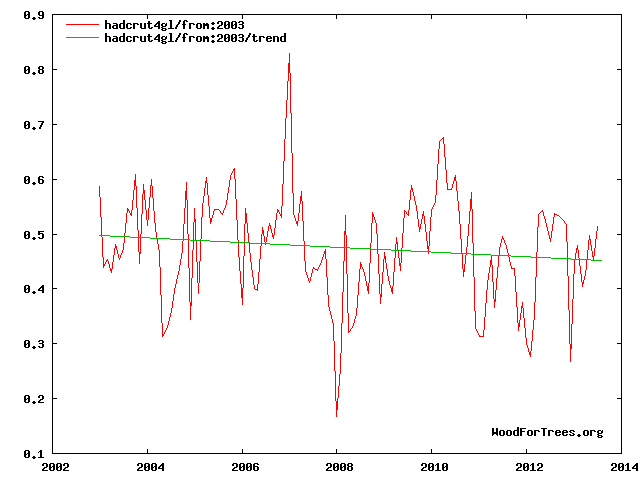 - HadCRUT4: 2003 - 2013 -0.046°C (nsts)
____________________________________________________________________________________
 - HadCRUT3 v.a. 2001 - 2013 -0.055°C (nsts)
 -HadCRUT3 v.a. 2003 - 2013 -0.065°C (nsts)
____________________________________________________________________________________
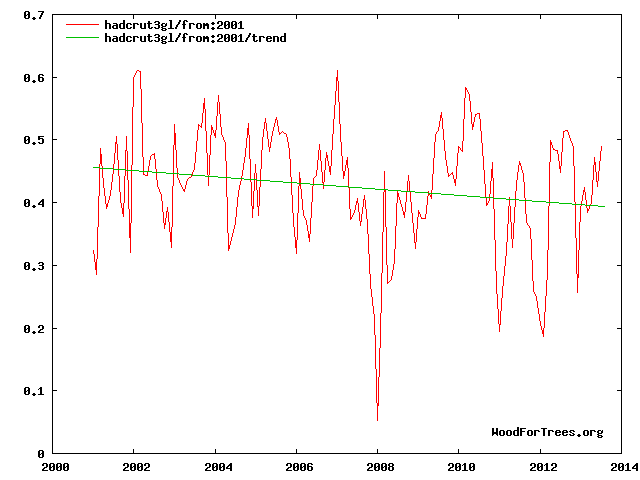 -HadCRUT3 un.a. 2001 - 2013 -0.060°C (nsts)
 -HadCRUT3 un.a. 2003 - 2013 -0.071°C (nsts)
____________________________________________________________________________________
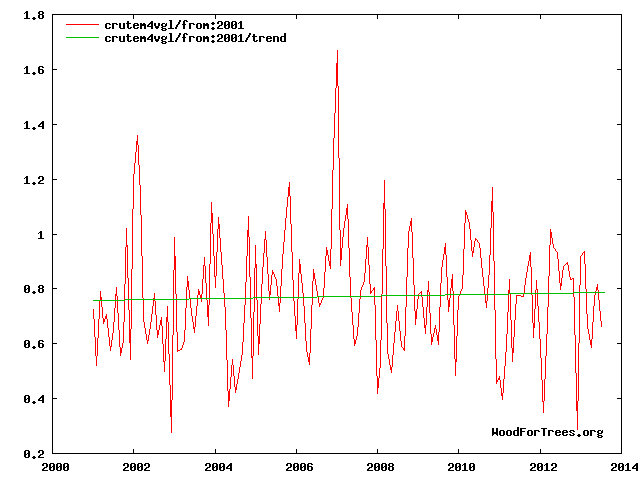 -CRUT4 2001 - 2013 0.025°C (nsts)
 -CRUT4 2003 - 2013 -0.015°C (nsts)
____________________________________________________________________________________
____________________________________________________________________________________
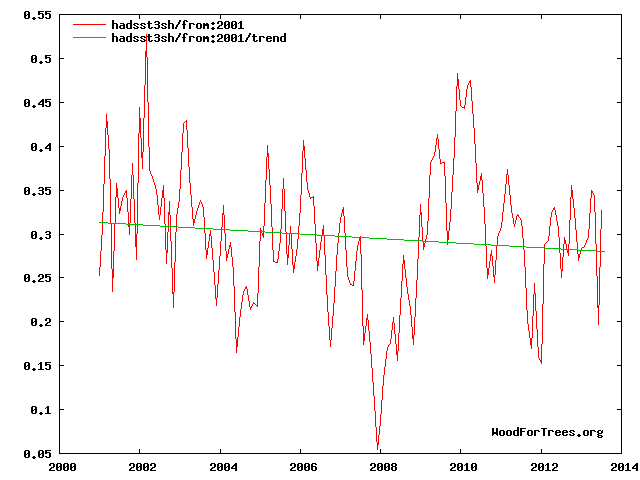
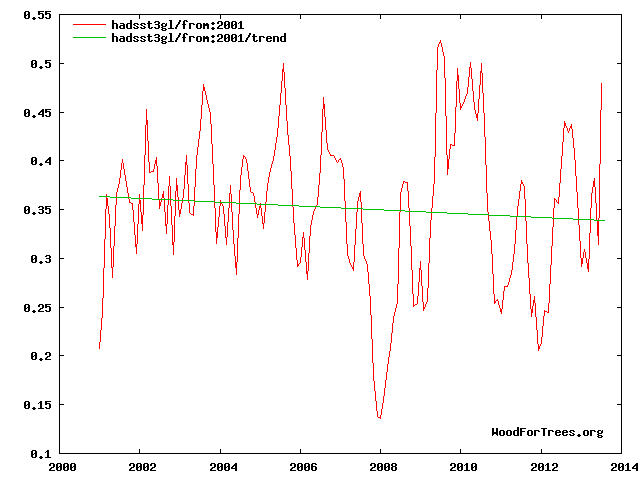 -HadSST3 2001 - 2013 -0023°C (nsts)
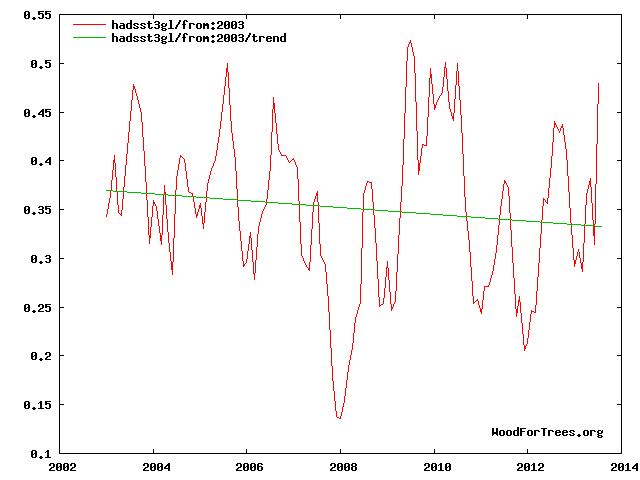 -HadSST3 2003 - 2013 -0.036°C (nsts)
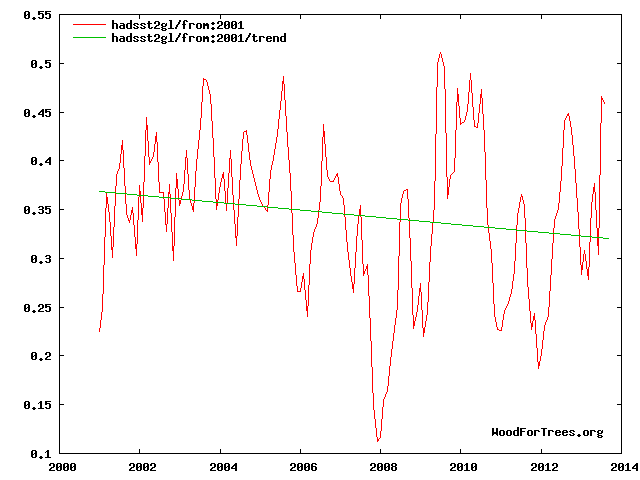 -HadSST2 2001 - 2013 -0.047°C (nsts)
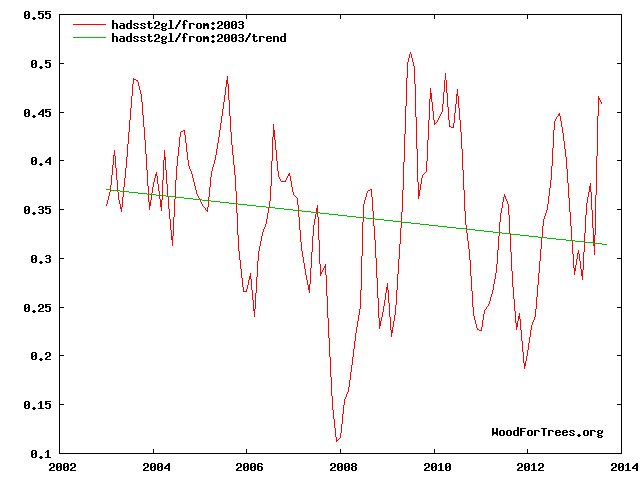 -HadSST2 2003 - 2013 -0.055°C (nsts)
_____________________________________________________________________________________
_____________________________________________________________________________________
Land/Ocean
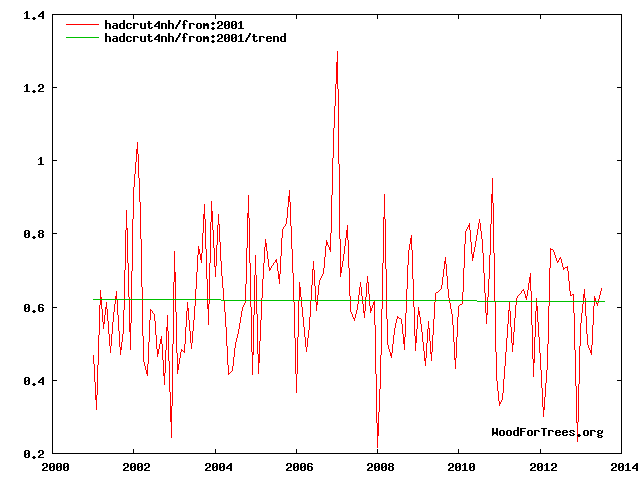 -HadCRUT4 NH 2001- 2013 -0.005°C (nsts)
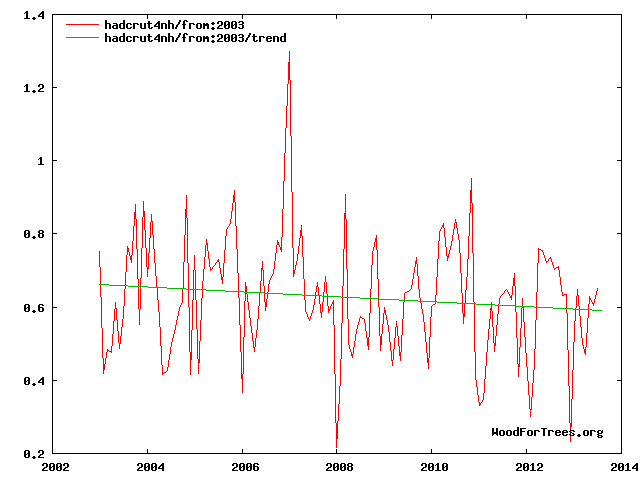 -HadCRUT4 NH 2003 - 2013 -0.071°C (nsts)
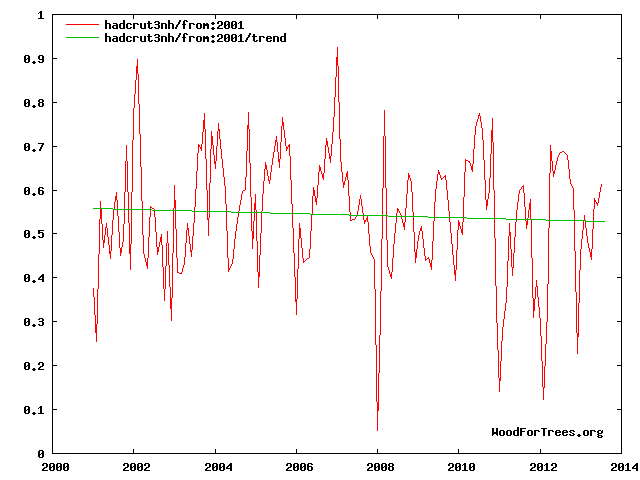 -HadCRUT3 NH v.a. 2001 - 2013 -0.031°C (nsts)
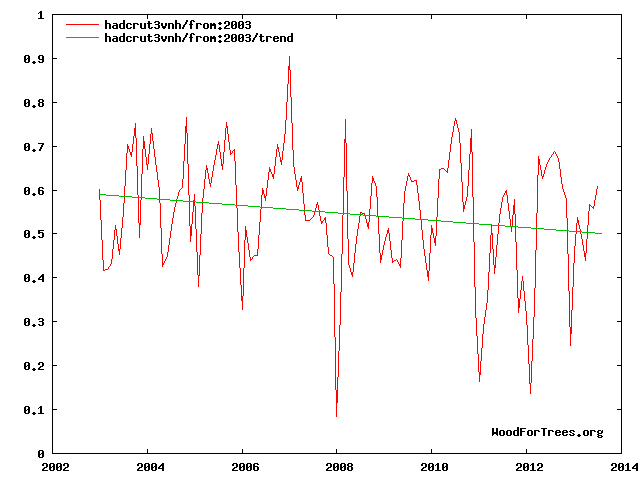 -HadCrut3 NH v.a. 2003 - 2013 -0.088°C (nsts)
_____________________________________________________________________________________
Northern Hemisphere Land only
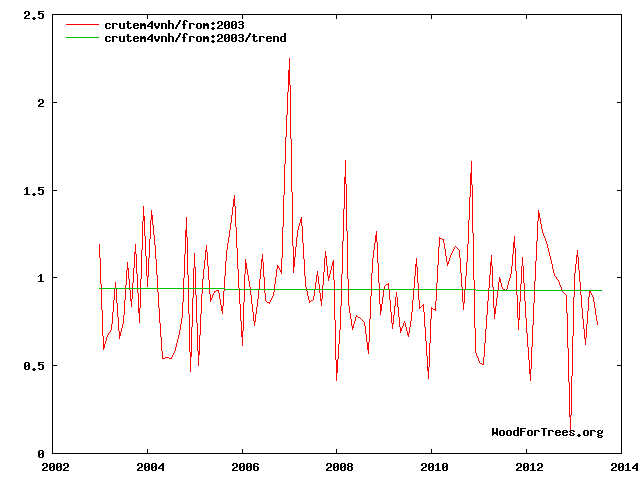 -CRUT4 land only NH 2003 - 2013 -0015°C (nsts)
_____________________________________________________________________________________
Northern Hemisphere SST NH
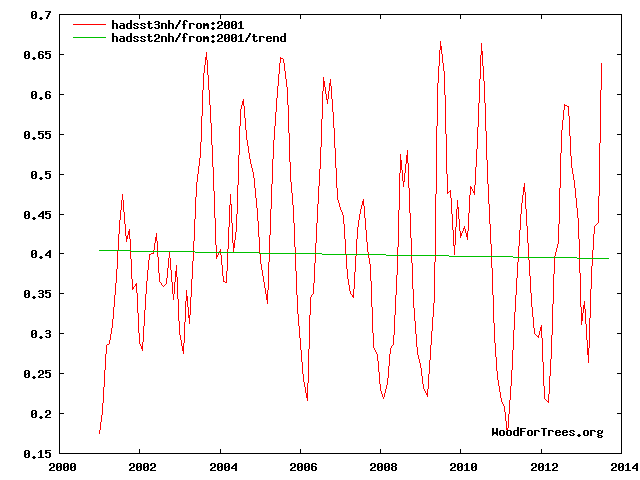 -HadSST NH 2001 - 2013 -0.008°C (nsts)
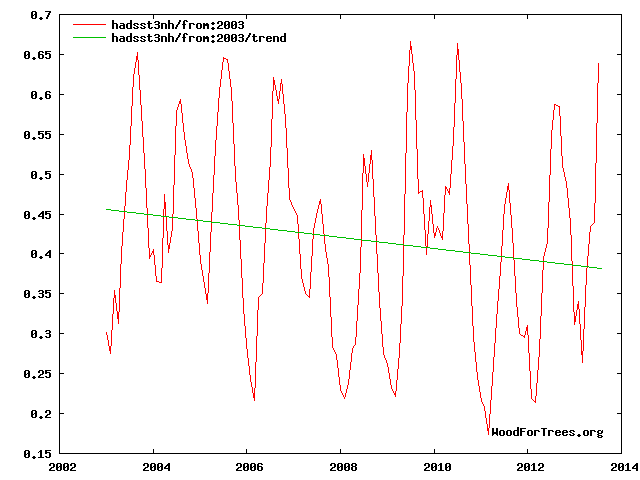 -HadSST NH 2003 - 2013 -0.076°C (nsts)
_____________________________________________________________________________________
_____________________________________________________________________________________
Land/Ocean
 HadCRUT4 SH 2001 - 2013 -0.0975°C (nsts threshold)
 HadCRUT4 SH 2003 - 2013 -0-019°C (nsts)
_____________________________________________________________________________________
Southern Hemisphere Land only
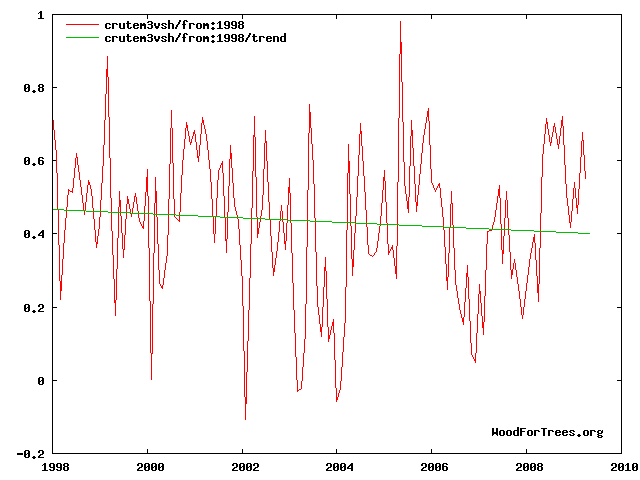 CRUT3 SH land only 1998 - 2009 -0.065°C not updated! (nsts)
_____________________________________________________________________________________
Southern Hemisphere SST
 HadSST SH 2001 - 2013 -0.031°C (nsts)
_____________________________________________________________________________________
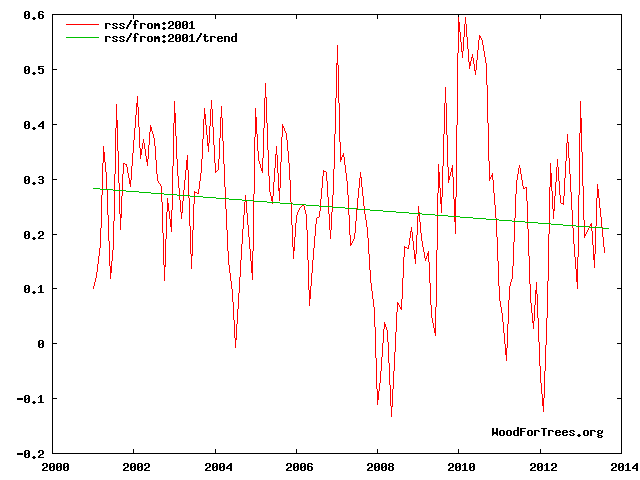 RSS global lT 2001 - 2013 -0.072°C (nsts)
_____________________________________________________________________________________
NCDC NOAA DATA Global Mean Land/Ocean
That last line is very important. For the cooling variables we've been witnessing over the past 15 years, we have had 0 cooling. None.
WoodForTrees is a very convenient tool to create graphs for temperature time series. The two main data sets for official surface temperature records are provided (monthly updated) with hemisphere subsets, sea surface, land only plus remote sensing satellite data.
HadCRUT, NASA's GisTEMP and NCDC NOAA (not included) are all based on the same surface station raw data-set. The methods to 'homogenize' and 'adjust' the source data produce slightly different results in the three time series, but the bias is always upwards.
How to use the interface is explained here.
Least squares or best-fit trend lines depend primarily on the source data, time series longer than a decade with enough data points (monthly or annual means) are sufficient to display trends with statistical significance.
Since surface temperature can't be accurately measured to a hundredth of a degree, trends below the threshold of one sigma Standard deviation are considered 'not statistically significant' (here nsts). The threshold would be +/- 0.1°C.
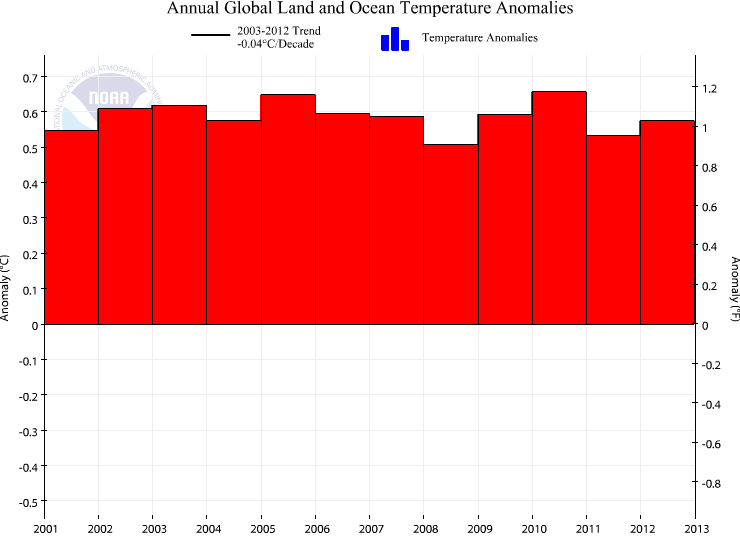
Global Mean Surface Temperature Land/Ocean
(anomalies + trend)____________________________________________________________________________________
____________________________________________________________________________________
____________________________________________________________________________________
____________________________________________________________________________________
Global Mean Surface Temperature Land only
(anomalies +trend)____________________________________________________________________________________
Global Sea Surface Temperature (SST)
(anomalies + trend)____________________________________________________________________________________
_____________________________________________________________________________________
Northern Hemisphere Land/Ocean & Land only & SST
_____________________________________________________________________________________
Land/Ocean
_____________________________________________________________________________________
Northern Hemisphere Land only
_____________________________________________________________________________________
Northern Hemisphere SST NH
_____________________________________________________________________________________
Southern Hemisphere Land/Ocean & Land only & SST
_____________________________________________________________________________________
Land/Ocean
_____________________________________________________________________________________
Southern Hemisphere Land only
_____________________________________________________________________________________
Southern Hemisphere SST
_____________________________________________________________________________________
RSS Satellite lower Troposphere Land/Ocean
_____________________________________________________________________________________
NCDC NOAA DATA Global Mean Land/Ocean
reply to post by talklikeapirat
Out of interest, what would those charts look like if run from 1980 (30 years is usually regarded in meteorology as an standard period for determining climate since it means the expected annual variations are smoothed out. Some argue the period ought be longer)
Running them from variously 1998, 2000 and 2002 seems a bit arbitary and non-comparable ? Is there any particular reason for doing so?
edit on 26-9-2013 by AndyMayhew because: (no reason given)
reply to post by AndyMayhew
If you want to know how temperatures have changed in last 30 years then of course you'd look at longer periods. But if you want to determine the rate of change over the past decade then you look at the last 10-15 years. Many climate scientists were convinced that anthropogenic CO2 emissions are responsible after a warming trend of only 15 years.
That surface temperatures are not rising for almost 15 years now is golden opportunity for scientists to fundamentally rethink some basic premises. There has been a lot of progress in the last couple of months alone.
This is from a paper that was published last November.
This is what happened since then.
30 years is usually regarded in meteorology as an standard period for determining climate since it means the expected annual variations are smoothed out.
If you want to know how temperatures have changed in last 30 years then of course you'd look at longer periods. But if you want to determine the rate of change over the past decade then you look at the last 10-15 years. Many climate scientists were convinced that anthropogenic CO2 emissions are responsible after a warming trend of only 15 years.
That surface temperatures are not rising for almost 15 years now is golden opportunity for scientists to fundamentally rethink some basic premises. There has been a lot of progress in the last couple of months alone.
This is from a paper that was published last November.
Right on track
In 1990, climate scientists from around the world wrote the First Assessment Report of the Intergovernmental Panel on Climate Change. It contained a prediction of the global mean temperature trend over the 1990–2030 period that, halfway through that period, seems accurate.
This is all the more remarkable in hindsight, considering that a number of important external forcings were not included. So how didthis success arise? In the end, the greenhouse-gas-inducedwarming is largely overwhelming the other forcings, which are only of secondary importance on the 20-year timescale.
This is what happened since then.
Overestimated
Recent observed global warming is significantly less than that simulated by climate models. This
difference might be explained by some combination of errors in external forcing, model response and internal climate variability.
The evidence, therefore, indicates that the current generation of climate models (when run as a group, with the CMIP5 prescribed forcings) do not reproduce the observed global warming over the past 20 years, or the slowdown in global warming over the past fifteen years.
edit on 26-9-2013 by talklikeapirat because: running means
reply to post by Krakatoa
Perhaps you should take things in the spirit that they're meant instead of choosing to be a jerk. There was no requirement on my part to look for anything for you yet I did so, now I'm somehow at fault for not finding what you wanted and I'm emotional on top of that?
You said:
And that is what I was looking for, something that looked at the 100 year scale of the Vostok sample... your graph is on a 2k year scale which granted is closer than the original graph I put up... I did in fact find that graph but it wasn't what you asked for so I replied that I couldn't find what you asked for.
WOW!
Perhaps you should take things in the spirit that they're meant instead of choosing to be a jerk. There was no requirement on my part to look for anything for you yet I did so, now I'm somehow at fault for not finding what you wanted and I'm emotional on top of that?
You said:
Also, I would like to see the expanded warming spikes for each time-frame, expanded to the same scale as the end part you added to the graph. That, to me, would be a more accurate comparison to know the previous natural warming profiles.
And that is what I was looking for, something that looked at the 100 year scale of the Vostok sample... your graph is on a 2k year scale which granted is closer than the original graph I put up... I did in fact find that graph but it wasn't what you asked for so I replied that I couldn't find what you asked for.
WOW!
reply to post by talklikeapirat
It's a convenient site to cherry pick with, sure. I stand by what I said and no amount of graph spam is going to change facts.
It's a convenient site to cherry pick with, sure. I stand by what I said and no amount of graph spam is going to change facts.
reply to post by Kali74
reply to post by Krakatoa
There is no Law Dome reconstruction (that i know of) with a higher resolution past the 8,000 year threshold.
Maybe there will be.
reply to post by Krakatoa
There is no Law Dome reconstruction (that i know of) with a higher resolution past the 8,000 year threshold.
Maybe there will be.
reply to post by Kali74
The post was not really for you, you seem to be more interested in politics and ideology than facts.
The post was not really for you, you seem to be more interested in politics and ideology than facts.
talklikeapirat
reply to post by Kali74
The post was not really for you, you seem to be more interested in politics and ideology than facts.
Funny how it's always you that can't seem to restrain yourself from insulting others, yet I'm the emotional one, the political one. That post was a reply to me, to my statement that there has been no cooling despite all the cooling variables over the past 15 or so years.That doesn't sound political to me. Or am I just lying again?
reply to post by Kali74
It's not lying if you really believe it yourself, or is it? Read the first part of your OP again.
You should stay away from SkepticalScience, they're messing with your head.
That was no insult. Just a tip.
It's not lying if you really believe it yourself, or is it? Read the first part of your OP again.
You should stay away from SkepticalScience, they're messing with your head.
That was no insult. Just a tip.
reply to post by talklikeapirat
I'm multi talented. There's political facts concerning AGW and there are scientific facts concerning AGW. Why should a person be required to focus on one or the other? There's nothing wrong with my facts on either front, disagreeing with those facts is called debate... you don't have insult the other party to have one of those. There's nothing wrong with Skeptical Science either.
I'm multi talented. There's political facts concerning AGW and there are scientific facts concerning AGW. Why should a person be required to focus on one or the other? There's nothing wrong with my facts on either front, disagreeing with those facts is called debate... you don't have insult the other party to have one of those. There's nothing wrong with Skeptical Science either.
My two cents (not worth much)......
I have always believed in a solar system climate....
Let me explain.
We have seasons here on earth as we spin around our sun. Why can't there be like cosmic seasons as well as our solar system spins through our galaxy?
There is so much at play in the universe around us. Who knows what can actually effect our climate?
Just as our seasons change as we rotate around the sun, why can't they also change as our sun rotates around the center of our galaxy (black hole)?
"All that we, as a human species, think we know is only a drop in the ocean of knowledge we have yet to learn":-Me
Kali74
reply to post by Krakatoa
Perhaps you should take things in the spirit that they're meant instead of choosing to be a jerk. There was no requirement on my part to look for anything for you yet I did so, now I'm somehow at fault for not finding what you wanted and I'm emotional on top of that?
You said:
Also, I would like to see the expanded warming spikes for each time-frame, expanded to the same scale as the end part you added to the graph. That, to me, would be a more accurate comparison to know the previous natural warming profiles.
And that is what I was looking for, something that looked at the 100 year scale of the Vostok sample... your graph is on a 2k year scale which granted is closer than the original graph I put up... I did in fact find that graph but it wasn't what you asked for so I replied that I couldn't find what you asked for.
WOW!
If my post seemed to you to be derogatory, I apologize. It was not meant to be that way. Believe me, if I wanted to be a jerk, I could be. BUt, in this case, that was not my intention. As for the data request, I was not the one that made the original claim there was an AGW and creating this thread. As the thread OP, you made the claim, and are responsible for providing the proof. I questioned your data, and asked for a more accurate comparison set (if it was available). Your response to me was you couldn't find it. So, I Googled it, found a more detailed data set in about 20 seconds......and proceeded to format a response with real data and not emotional opinion.
I have no political horse in this race, the only race I am in is the human race. And I take exception to the politicos making money off of deceptive practices, and some scientists that embrace a political bias in their data and publications. This is not an accusation against you, per-se, only the perception that the sources you are embracing have those biases hidden within....whether you realize it or not.
I hope this clarifies my side of the debate here.
edit on 9/26/2013 by Krakatoa because: Added clarification
So it really is as bad as all that then huh?
Ok so in 15 years the earth is going to be destroyed then right?
That's what your side has embraced whether you agree with it or not , whether you like it or not.
Politicians as well as so called scientists on the left ALL predicting doom and gloom in 15 years.
So here is my prediction and I'm fairly certain I share this prediction with the majority or climate realists on this thread -
In 15 years despite the fact that NOTHING will happen and NONE of your predictions will come true, rather then reevaluate the positions all you alarmists have taken, rather then entertain the notion that you have all been strung along by a political movement , you will instead come up with more and more reasons why the doom has yet to occur and you will come up with more and more false science to back up your claims.
I make this prediction with 100% certainty.
If I am wrong I will no longer participate in any threads pertaining to climate change.
I am not worried.
We all know you will do this because your alarmist brethren have all done this many times in the past.
Your side has predicted doom in the 70's and in the 80's and in the 90's.
NONE of it has come true.
And still over and over you come up with more and more reasons based in "science" for why the goalpost needs to be moved forward.
Your global warming hypothesis is incorrect .
You are unable to accept that you are wrong.
It has reached the point of pathetisism.
Our side is trying to help you yet over and over year after year you refuse to accept our help and you refuse to.accept that you are wrong.
Despite all your predictions being wrong over the last FOUR DECADES we still live in a fake science world where politicians and an implicit media along with scare tactics have attempted to hijack science itself by politicizing it.
So far this has trumped actual science and what we observe with our own senses.
Because of this the world accepts your incorrect view of reality as the correct one.
It is insane and it is dangerous and people will die as a result of your refusal to accept reality.
So go ahead and make more idiotic predictions about global warming only to once again have to backtrack when your doomline comes to pass without incident.
You need only realize that first it was global cooling followed by global warming followed by climate change to realize this is a fake movement with no interest in Actual science.
It has merely been one attempt after another to create a fake crisis until one finally stuck.
You succeeded in dumbing down the population sufficiently so now Climate Change finally stuck.
Maybe we should start recognizing that these people are well aware that they're on the wrong side.
That it isn't even about science or the climate or saving the world.
It's about pushing an ideological agenda by using environmental Marxism as a way to gain power and trillions of dollars.
Maybe we should stop playing their game.
new topics
-
The good, the Bad and the Ugly!
Diseases and Pandemics: 1 hours ago -
Russian intelligence officer: explosions at defense factories in the USA and Wales may be sabotage
Weaponry: 3 hours ago -
African "Newcomers" Tell NYC They Don't Like the Free Food or Shelter They've Been Given
Social Issues and Civil Unrest: 4 hours ago -
Russia Flooding
Other Current Events: 6 hours ago -
MULTIPLE SKYMASTER MESSAGES GOING OUT
World War Three: 6 hours ago -
Two Serious Crimes Committed by President JOE BIDEN that are Easy to Impeach Him For.
US Political Madness: 7 hours ago -
911 emergency lines are DOWN across multiple states
Breaking Alternative News: 7 hours ago -
Former NYT Reporter Attacks Scientists For Misleading Him Over COVID Lab-Leak Theory
Education and Media: 9 hours ago -
Why did Phizer team with nanobot maker
Medical Issues & Conspiracies: 10 hours ago -
Pro Hamas protesters at Columbia claim hit with chemical spray
World War Three: 10 hours ago
top topics
-
Go Woke, Go Broke--Forbes Confirms Disney Has Lost Money On Star Wars
Movies: 14 hours ago, 13 flags -
Pro Hamas protesters at Columbia claim hit with chemical spray
World War Three: 10 hours ago, 11 flags -
Elites disapearing
Political Conspiracies: 12 hours ago, 9 flags -
Freddie Mercury
Paranormal Studies: 14 hours ago, 7 flags -
African "Newcomers" Tell NYC They Don't Like the Free Food or Shelter They've Been Given
Social Issues and Civil Unrest: 4 hours ago, 7 flags -
A Personal Cigar UFO/UAP Video footage I have held onto and will release it here and now.
Aliens and UFOs: 12 hours ago, 5 flags -
Two Serious Crimes Committed by President JOE BIDEN that are Easy to Impeach Him For.
US Political Madness: 7 hours ago, 5 flags -
Russian intelligence officer: explosions at defense factories in the USA and Wales may be sabotage
Weaponry: 3 hours ago, 4 flags -
911 emergency lines are DOWN across multiple states
Breaking Alternative News: 7 hours ago, 4 flags -
Former NYT Reporter Attacks Scientists For Misleading Him Over COVID Lab-Leak Theory
Education and Media: 9 hours ago, 4 flags
active topics
-
Russian intelligence officer: explosions at defense factories in the USA and Wales may be sabotage
Weaponry • 68 • : RussianTroll -
Former NYT Reporter Attacks Scientists For Misleading Him Over COVID Lab-Leak Theory
Education and Media • 4 • : Vermilion -
Russia Flooding
Other Current Events • 4 • : Dalamax -
African "Newcomers" Tell NYC They Don't Like the Free Food or Shelter They've Been Given
Social Issues and Civil Unrest • 8 • : FlyersFan -
Elites disapearing
Political Conspiracies • 22 • : CitizenB -
I Guess Cloud Seeding Works
Fragile Earth • 22 • : Degradation33 -
-@TH3WH17ERABB17- -Q- ---TIME TO SHOW THE WORLD--- -Part- --44--
Dissecting Disinformation • 520 • : cherokeetroy -
Two Serious Crimes Committed by President JOE BIDEN that are Easy to Impeach Him For.
US Political Madness • 9 • : Myhandle -
MULTIPLE SKYMASTER MESSAGES GOING OUT
World War Three • 15 • : cherokeetroy -
A Personal Cigar UFO/UAP Video footage I have held onto and will release it here and now.
Aliens and UFOs • 10 • : Hakaiju