It looks like you're using an Ad Blocker.
Please white-list or disable AboveTopSecret.com in your ad-blocking tool.
Thank you.
Some features of ATS will be disabled while you continue to use an ad-blocker.

A Climate Change Glossary
page: 13
share:
Table of Contents
_____________________
Prelude
- Research
_________________________
- Main Glossary
__________________________
- Main Glossary
- Research & Data
- Units
__________________________
- Main Glossary
- Research & Data
- Units
__________________________
- Main Glossary
- Research & Data
_____________________
- Section 4.1 - Paleoclimatology
- Climate Models & Observations
- Research & Data
- Units
____________________________
- Chartjunk
- Alternative Research
- Sho' me the funny
_____________________________________________________________________
Prelude
...defining the players, not the game...
The earth's climate system is an interactive system consisting of five major components: the atmosphere, the hydrosphere, the cryosphere, the land surface and the biosphere, forced or influenced by various complex mechanisms. As complex as the climate system itself is the science to monitor and study it, and the scientific terminology to describe it.
This glossary is meant to serve as a guide and a database for interested members. It is only preliminary and by no means comprehensive. It is designed to provide departure points for future cumulative research on the complex topic - the Science of Climate Change -
_____________________________________________________________________
- Research
The Intergovernmental Panel on Climate Change - (IPCC) is a scientific intergovernmental body, set up at the request of member governments. It was first established in 1988 by two United Nations organizations, the World Meteorological Organization (WMO) and the United Nations Environment Programme (UNEP), and later endorsed by the United Nations General Assembly through Resolution 43/53. Its mission is to provide comprehensive scientific assessments of current scientific, technical and socio-economic information worldwide about the risk of climate change caused by human activity, its potential environmental and socio-economic consequences, and possible options for adapting to these consequences or mitigating the effects.
IPCC Glossary
_______________________________________________________________
_____________________
Prelude
- Research
_________________________
Section 1 - Climate
- Main Glossary
__________________________
Section 2 - Oceans
- Main Glossary
- Research & Data
- Units
__________________________
Section 3 - The Sun
- Main Glossary
- Research & Data
- Units
__________________________
Section 4 - Climate Change
- Main Glossary
- Research & Data
_____________________
- Section 4.1 - Paleoclimatology
- Climate Models & Observations
- Research & Data
- Units
____________________________
Section - 5 Appendix
- Chartjunk
- Alternative Research
- Sho' me the funny
_____________________________________________________________________
Prelude
...defining the players, not the game...
The earth's climate system is an interactive system consisting of five major components: the atmosphere, the hydrosphere, the cryosphere, the land surface and the biosphere, forced or influenced by various complex mechanisms. As complex as the climate system itself is the science to monitor and study it, and the scientific terminology to describe it.
This glossary is meant to serve as a guide and a database for interested members. It is only preliminary and by no means comprehensive. It is designed to provide departure points for future cumulative research on the complex topic - the Science of Climate Change -
_____________________________________________________________________
- Research
The Intergovernmental Panel on Climate Change - (IPCC) is a scientific intergovernmental body, set up at the request of member governments. It was first established in 1988 by two United Nations organizations, the World Meteorological Organization (WMO) and the United Nations Environment Programme (UNEP), and later endorsed by the United Nations General Assembly through Resolution 43/53. Its mission is to provide comprehensive scientific assessments of current scientific, technical and socio-economic information worldwide about the risk of climate change caused by human activity, its potential environmental and socio-economic consequences, and possible options for adapting to these consequences or mitigating the effects.
IPCC Glossary
_______________________________________________________________
Climate -
Climate - is the pattern of variation in temperature, humidity, atmospheric pressure, wind, precipitation, atmospheric particle count and other meteorological variables in a given region over long periods. Climate can be contrasted to weather, which is the present condition of these variables over shorter periods.
Weather- generally refers to day-to-day temperature and precipitation activity, whereas climate is the term for the average atmospheric conditions over longer periods of time.
The atmosphere of Earth - is a layer of gases surrounding the planet Earth that is retained by Earth's gravity. The atmosphere protects life on Earth by absorbing ultraviolet solar radiation, warming the surface through heat retention (greenhouse effect), and reducing temperature extremes between day and night (the diurnal temperature variation).
Hydrosphere - in physical geography describes the combined mass of water found on, under, and over the surface of a planet.
Cryosphere - collectively describes the portions of the Earth’s surface where water is in solid form, including sea ice, lake ice, river ice, snow cover, glaciers, ice caps and ice sheets, and frozen ground (which includes permafrost).
Geosphere - refers to the solid parts of the Earth and is used along with atmosphere, hydrosphere, and biosphere to describe the systems of the Earth (the interaction of these systems with the heliosphere is sometimes listed). In that context, sometimes the term lithosphere is used instead of geosphere. However, the lithosphere only refers to the uppermost layers of the solid Earth (oceanic and continental crustal rocks and uppermost mantle).
Biosphere - is the global sum of all ecosystems. It can also be called the zone of life on Earth, a closed (apart from solar and cosmic radiation and heat from the interior of the Earth), and self-regulating system.[1] From the broadest biophysiological point of view, the biosphere is the global ecological system integrating all living beings and their relationships, including their interaction with the elements of the lithosphere, hydrosphere, and atmosphere.
Climate oscillation - or climate cycle is any recurring cyclical oscillation within global or regional climate, and is a type of climate pattern. These fluctuations in atmospheric temperature, sea surface temperature, precipitation or other parameters can be quasi-periodic, often occurring on inter-annual, multi-annual, decadal, multidecadal, century-wide, millennial or longer timescales. A prominent example is the El Niño-Southern Oscillation, involving sea surface temperatures along a stretch of the equatorial Central and East Pacific Ocean and the western coast of tropical South America, but which affects climate worldwide.
ENSO - or El Niño/La Niña–Southern Oscillation, is a band of anomalously warm ocean water temperatures that occasionally develops off the western coast of South America and can cause climatic changes across the Pacific Ocean. The 'Southern Oscillation' refers to variations in the temperature of the surface of the tropical eastern Pacific Ocean (warming and cooling known as El Niño and La Niña, respectively) and in air surface pressure in the tropical western Pacific.
The accepted definition is a warming or cooling of at least 0.5°C (0.9°F) averaged over the east-central tropical Pacific Ocean. Typically, this anomaly happens at irregular intervals of two to seven years, and lasts nine months to two years. The average period length is five years. When this warming or cooling occurs for only seven to nine months, it is classified as El Niño/La Niña "conditions"; when it occurs for more than that period, it is classified as El Niño/La Niña "episodes".
Pacific Decadal Oscillation - (PDO) is a pattern of change in the Pacific Ocean's climate. The PDO is detected as warm or cool surface waters in the Pacific Ocean, north of 20° N. During a "warm", or "positive", phase, the west Pacific becomes cool and part of the eastern ocean warms; during a "cool" or "negative" phase, the opposite pattern occurs.
It shifts phases on at least inter-decadal time scale, usually about 20 to 30 years.
Atlantic Multidecadal Oscillation - (AMO) is a mode of variability occurring in the North Atlantic Ocean and which has its principal expression in the sea surface temperature (SST) field. While there is some support for this mode in models and in historical observations, controversy exists with regard to its amplitude, and in particular, the attribution of sea surface temperature change to natural or anthropogenic causes, especially in tropical Atlantic areas important for hurricane development.
Arctic oscillation - (AO) or Northern Annular Mode/Northern Hemisphere Annular Mode (NAM) is an index (which varies over time with no particular periodicity) of the dominant pattern of non-seasonal sea-level pressure variations north of 20N latitude, and it is characterized by pressure anomalies of one sign in the Arctic with the opposite anomalies centered about 37–45N. The AO is believed by climatologists to be causally related to, and thus partially predictive of, weather patterns in locations many thousands of miles away, including many of the major population centers of Europe and North America.
Temperature - Records of global average surface temperature are usually presented as anomalies rather than as absolute temperatures. A temperature anomaly is measured against a reference value or long-term average.
Absolute temperatures for the Earth's average surface temperature have been derived, with a best estimate of roughly 14 °C (57.2 °F). However, the correct temperature could easily be anywhere between 13.3 and 14.4°C (56 and 58 °F) and uncertainty increases at smaller (non-global) scales.
Precipitation - (also known as one of the classes of hydrometeors, which are atmospheric water phenomena) is any product of the condensation of atmospheric water vapour that falls under gravity. The main forms of precipitation include drizzle, rain, sleet, snow, graupel and hail. Precipitation occurs when a local portion of the atmosphere becomes saturated with water vapour, so that the water condenses and "precipitates".
Atmospheric circulation - is the large-scale movement of air, and the means (together with the smaller ocean circulation) by which thermal energy is distributed on the surface of the Earth.
The large-scale structure of the atmospheric circulation varies from year to year, but the basic climatological structure remains fairly constant.
Oceans -
Ocean - is a body of saline water that composes a large part of a planet's hydrosphere. In the context of Earth, it refers to one or all of the major divisions of the planet's World Ocean – they are, in descending order of area, the Pacific, Atlantic, Indian, Southern (Antarctic), and Arctic Oceans. The word "sea" is often used interchangeably with "ocean", but strictly speaking a sea is a body of saline water (possibly a division of the World Ocean) partly or fully enclosed by land.
Thermocline - (sometimes metalimnion) is a thin but distinct layer in a large body of fluid (e.g. water, such as an ocean or lake, or air, such as an atmosphere) in which temperature changes more rapidly with depth than it does in the layers above or below. In the ocean, the thermocline may be thought of as an invisible blanket which separates the upper mixed layer from the calm deep water below.
Thermohaline circulation - (THC) refers to a part of the large-scale ocean circulation that is driven by global density gradients created by surface heat and freshwater fluxes. The adjective thermohaline derives from thermo- referring to temperature and -haline referring to salt content, factors which together determine the density of sea water.
The thermohaline circulation is sometimes called the ocean conveyor belt, the great ocean conveyor, or the global conveyor belt. On occasion, it is used to refer to the meridional overturning circulation (often abbreviated as MOC). The term MOC, however, is more accurate and well defined, as it is difficult to separate the part of the circulation which is actually driven by temperature and salinity alone as opposed to other factors such as the wind and tidal forces. Temperature and salinity gradients can also lead to a circulation which does not add to the MOC itself.
Ocean Heat Content - OHC is defined as the integrated temperature change times the density of sea water, times specific heat capacity from the surface down to the deep ocean. Estimates of it are made based on temperature measurements or on reanalyses made using a combination of models and observations.
Sea Level - Several terms are used to describe the changing relationships between sea level and dry land. When the term "relative" is used, it means change relative to a fixed point in the sediment pile. The term "eustatic" refers to global changes in sea level relative to a fixed point, such as the centre of the earth, for example as a result of melting ice-caps. The term "steric" refers to global changes in sea level due to thermal expansion and salinity variations. The term "isostatic" refers to changes in the level of the land relative to a fixed point in the earth, possibly due to thermal buoyancy or tectonic effects; it implies no change in the volume of water in the oceans.
Tide gauge - is a device for measuring the change in sea level relative to a datum.
Sensors continuously record the height of the water level with respect to a height reference surface close to the geoid. Water enters the device by the bottom pipe (far end of the tube, see picture), and electronic sensors measure its height and record it to a tiny computer.
Data are available for over 1,750 stations worldwide. At some places records cover centuries, for example in Amsterdam where data dating back to 1700 is available. When it comes to estimating the greater ocean picture, new modern tide gauges can often be improved upon by using satellite data.
ARGO - is an observation system for the Earth's oceans that provides real-time data for use in climate, weather, oceanographic and fisheries research. Argo consists of a large collection of small, drifting oceanic robotic probes deployed worldwide. The probes float as deep as 2 km. Once every 10 days, the probes surface, measuring conductivity and temperature profiles to the surface. From these, salinity and density can be calculated. The data are transmitted to scientists on shore via satellite. The data collected are freely available to everyone, without restrictions. The initial project goal was to deploy 3,000 probes, completed in November 2007.
____________________________________________________________________
NOAA
NOAA TAO
Global Ocean Observing System
ARGO
Earthobservatory NASA
Woods Hole Institution
Ocean Climate Group
ENSO Animation
_____________________________________________________________
- Units
(Kilo)Joule
Salinity
Celsius
The Sun -
The Sun - is the star at the center of the Solar System. It is almost perfectly spherical and consists of hot plasma interwoven with magnetic fields. It has a diameter of about 1,392,684 km (865,374 mi), about 109 times that of Earth, and its mass (about 2×1030 kilograms (2×1027 tons), 330,000 times that of Earth) accounts for about 99.86% of the total mass of the Solar System.
Solar variation - is the change in the amount of radiation emitted by the Sun (see Solar radiation) and in its spectral distribution over years to millennia. These variations have periodic components, the main one being the approximately 11-year solar cycle (or sunspot cycle). The changes also have aperiodic fluctuations. In recent decades, solar activity has been measured by satellites, while before it was estimated using 'proxy' variables. Scientists studying climate change are interested in understanding the effects of variations in the total and spectral solar irradiance on Earth and its climate.
Shortwave radiation - (SW) is radiant energy with wavelengths in the visible (VIS), near-ultraviolet (UV), and near-infrared (NIR) spectra. Once the Earth’s atmosphere receives shortwave solar radiation, the energy is referred to as insolation. This insolation is the energy input responsible to moving the various Earth-atmosphere systems like the energy balance described above but also weather events, oceanic currents, and other Earth cycles.
Sunlight (Solar Radiation) - is a portion of the electromagnetic radiation given off by the Sun, particularly infrared, visible, and ultraviolet light. On Earth, sunlight is filtered through the Earth's atmosphere, and is obvious as daylight when the Sun is above the horizon. When the direct solar radiation is not blocked by clouds, it is experienced as sunshine, a combination of bright light and radiant heat. When it is blocked by the clouds or reflects off other objects, it is experienced as diffused light.
Sunspot cycle - (or solar magnetic activity cycle) is the periodic change in the sun's activity (including changes in the levels of solar radiation and ejection of solar material) and appearance (visible in changes in the number of sunspots, flares, and other visible manifestations). Solar cycles have an average duration of about 11 years. They have been observed (by changes in the sun's appearance and by changes seen on Earth, such as auroras) for hundreds of years.
Solar cycles - Solar activity is variable with six well-determined quasi-periodicities. Attempts to theoretically describe the solar dynamo have so far succeeded only in explaining the qualitative aspects. They fail in a numerical description and notably in one that would permit one to forecast solar activity with acceptable precision. This is so because the solar dynamo is a non-linear system that occasionally shows phase catastrophes. It is a quasi-periodic engine with the properties of deterministic chaos.
Comsic ray flux - The outward expansion of solar ejecta into interplanetary space provides overdensities of plasma that are efficient at scattering high-energy cosmic rays entering the solar system from elsewhere in the galaxy. Since the frequency of solar eruptive events is strongly modulated by the solar cycle, the degree of cosmic ray scattering in the outer solar system varies in step. As a consequence, the cosmic ray flux in the inner solar system is anticorrelated with the overall level of solar activity. This anticorrelation is clearly detected in cosmic ray flux measurements at the Earth's surface.
_____________________________________________________________________
Solar dynamic observatory
SOHO
Virtual solar observatory
Mauna Loa
Space Weather
________________________________________________________________________
- Units
Watt
Radiative flux
Celsius
Climate Change -
Climate change - is a significant and lasting change in the statistical distribution of weather patterns over periods ranging from decades to millions of years. It may be a change in average weather conditions, or in the distribution of weather around the average conditions (i.e., more or fewer extreme weather events).
Climate change is caused by factors that include oceanic processes (such as oceanic circulation), biotic processes, variations in solar radiation received by Earth, plate tectonics and volcanic eruptions, and human-induced alterations of the natural world; these latter effects are currently causing global warming, and "climate change" is often used to describe human-specific impacts.
Radiative forcing - in climate science, is defined as the difference between radiant energy received by the earth and energy radiated back to space. Typically, radiative forcing is quantified at the tropopause in units of watts per square meter of earth's surface. A positive forcing (more incoming energy) warms the system, while negative forcing (more outgoing energy) cools it. Causes of radiative forcing include changes in insolation (incident solar radiation) and in concentrations of radiatively active gases and aerosols.
Outgoing longwave radiation - (OLR) is the energy leaving the earth as infrared radiation at low energy. OLR is a critical component of the Earth’s radiation budget and represents the total radiation going to space emitted by the atmosphere.[1] Earth's radiation balance is very closely achieved since the OLR very nearly equals the Shortwave Absorbed Radiation received at high energy from the sun. Thus, the first law of thermodynamics (energy conservation) is satisfied and the Earth's average temperature is very nearly stable.
Climate sensitivity - is a measure of how responsive the temperature of the climate system is to a change in the radiative forcing of the system. Although climate sensitivity is usually used in the context of radiative forcing by carbon dioxide (CO2), it is thought of as a general property of the climate system: the change in surface air temperature (ΔTs) following a unit change in radiative forcing (RF), and thus is expressed in units of °C/(W/m2).
Greenhouse gas - (sometimes abbreviated GHG) is a gas in an atmosphere that absorbs and emits radiation within the thermal infrared range. This process is the fundamental cause of the greenhouse effect. The primary greenhouse gases in the Earth's atmosphere are water vapor, carbon dioxide, methane, nitrous oxide, and ozone. In the Solar System, the atmospheres of Venus, Mars, and Titan also contain gases that cause greenhouse effects. Greenhouse gases greatly affect the temperature of the Earth; without them, Earth's surface would average about 33°C colder than the present average of 14 °C (57 °F).
Water vapor - or aqueous vapor is the gas phase of water. It is one state of water within the hydrosphere. The condensation of water vapor to the liquid or ice phase is responsible for clouds, rain, snow, and other precipitation, all of which count among the most significant elements of what we experience as weather.
Less obviously, the latent heat of vaporization, which is released to the atmosphere whenever condensation occurs, is one of the most important terms in the atmospheric energy budget on both local and global scales. For example, latent heat release in atmospheric convection is directly responsible for powering destructive storms such as tropical cyclones and severe thunderstorms. Water vapor is also the most potent greenhouse gas owing to the presence of the hydroxyl bond which strongly absorbs in the infra-red region of the light spectrum.
Carbon dioxide - (chemical formula CO2) is a naturally occurring chemical compound composed of two oxygen atoms covalently bonded to a single carbon atom. It is a gas at standard temperature and pressure and exists in Earth's atmosphere in this state, as a trace gas at a concentration of 0.039 per cent by volume.
The environmental effects of carbon dioxide are of significant interest. Carbon dioxide is an important greenhouse gas, potentially warming the Earth's surface to a higher temperature by reducing outward radiation. Atmospheric carbon dioxide is the primary source of carbon in life on Earth and its concentration in Earth's pre-industrial atmosphere since late in the Precambrian eon was regulated by photosynthetic organisms.
Land use - land-use change and forestry (LULUCF) is defined by the United Nations Climate Change Secretariat as "A greenhouse gas inventory sector that covers emissions and removals of greenhouse gases resulting from direct human-induced land use, land-use change and forestry activities."
Land-use change can be a factor in CO2 (carbon dioxide) atmospheric concentration, and is thus a contributor to climate change. IPCC estimates that land-use change (e.g. conversion of forest into agricultural land) contributes a net 1.6 ± 0.8 Gt carbon per year to the atmosphere. For comparison, the major source of CO2, namely emissions from fossil fuel combustion and cement production amount to 6.3 ± 0.6 Gt carbon per year.
Albedo - or reflection coefficient, is the diffuse reflectivity or reflecting power of a surface. It is defined as the ratio of reflected radiation from the surface to incident radiation upon it. Being a dimensionless fraction, it may also be expressed as a percentage, and is measured on a scale from zero for no reflecting power of a perfectly black surface, to 1 for perfect reflection of a white surface.
Cimate change feedbackl - The climate system includes a range of feedbacks which alter the response of the system to changes in external forcings. Positive feedbacks increase the response of the climate system to an initial forcing, while negative feedbacks reduce the response of the climate system to an initial forcing.
___________________________________________________________
IPCC
IPCC Publications
Climate Research Unit
GISS NASA
NOAA
Climate Commision
PIK
Climate Explorer
Wood for trees
Clear Climate Code
Paleoclimatology -
Paleoclimatology - is the study of changes in climate taken on the scale of the entire history of Earth. It uses a variety of proxy methods from the Earth and life sciences to obtain data previously preserved within (e.g.) rocks, sediments, ice sheets, tree rings, corals, shells and microfossils; it then uses these records to determine the past states of the Earth's various climate regions and its atmospheric system.
Proxy(climate) - In the study of past climates, known as paleoclimatology, climate proxies are preserved physical characteristics of the past that stand in for direct measurements (as statistical proxies), to enable scientists to reconstruct the climatic conditions that prevailed during much of the Earth's history.
Ice core - is a core sample that is typically removed from an ice sheet, most commonly from the polar ice caps of Antarctica, Greenland or from high mountain glaciers elsewhere. ce cores contain an abundance of information about climate. Inclusions in the snow of each year remain in the ice, such as wind-blown dust, ash, bubbles of atmospheric gas and radioactive substances. The variety of climatic proxies is greater than in any other natural recorder of climate, such as tree rings or sediment layers.
Dendroclimatology - is the science of determining past climates from trees (primarily properties of the annual tree rings). Tree rings are wider when conditions favor growth, narrower when times are difficult. Other properties of the annual rings, such as maximum latewood density (MXD) have been shown to be better proxies than simple ring width. Using tree rings, scientists have estimated many local climates for hundreds to thousands of years previous. By combining multiple tree-ring studies (sometimes with other climate proxy records), scientists have estimated past regional and global climates.
___________________________________
Climate Models & Observations
Global climate model - or general circulation model (GCM) is a mathematical model of the general circulation of a planetary atmosphere or ocean and based on the Navier–Stokes equations on a rotating sphere with thermodynamic terms for various energy sources (radiation, latent heat). These equations are the basis for complex computer programs commonly used for simulating the atmosphere or ocean of the Earth.
Atmospheric and oceanic GCMs (AGCM and OGCM) are key components of global climate models along with sea ice and land-surface components. GCMs and global climate models are widely applied for weather forecasting, understanding the climate, and projecting climate change. Versions designed for decade to century time scale climate applications were originally created by Syukuro Manabe and Kirk Bryan at the Geophysical Fluid Dynamics Laboratory in Princeton, New Jersey.[1] These computationally intensive numerical models are based on the integration of a variety of fluid dynamical, chemical, and sometimes biological equations.
Instrumental temperature record - shows fluctuations of the temperature of the global land surface and oceans. This data is collected from several thousand meteorological stations, Antarctic research stations and satellite observations of sea-surface temperature. The longest-running temperature record is the Central England temperature data series, that starts in 1659. The longest-running quasi-global record starts in 1850.
Temperature - of a body is a quantity which indicates how hot or cold the body is. It is a measure of the thermal energy per particle of matter or radiation; it is measured by a thermometer, which may be calibrated in any of various temperature scales, Celsius, Fahrenheit, Kelvin, etc.
Temperature is an intensive property, which means it is independent of the amount of material present; in contrast to energy, an extensive property, which is proportional to the amount of material in the system. For example, a lightening bolt can heat a small portion of the atmosphere hotter than the surface of the sun.
__________________________________________________________________
GISTEMP
HadCRUT
NODC NOAA
NSIDC Sea Ice
PIOMAS
IOC Sea Level
__________________________________________________________________
- Units
Kelvin
Celsius
Fahrenheit
(Kilo)Joule
Watt
Lapse rate
Salinity
Adiabatic process
Mean
Average
Median
Anomaly
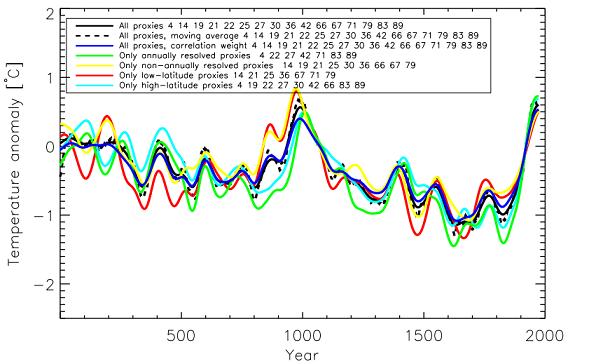
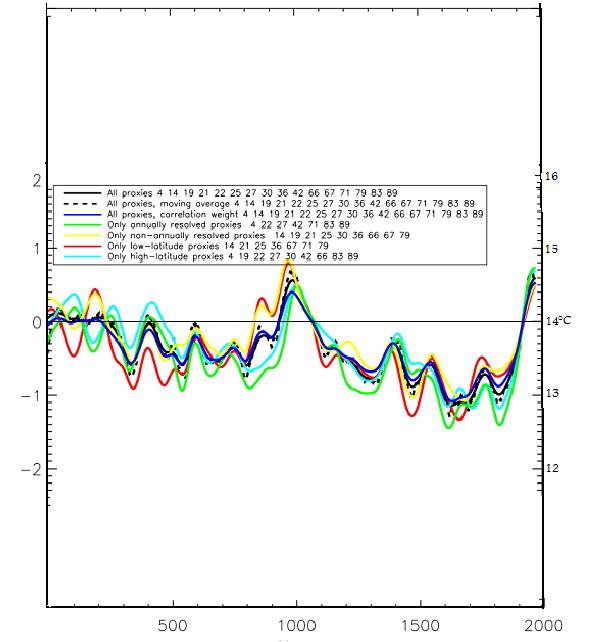
Chartjunk -
Note: Readers are advised that contents of this section reflect only my personal opinion
Chartjunk - refers to all visual elements in charts and graphs that are not necessary to comprehend the information represented on the graph, or that distract the viewer from this information.
Another kind of chartjunk skews the depiction and makes it difficult to understand the real data being displayed. Examples of this type include items depicted out of scale to one another, noisy backgrounds making comparison between elements difficult in a chart or graph, and 3-D simulations in line and bar charts.
If we rely on visual aids alone to tell us how we should feel about the Earth's changing climate, we are hopelessly at the mercy of those preparing the charts.
As an example five graphs are presented that depict reconstructions for various regions and time periods, with each graph telling a completely different story.
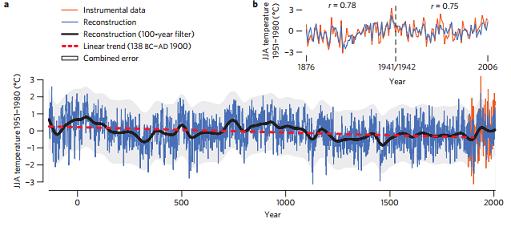
extreme cool and warm summers (blue curve), cool and warm periods on decadal to centennial scales (black curve, 100-year spline filter) and a long-term cooling trend (dashed red curve; linear regression fit to the reconstruction over the 138 BC–AD 1900 period).
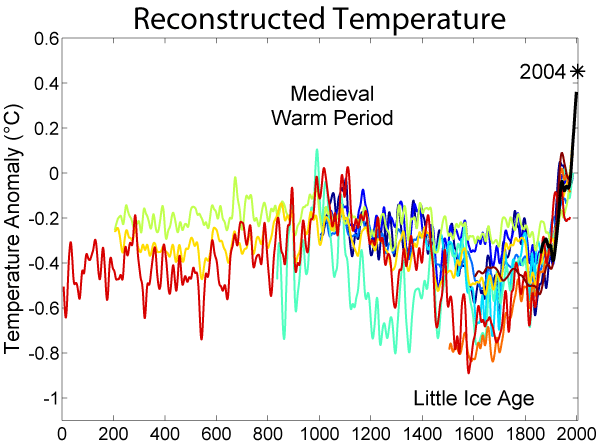
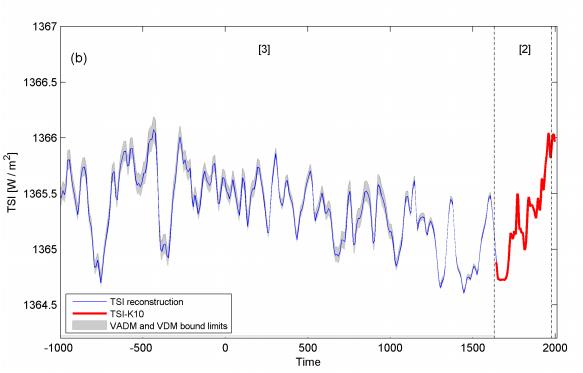
In order to make sense of the information presented, readers are required to study the corresponding literature. We actually need to read the papers, if we are to understand Earth's climate and its changes!
_________________________________________________________
Alternative Research
Climate Audit
Bob Tisdale
Judith Curry
Willis Eschenbach
Dr. Roger Pielke
Lucia's The Blackboard
______________________________________________________
Sho'me the funny
Cartoons by Josh
Hide the Decline
reply to post by talklikeapirat
Your point been?????? If i have to read all of that and follow the links at least give me a clue as to what your on about other than having to read an encyclopedia on the climate!
Your point been?????? If i have to read all of that and follow the links at least give me a clue as to what your on about other than having to read an encyclopedia on the climate!
new topics
-
Las Vegas UFO Spotting Teen Traumatized by Demon Creature in Backyard
Aliens and UFOs: 44 minutes ago -
2024 Pigeon Forge Rod Run - On the Strip (Video made for you)
Automotive Discussion: 1 hours ago -
Gaza Terrorists Attack US Humanitarian Pier During Construction
Middle East Issues: 1 hours ago -
The functionality of boldening and italics is clunky and no post char limit warning?
ATS Freshman's Forum: 3 hours ago -
Meadows, Giuliani Among 11 Indicted in Arizona in Latest 2020 Election Subversion Case
Mainstream News: 3 hours ago -
Massachusetts Drag Queen Leads Young Kids in Free Palestine Chant
Social Issues and Civil Unrest: 3 hours ago -
Weinstein's conviction overturned
Mainstream News: 5 hours ago -
Supreme Court Oral Arguments 4.25.2024 - Are PRESIDENTS IMMUNE From Later Being Prosecuted.
Above Politics: 6 hours ago -
Krystalnacht on today's most elite Universities?
Social Issues and Civil Unrest: 6 hours ago -
Chris Christie Wishes Death Upon Trump and Ramaswamy
Politicians & People: 7 hours ago
top topics
-
Krystalnacht on today's most elite Universities?
Social Issues and Civil Unrest: 6 hours ago, 8 flags -
Weinstein's conviction overturned
Mainstream News: 5 hours ago, 6 flags -
University of Texas Instantly Shuts Down Anti Israel Protests
Education and Media: 9 hours ago, 6 flags -
Supreme Court Oral Arguments 4.25.2024 - Are PRESIDENTS IMMUNE From Later Being Prosecuted.
Above Politics: 6 hours ago, 5 flags -
Massachusetts Drag Queen Leads Young Kids in Free Palestine Chant
Social Issues and Civil Unrest: 3 hours ago, 4 flags -
Meadows, Giuliani Among 11 Indicted in Arizona in Latest 2020 Election Subversion Case
Mainstream News: 3 hours ago, 4 flags -
Chris Christie Wishes Death Upon Trump and Ramaswamy
Politicians & People: 7 hours ago, 2 flags -
Any one suspicious of fever promotions events, major investor Goldman Sachs card only.
The Gray Area: 11 hours ago, 2 flags -
Gaza Terrorists Attack US Humanitarian Pier During Construction
Middle East Issues: 1 hours ago, 2 flags -
2024 Pigeon Forge Rod Run - On the Strip (Video made for you)
Automotive Discussion: 1 hours ago, 1 flags
active topics
-
University of Texas Instantly Shuts Down Anti Israel Protests
Education and Media • 190 • : Consvoli -
Supreme Court Oral Arguments 4.25.2024 - Are PRESIDENTS IMMUNE From Later Being Prosecuted.
Above Politics • 62 • : WeMustCare -
Las Vegas UFO Spotting Teen Traumatized by Demon Creature in Backyard
Aliens and UFOs • 5 • : FlyersFan -
Thousands Of Young Ukrainian Men Trying To Flee The Country To Avoid Conscription And The War
Other Current Events • 139 • : Consvoli -
Is there a hole at the North Pole?
ATS Skunk Works • 39 • : Athetos -
Candidate TRUMP Now Has Crazy Judge JUAN MERCHAN After Him - The Stormy Daniels Hush-Money Case.
Political Conspiracies • 786 • : Annee -
The functionality of boldening and italics is clunky and no post char limit warning?
ATS Freshman's Forum • 11 • : JonnyC555 -
Nearly 70% Of Americans Want Talks To End War In Ukraine
Political Issues • 89 • : Xtrozero -
Gaza Terrorists Attack US Humanitarian Pier During Construction
Middle East Issues • 19 • : Consvoli -
Sunak spinning the sickness figures
Other Current Events • 21 • : Xtrozero
3