It looks like you're using an Ad Blocker.
Please white-list or disable AboveTopSecret.com in your ad-blocking tool.
Thank you.
Some features of ATS will be disabled while you continue to use an ad-blocker.

Is another Mag 8+ due like in 2012?
page: 1share:
We, the citizen scientists of Quake Watch on ATS noted that there was a global slow down in magnitude 5 quakes just before the double mag 8 (8.6/8.2)
off Indonesia last April. It is looking like the same lull in activity is occurring again.
Before anyone who does not know me says I am being sensationalist, I am not. That is not my way. I am asking what others think based on the evidence of last year, and not predicting anything or stating it is about to happen.
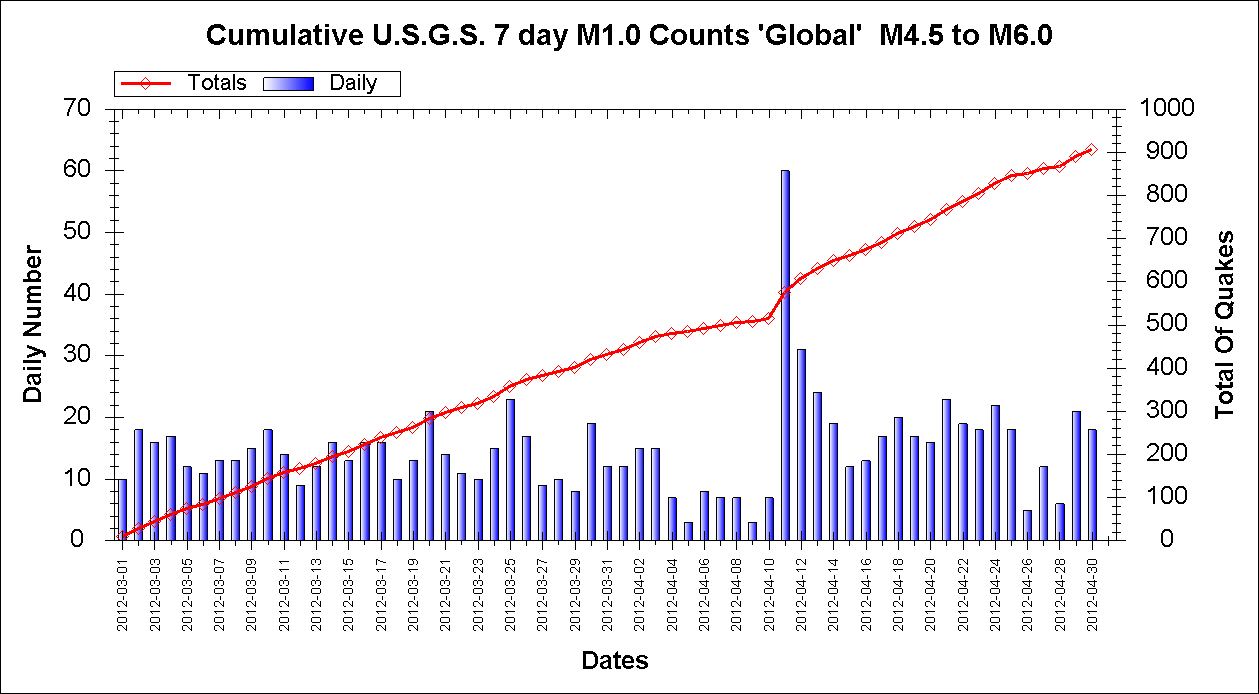
These are the graphs for mag 4.5 to mag 6 world wide during the period 01 March 2012 to 30 April 2012 for counts and energy.
2012 Cumulative Counts. Click to enlarge
2012 Cumulative Energy. Click to enlarge
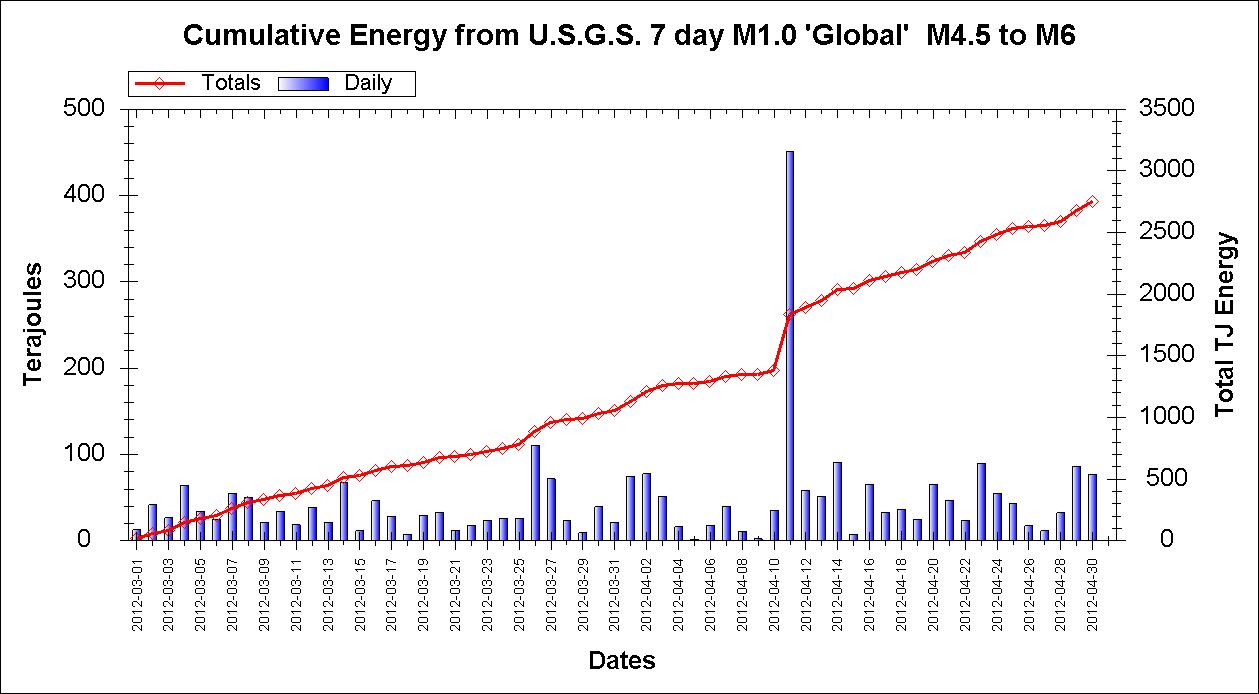
You can clearly see the slowdown right before the double mag 8 quakes. Basically from 04 Apr 2012 to 10 Apr 2012 the global rate of mag 4.5 to 6.0 flattened. The same is visible on the energy graph, but it is not quite as clear.
Now we move to this year
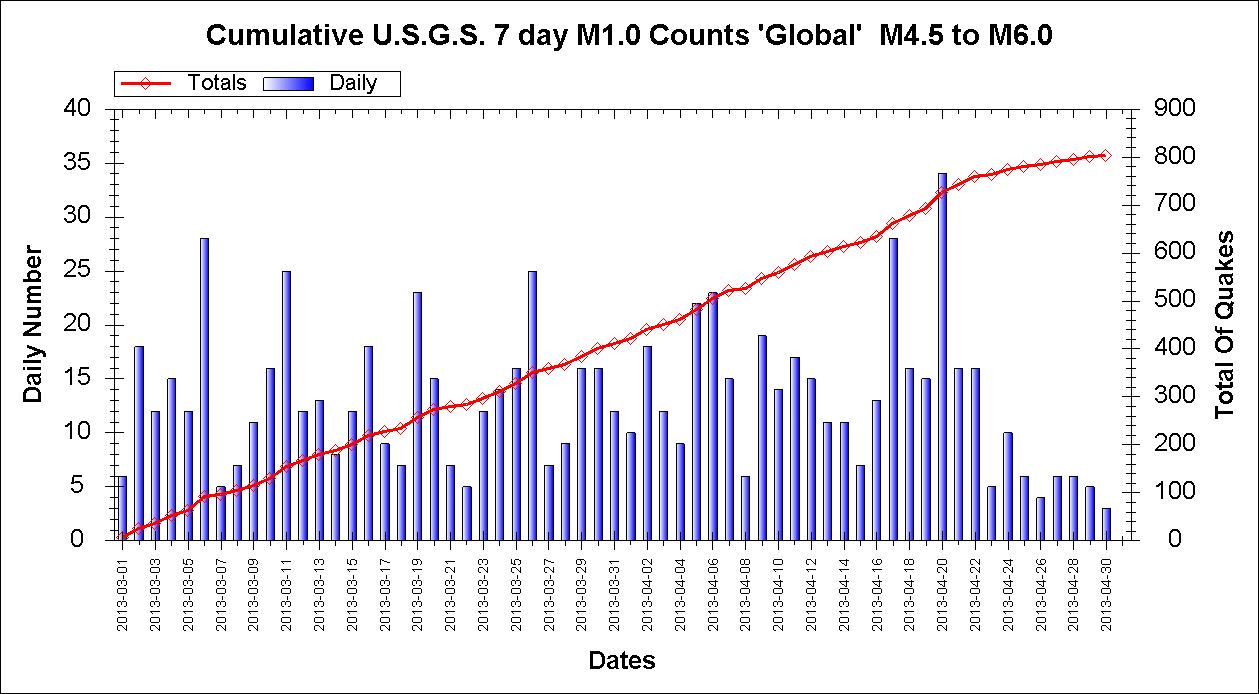
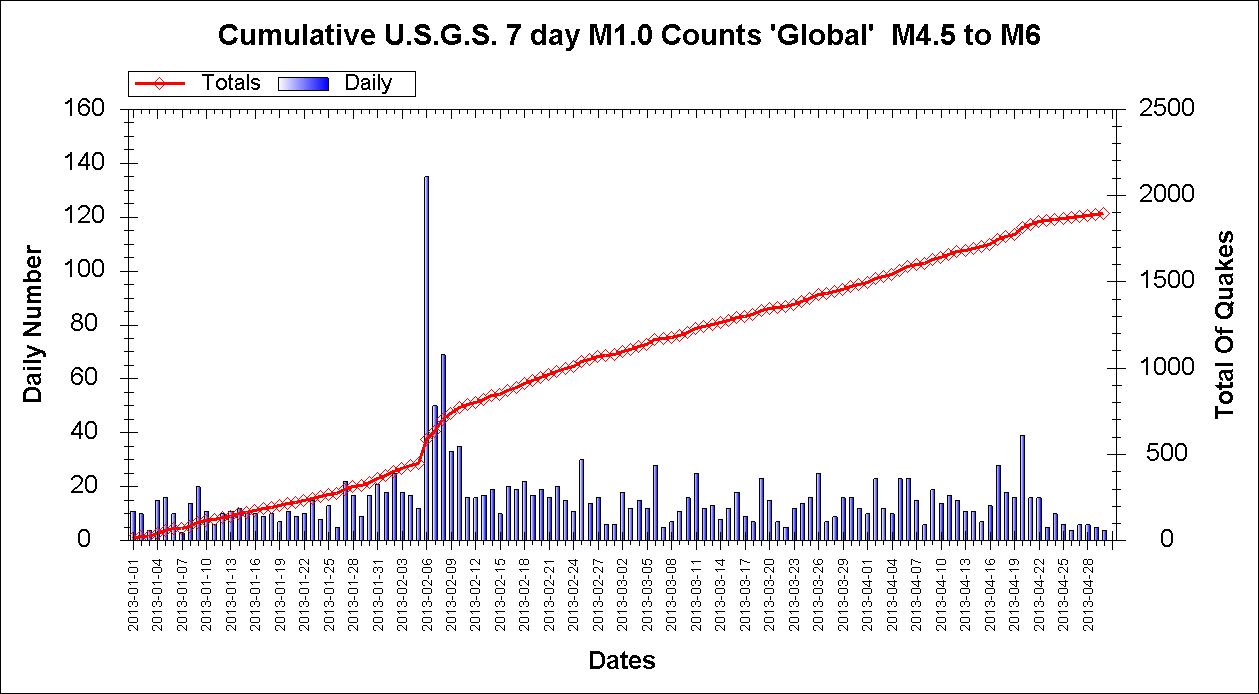
2013 Cumulative Counts. Click to enlarge
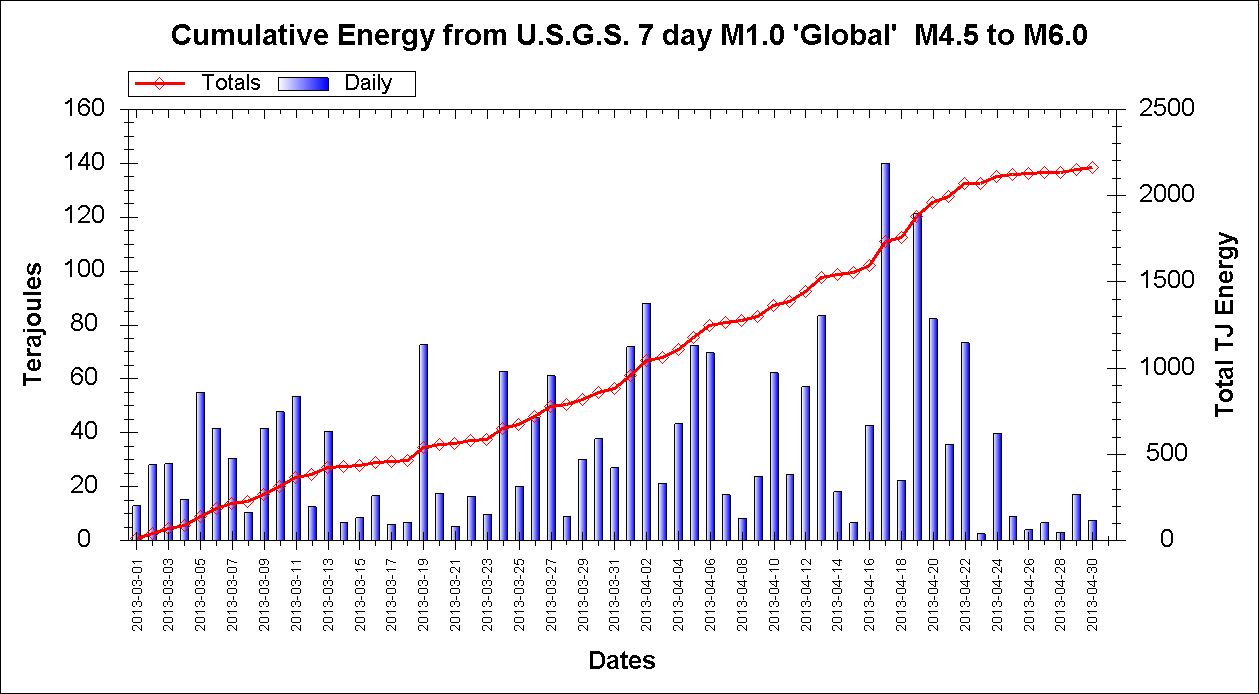
2013 Cumulative Energy. Click to enlarge
You can see the same pattern now in 2013.
Before the Mag 8 this year we can see a similar, but not quite as marked, lull in energy and counts.
01 Jan - 30 Apr 2013 Cumulative Counts. Click to enlarge
01 Jan - 30 Apr 2013 Cumulative Energy. Click to enlarge
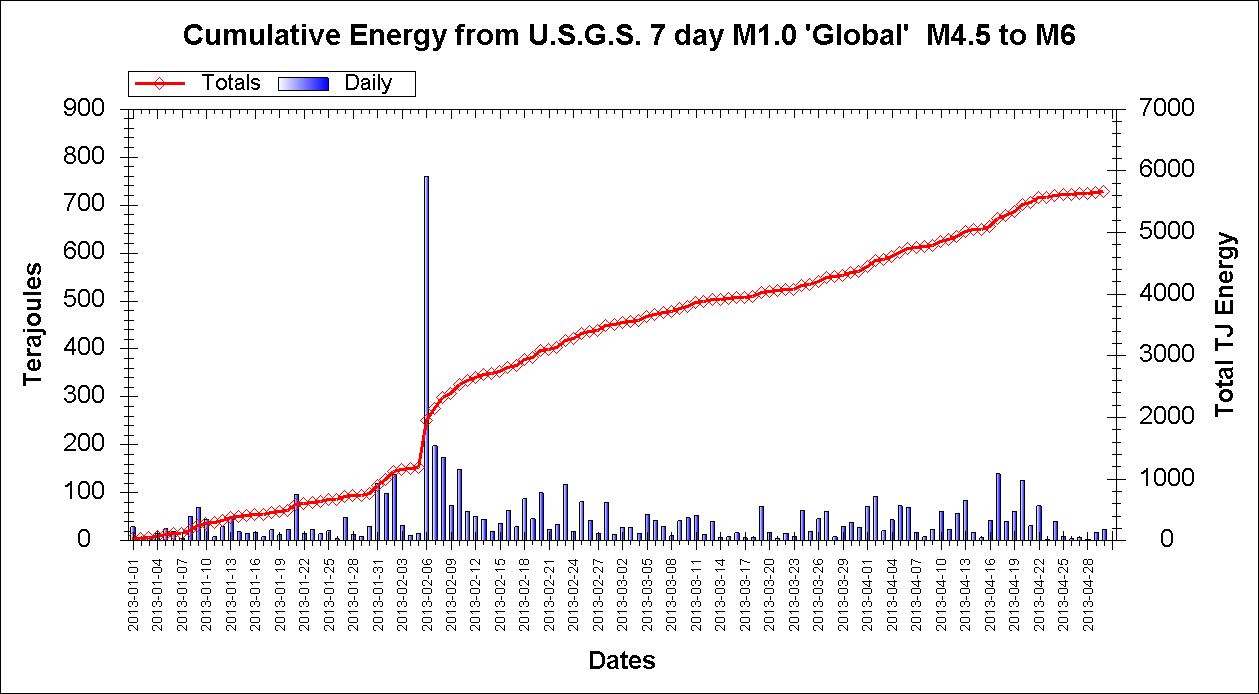
Note the very flat energy curve just before the mag 8.
So, are we due another? My own feeling is no, however I would say that we do not so often see this flattening of the curve and more often than not this precedes a large quake when it does occur. It is possible we could be in for something in the mag 7 range, but not in my opinion a mag 8. If we are then it is likely to be within the next few days.
What do others think?
Before anyone who does not know me says I am being sensationalist, I am not. That is not my way. I am asking what others think based on the evidence of last year, and not predicting anything or stating it is about to happen.
These are the graphs for mag 4.5 to mag 6 world wide during the period 01 March 2012 to 30 April 2012 for counts and energy.
2012 Cumulative Counts. Click to enlarge

2012 Cumulative Energy. Click to enlarge

You can clearly see the slowdown right before the double mag 8 quakes. Basically from 04 Apr 2012 to 10 Apr 2012 the global rate of mag 4.5 to 6.0 flattened. The same is visible on the energy graph, but it is not quite as clear.
Now we move to this year
2013 Cumulative Counts. Click to enlarge

2013 Cumulative Energy. Click to enlarge

You can see the same pattern now in 2013.
Before the Mag 8 this year we can see a similar, but not quite as marked, lull in energy and counts.
01 Jan - 30 Apr 2013 Cumulative Counts. Click to enlarge

01 Jan - 30 Apr 2013 Cumulative Energy. Click to enlarge

Note the very flat energy curve just before the mag 8.
So, are we due another? My own feeling is no, however I would say that we do not so often see this flattening of the curve and more often than not this precedes a large quake when it does occur. It is possible we could be in for something in the mag 7 range, but not in my opinion a mag 8. If we are then it is likely to be within the next few days.
What do others think?
edit on 30/4/2013 by PuterMan because: to fix a tag
reply to post by PuterMan
As always, an interesting thread!
I would be curious to see if this plays out for other notable quakes. Do you plan on stretching out the dates and taking a look for a bigger pattern? (in your spare time. )
As you know, I like to pick up on patterns but am not as nearly scientific about it as you and often can not even explain clearly the pattern I am seeing. However, I have been noticing some odd stuff the past couple of weeks and while I am not predicting anything either, I have been waitin for that dark maroon number to pop up again.
reply to post by westcoast
Amongst the myriad of other things that I take upon myself, yes. I think my weekly geophysical report may have to stretch to monthly even though I have automated quite a bit of it. It is the images that take the time.
I would be curious to see if this plays out for other notable quakes. Do you plan on stretching out the dates and taking a look for a bigger pattern? (in your spare time. )
Amongst the myriad of other things that I take upon myself, yes. I think my weekly geophysical report may have to stretch to monthly even though I have automated quite a bit of it. It is the images that take the time.
I have a feeling the next 8+ quake would be between May 1-May 7 2013.....
reply to post by PuterMan
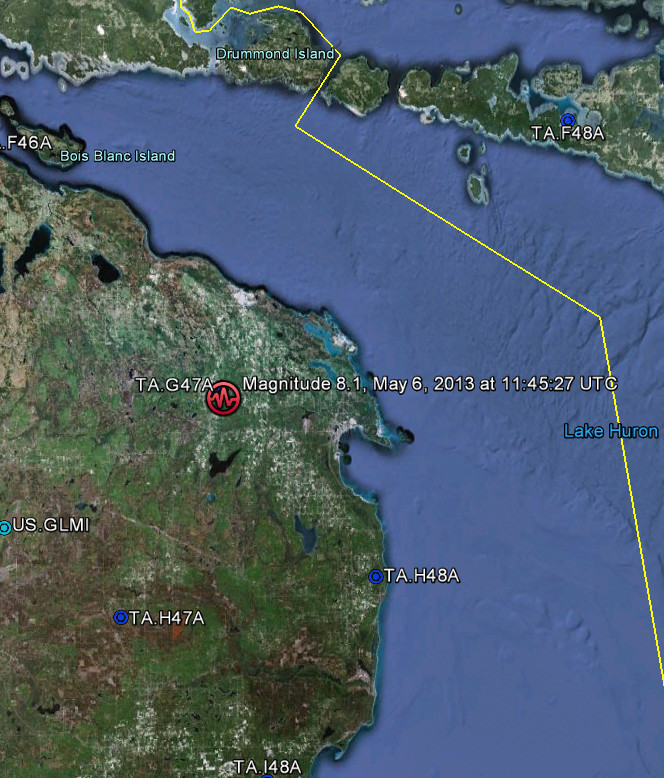
Oh you mean like here?
Magnitude
8.1
Date-Time
Monday, May 6, 2013 at 11:45:27 UTC
Monday, May 6, 2013 at 11:45:27 at epicenter
Time of Earthquake in other Time Zones
Location
45.096791,-83.853149
Depth
10.5 km (6.9 miles)
Region
near Lake Huron
horizontal +/- 3.2 km (1.1 miles); depth +/- 0.2 km (0.0 miles)
Parameters
NST=121, Nph=121, Dmin=128.0km, Rmss=0.68 sec
M-type=teleseismic moment magnitude (Mw), Version=6
Source
uncertain
reply to post by piequal3because14
Now that is very strange. I don't seem to have that one in my lists
Who knows. You may a prophet. We shall see. Combined with the post above then..........
Found it! (NOT just in case anyone is worried)
Now that is very strange. I don't seem to have that one in my lists
Who knows. You may a prophet. We shall see. Combined with the post above then..........
Found it! (NOT just in case anyone is worried)
edit on 30/4/2013 by PuterMan because: (no reason given)
You could be right, but i hope you are wrong.
I noticed the lack of activity around Indonesia the last time, and in this post i said there posible could be some tension building up cause of the lack of activity, it took less than a month after that post, before the 8.1 struck.
www.abovetopsecret.com...
www.abovetopsecret.com...
I havn't been watching for a long time now, so i am not up to date, but will keep a look out on the area
Edit: after taking a peak on my links and rereading your thread , i think i misunderstood, you meant a slow down on global basis and not specific Indonesia, as i noticed there was a few 5.1 yesterday in that area, and i know you wouldn't miss that.
edit on 30-4-2013 by Mianeye because:
(no reason given)
edit on 30-4-2013 by Mianeye because: (no reason given)
reply to post by PuterMan
First to 7.9
Second to 8.0
And third time to 7.6
Oh I guess this one will be revised three times.
I don't seem to have that one in my lists
First to 7.9
Second to 8.0
And third time to 7.6
reply to post by PuterMan
I also hope you're wrong.
I want Aliens....not Earthquakes.
I also hope you're wrong.
I want Aliens....not Earthquakes.
edit on 30-4-2013 by LightAssassin because: (no reason given)
Well,hope I'm wrong. And I hope you are wrong,but with data I don't have access to,California or Nevada.
www.mitp.ru...
www.mitp.ru...
edit on 30-4-2013 by kdog1982 because: (no reason given)
reply to post by kdog1982
Hi kdog. Yes I have tried contacting those guys with no success. It would be great to get access but perhaps they don't want people seeing their errors?
I have to say IF it was California then it would not be a mag 8 almost certainly.
ETA: By the way M8 on that site is the algorithm and not the magnitude.
edit on 30/4/2013 by PuterMan because: (no reason given)
Originally posted by PuterMan
reply to post by kdog1982
Hi kdog. Yes I have tried contacting those guys with no success. It would be great to get access but perhaps they don't want people seeing their errors?
I have to say IF it was California then it would not be a mag 8 almost certainly.
ETA: By the way M8 on that site is the algorithm and not the magnitude.edit on 30/4/2013 by PuterMan because: (no reason given)
Yes,I know what the M8 is,but thanks for pointing it out.
After playing around there for awhile,I have a question.
When was the last big one in Afghanistan?There numbers where pretty high for that area,although I do not know how old the data is.
reply to post by kdog1982
Yup, my apologies I should have said - For everyone's benefit.......
Back to 2009 I have these
The Beta search on USGS gives these since 1973
earthquake.usgs.gov...
Yup, my apologies I should have said - For everyone's benefit.......
Back to 2009 I have these
Prov,Date/Time UTC,Latitude,Longitude,Magnitude,Depth(Km),Location
usgs,2010-09-17 19:21:15, 36.438, 70.787, 6.2, 220.4, Hindu Kush Region. Afghanistan
usgs,2009-10-29 17:44:31, 36.434, 70.730, 6.2, 205.6, Hindu Kush Region. Afghanistan
usgs,2009-10-22 19:51:28, 36.471, 70.925, 6.2, 196.5, Hindu Kush Region. Afghanistan
The Beta search on USGS gives these since 1973
DATE_TIME LAT LON DEP MAG MT SC
--------------------------------------------------------------------------
2010-09-17 19:21:15.01 36.443 70.774 220.1 6.3 mwb pde
2009-10-29 17:44:32.06 36.391 70.722 210.0 6.2 mwc pde
2009-10-22 19:51:27.52 36.517 70.950 185.9 6.2 mwb pde
2009-01-03 20:23:20.18 36.419 70.743 204.8 6.6 mwc pde
2008-10-29 11:32:43.13 30.598 67.455 14.0 6.4 mwc pde
2008-10-28 23:09:57.65 30.639 67.351 15.0 6.4 mwc pde
2008-10-05 22:56:28.93 33.886 69.470 10.0 6.0 mwc pde
2007-04-03 03:35:07.28 36.451 70.688 222.1 6.2 mwb pde
2005-12-12 21:47:46.07 36.357 71.093 224.6 6.5 mwb pde
2004-08-10 01:47:32.81 36.444 70.796 207.0 6.0 mwb pde
2004-04-05 21:24:04.00 36.512 71.029 187.1 6.6 mwb pde
2002-03-25 14:56:33.82 36.062 69.315 8.0 6.1 mwc pde
2002-03-03 12:08:19.74 36.502 70.482 225.6 7.4 mwc pde
2002-03-03 12:08:07.81 36.429 70.438 209.0 6.3 mb pde
2002-01-03 07:05:27.67 36.088 70.687 129.3 6.2 mwb pde
2001-11-23 20:43:03.55 36.392 71.506 106.5 6.1 mwc pde
2001-02-25 02:21:59.59 36.424 70.881 202.5 6.2 mwb pde
2000-07-17 22:53:47.30 36.283 70.924 141.4 6.3 mwc pde
2000-05-12 23:10:29.98 35.975 70.657 107.7 6.3 mwc pde
2000-01-19 07:09:33.58 36.372 70.379 206.9 6.0 mwb pde
1999-11-08 16:45:43.02 36.522 71.240 228.4 6.5 mwc pde
1999-02-11 14:08:51.68 34.259 69.364 33.0 6.0 mwc pde
1998-02-20 12:18:06.23 36.479 71.086 235.6 6.4 mwb pde
1997-12-17 05:51:29.22 36.387 70.773 207.0 6.3 mwc pde
1997-05-13 14:13:45.74 36.411 70.945 196.0 6.5 mwb pde
1997-02-27 21:30:36.57 29.985 67.977 33.0 6.0 mb pde
1997-02-27 21:08:02.36 29.976 68.208 33.0 7.1 mwc pde
1995-10-18 09:30:38.50 36.430 70.387 222.7 6.3 mwb pde
1994-10-25 00:54:34.30 36.359 70.957 238.7 6.0 mwb pde
1994-06-30 09:23:21.35 36.326 71.130 226.6 6.3 mwb pde
1994-05-01 12:00:35.76 36.901 67.163 18.5 6.1 mwb pde
1993-09-18 05:02:27.01 36.421 71.592 112.6 6.3 mwb pde
1993-09-04 11:38:38.93 36.429 70.812 194.5 6.0 mw pde
1993-08-09 12:42:48.19 36.379 70.868 214.5 7.0 mwb pde
1993-08-09 11:38:30.53 36.436 70.711 204.2 6.4 mwb pde
1992-05-20 12:20:32.85 33.377 71.317 16.3 6.3 mwb pde
1991-07-14 09:09:11.91 36.334 71.119 212.9 6.7 mw pde
1991-01-31 23:03:33.67 35.993 70.423 142.4 6.9 mw pde
1990-07-13 14:20:43.47 36.415 70.789 216.8 6.4 mw pde
1990-05-15 14:25:20.69 36.043 70.428 113.1 6.0 mw pde
1989-07-24 03:27:48.77 36.085 71.069 95.1 6.0 mw pde
1988-08-06 09:03:21.95 36.461 71.043 195.0 6.3 mw pde
1987-10-03 11:00:05.29 36.454 71.437 95.4 6.1 mw pde
1987-08-10 10:52:19.94 29.867 63.840 164.5 6.1 mw pde
1987-05-05 15:40:47.52 36.480 70.673 202.1 6.2 mw pde
1985-08-02 07:46:53.30 36.174 70.780 120.1 6.4 mw pde
1985-07-29 07:54:44.07 36.190 70.896 98.7 7.4 mw pde
1984-02-16 17:18:41.61 36.431 70.826 207.6 6.4 mw pde
1984-02-01 14:22:07.90 34.616 70.484 33.0 6.1 mw pde
1984-01-27 13:01:40.28 36.390 71.034 171.8 6.1 mw pde
1983-12-30 23:52:39.93 36.372 70.738 214.5 7.4 mw pde
1983-09-12 15:42:08.55 36.502 71.082 208.8 6.2 mw pde
1982-12-16 00:40:48.72 36.148 69.011 36.0 6.6 ms pde
1981-05-02 16:04:55.60 36.355 71.085 228.7 6.3 mb pde
1979-08-20 03:50:52.20 36.479 70.134 229.0 6.1 mb pde
1976-11-27 21:42:12.20 36.507 71.042 190.0 6.1 mb pde
1975-10-03 17:31:35.80 30.413 66.350 33.0 6.4 ms pde
1975-10-03 05:14:23.30 30.251 66.315 11.0 6.7 ms pde
1974-07-30 05:12:40.60 36.353 70.763 211.0 6.5 mb pde
earthquake.usgs.gov...
edit on 30/4/2013 by PuterMan because: (no reason given)
addendum to post by PuterMan
Weeding that out a bit the mag 7+ are:
Link as above
Weeding that out a bit the mag 7+ are:
DATE_TIME LAT LON DEP MAG MT SC
--------------------------------------------------------------------------
2002-03-03 12:08:19.74 36.502 70.482 225.6 7.4 mwc pde
1997-02-27 21:08:02.36 29.976 68.208 33.0 7.1 mwc pde
1993-08-09 12:42:48.19 36.379 70.868 214.5 7.0 mwb pde
1985-07-29 07:54:44.07 36.190 70.896 98.7 7.4 mw pde
1983-12-30 23:52:39.93 36.372 70.738 214.5 7.4 mw pde
Link as above
Nice thread Puterman, as always.
You probably know what I am going to say
The only quadrant of the circle of fire that has not seen some decent stress release is the North Eastern section, ie, West Coast USA. That zone has to go off soon. I just hope the quake stays away from the major cities.
There has been no quake as yet to balance what the Japanese Quake did. To put it very simplistically, if Japan moves however far it did, then the whole plate has to move eventually to compensate.
Scary thought and since it's you as the OP, bloody scary thread.
P
reply to post by pheonix358
You also know that I too agree with you about Cascadia.
This may just pass through with no notable effect, but if it does not then we need to look at previous patterns such as this - I need to do that anyway.
You also know that I too agree with you about Cascadia.
This may just pass through with no notable effect, but if it does not then we need to look at previous patterns such as this - I need to do that anyway.
reply to post by PuterMan
Yes I agree! There is a vast difference between a prediction based on say dreams and a prediction based on science and measurable solid data.
The problem for humanity is understanding time as we see it and time as Mother Nature sees it. We think in terms of short term, Mother Nature has a longer term idea of time.
The problem I have is that the longer Cascadia and associated faults wait, the more potent the quake will be. There has been little meaningful relief in this area for a long time as humans view it.
It WILL happen. That is a scientific certainty. The question is when. It seems to me that there has been an uptick in Government preparedness in the past several years. Perhaps they know something we don't. They certainly would not warn anyone if they did know.
P
P
edit on 30/4/2013 by pheonix358 because: (no reason given)
There will definitely be no more earthquakes in 2012.
There might be a mag 8 in 2013
There might be a mag 8 in 2013
I think you may be right about a bigger quake in the near future. There are patterns to these quakes, we just haven't been able to pin down the
pattern. I think as there is something with the earth's locked alignment with the North star area that makes stress on the earth at the spring and
fall equinox times. In the fall here in the north it causes hurricanes, in the spring here in the north it causes tornadoes and earthquakes. It has
to do with the gradual pull and push of the sun on the earth as it crosses the equator. The tilt buffers it a little spreading it out as the earth
turns though. If the earth wasn't tilted it would be more aggressive, but then again the forces wouldn't be there. I am sure the moon position
also has something to do with this sometimes to. There are a lot of things connected with this, piecing this together is the hard part.
What you say about a reduction of 5 plus events can possibly be a way of telling of an increased chance. It may not be completely accurate but may be a warning sign of increased probability. That in itself is worth it.
What you say about a reduction of 5 plus events can possibly be a way of telling of an increased chance. It may not be completely accurate but may be a warning sign of increased probability. That in itself is worth it.
reply to post by Theflyingweldsman
Can you prove that?
Technically speaking it is possible that they still might at this stage add earthquakes to the lists - in fact anything up to 2 years.
What I actually said in the title was
Is another Mag 8+ due like in 2012
Agreed not the best constructed headline and I even did a double take myself after I posted it.
new topics
-
Israeli Missile Strikes in Iran, Explosions in Syria + Iraq
World War Three: 3 minutes ago -
George Knapp AMA on DI
Area 51 and other Facilities: 5 hours ago -
Not Aliens but a Nazi Occult Inspired and then Science Rendered Design.
Aliens and UFOs: 5 hours ago -
Louisiana Lawmakers Seek to Limit Public Access to Government Records
Political Issues: 8 hours ago -
The Tories may be wiped out after the Election - Serves them Right
Regional Politics: 9 hours ago -
So I saw about 30 UFOs in formation last night.
Aliens and UFOs: 11 hours ago
top topics
-
BREAKING: O’Keefe Media Uncovers who is really running the White House
US Political Madness: 12 hours ago, 25 flags -
George Knapp AMA on DI
Area 51 and other Facilities: 5 hours ago, 19 flags -
Biden--My Uncle Was Eaten By Cannibals
US Political Madness: 13 hours ago, 18 flags -
"We're All Hamas" Heard at Columbia University Protests
Social Issues and Civil Unrest: 13 hours ago, 7 flags -
Louisiana Lawmakers Seek to Limit Public Access to Government Records
Political Issues: 8 hours ago, 7 flags -
Russian intelligence officer: explosions at defense factories in the USA and Wales may be sabotage
Weaponry: 17 hours ago, 6 flags -
So I saw about 30 UFOs in formation last night.
Aliens and UFOs: 11 hours ago, 5 flags -
The Tories may be wiped out after the Election - Serves them Right
Regional Politics: 9 hours ago, 3 flags -
Do we live in a simulation similar to The Matrix 1999?
ATS Skunk Works: 12 hours ago, 3 flags -
Not Aliens but a Nazi Occult Inspired and then Science Rendered Design.
Aliens and UFOs: 5 hours ago, 3 flags
active topics
-
MULTIPLE SKYMASTER MESSAGES GOING OUT
World War Three • 35 • : Zaphod58 -
Israeli Missile Strikes in Iran, Explosions in Syria + Iraq
World War Three • 0 • : FamCore -
Candidate TRUMP Now Has Crazy Judge JUAN MERCHAN After Him - The Stormy Daniels Hush-Money Case.
Political Conspiracies • 386 • : WeMustCare -
British TV Presenter Refuses To Use Guest's Preferred Pronouns
Education and Media • 61 • : nugget1 -
-@TH3WH17ERABB17- -Q- ---TIME TO SHOW THE WORLD--- -Part- --44--
Dissecting Disinformation • 535 • : cherokeetroy -
African "Newcomers" Tell NYC They Don't Like the Free Food or Shelter They've Been Given
Social Issues and Civil Unrest • 15 • : marg6043 -
Alabama Man Detonated Explosive Device Outside of the State Attorney General’s Office
Social Issues and Civil Unrest • 58 • : Unknownparadox -
BREAKING: O’Keefe Media Uncovers who is really running the White House
US Political Madness • 13 • : WeMustCare -
"We're All Hamas" Heard at Columbia University Protests
Social Issues and Civil Unrest • 127 • : marg6043 -
Two Serious Crimes Committed by President JOE BIDEN that are Easy to Impeach Him For.
US Political Madness • 16 • : WeMustCare