It looks like you're using an Ad Blocker.
Please white-list or disable AboveTopSecret.com in your ad-blocking tool.
Thank you.
Some features of ATS will be disabled while you continue to use an ad-blocker.

The Reality of Global Warming.
page: 117
share:
Level 2 Project: Global Warming, Fact or Fiction?
Introduction:
Welcome to the ATS research project concerning global warming. We've all heard the term before, but the facts are often mired in very polarized opinion. One thing is certain, however, and that is the fact that global warming effects everyone. We only have this one planet to live upon, and while concern about the environment is usually low on the priority list, the results of global warming will be rather permanent and very detrimental to our continued well being on this earth. Is there anything we can do? Is there any reason for concern? This project will be focused on uncovering the truth about global warming and presenting information about the delicate balance of life on this, our home.
Project Goal:
The goals of this project are very expansive, covering the history of climate change, in depth research as to how the Earth is a self-regulating biosphere, how that balance has been upset in times past, and including the effects humankind has had on this planet within the past 100 years. The ultimate goal will be to determine the plausibility of the survival of humankind during extreme weather conditions, and at the end of their research, each team member will be required to give a short opinionated forecast based on the information presented, in order to complete this project.
My personal goals will be to research the HAARP, industrial pollution, and to take a look at the politics involved with global warming. I've assembled a team of top-notch ATS members, and together we'll be addressing issues related to the reality of global warming.
Research Participants and their Goals:
vkey08
Participant Goal:
The goal of this participant is to research the history of climate change, including glacial-interglacial periods relating to levels of atmospheric CO2. Also addressed will be current climate trends, and the monitoring of global environmental conditions with the advent of modern technology.
sheepslayer247
Participant Goal:
The goal of this participant will be to study the environmental impacts of global warming, to include information about the receding Artic Ice Sheet. Deforestation and it's relationship to the environment will be part of their goal.
74Templar
Participant Goal:
The goal of this participant will be to research recent and current weather anomalies, the actual effects of global warming on human populations, including aspects of survivability and water supplies, and regions where environmental changes have the most impact.
Sublimecraft
Participant Goal:
The goal of this participant will be to explain the Greenhouse Effect, and it's differentiation from Global Warming. In-depth research will include the Carbon Cycle, Oceanic Climates, Atmospheric Circulation, and Ocean Salinity Levels. The participant will be addressing all meteorological aspects of global warming.
daaskapital
Participant Goal:
The goal of this participant will be to address the politics behind Global Warming, and to present information concerning governmental regulations across the globe. Goals will be to include aspects of lobbying, corporate circumvention of regulations, countries who don't adhere to UN standards, and why corporate greed inhibits the enaction of strict environmental protections.
Thank you to all who take the time to read this Research Project.
edit on 13/2/13 by davespanners because: Added
daaskapital
edit on 13-2-2013 by ADVISOR because: it was requested to bold text
A big thank you first and foremost must go to our project leader Druid42, my fellow team members, and of course our four remarkable Moderators,
Rising Against, ADVISOR, Sauron and Davespanners, for the opportunity to participate and hopefully rejuvenate this long dormant forum.
No matter which way we word it, no matter how we discuss it, the changes affecting our little blue planet spell out one simple fact to all the people of this world.
The world is changing.
Perhaps faster than we, as humans, are capable of reigning back in, or ever hope to control. Every day of each passing year we are confronted with the increasing ferocity and sheer destructive power Mother Nature has over us. And each year it seems to be getting worse. In this study, I will propose to delve into the ever changing and anomalous weather patterns that seem to be sweeping the globe, and asking the inevitable questions that come out of such a study.
Are we as industrial beings responsible for the extreme weather? Can we do anything to change our weird weather? Will it continue to get worse? Or is this just a cycle the Earth has followed for centuries if not millennia that we are now, as a species, caught up in?
In this report I will cover much of the unseasonal weather across the world, including the harsh flooding being experienced across many developed countries, the extreme cold snaps affecting many northern and even southern countries, the extreme droughts that have plagued many agricultural nations, and of course the ever-worsening hurricane and cyclone events that are now venturing into new and unprepared areas with more and more intensity each year.
I will also discuss the eventuality of what kind of effect these extreme weather events will have on our ever growing and largely urban populations, studying the effect and subsequent crisis as the world’s fresh water supply dries up, and what it will mean for the 80% of the world’s population that live on the world’s coastlines.
Lastly, I will look to the future of our world of extreme weather, and just what we, as a race, can do to combat the weather and the relentless push of Nature, and whether such a task is even possible. I will delve into the human element of what happens when parts of the world are submerged or wiped out due to natural disasters, and if indeed the Earth can sustain a population as large as we currently have in a world with both extreme weather and ever more limited resources.
Without further ado, I present part one of my report.
[color=DarkOrange3]
Growing up as a kid in southern Australia, there were always times of the year that came with a certain guarantee. Summery, warm to hot days were always around Christmas and the end of year school holidays, leading into the cooler and often rainier Autumn months of April/May.
Winter would be cold and wet, and would generally persist until around September/October when we would have a few humid days, along with a few storms, as the seasons once again aligned themselves. This was followed by endless days of clear sunshine, albeit very cold and clear nights as we gradually led back into the warmth of the summer months.
Heatwaves were very rare, lasting only a few days, and stormy summer weather was considered a exceptional event, in fact, to wake to humid and rainy skies during January/February was a very odd and uncommon sight, something my parents would label ‘damn Queensland’ weather.
As a keen study of the effects of meteorology over the years, I have deduced one simple little fact.
The seasons are out of alignment.
Cold days in Summer, extreme heatwaves in between, unseasonal rain and flooding, warm clear days in the dead of Winter, thunderstorms and humidity in the oddest of times. Yes indeed, the weather certainly seems to have itself confused with the regular seasons in recent years, and each year we seem to be breaking new records across the world, with more prolonged and severe heat, cold, rain, drought and even snows than previous years.
So naturally, with our weather out of whack, we begin to ask ourselves the question.
Are we causing this?
(Cont below)
Global warming. Climate change.
No matter which way we word it, no matter how we discuss it, the changes affecting our little blue planet spell out one simple fact to all the people of this world.
The world is changing.
Perhaps faster than we, as humans, are capable of reigning back in, or ever hope to control. Every day of each passing year we are confronted with the increasing ferocity and sheer destructive power Mother Nature has over us. And each year it seems to be getting worse. In this study, I will propose to delve into the ever changing and anomalous weather patterns that seem to be sweeping the globe, and asking the inevitable questions that come out of such a study.
Are we as industrial beings responsible for the extreme weather? Can we do anything to change our weird weather? Will it continue to get worse? Or is this just a cycle the Earth has followed for centuries if not millennia that we are now, as a species, caught up in?
In this report I will cover much of the unseasonal weather across the world, including the harsh flooding being experienced across many developed countries, the extreme cold snaps affecting many northern and even southern countries, the extreme droughts that have plagued many agricultural nations, and of course the ever-worsening hurricane and cyclone events that are now venturing into new and unprepared areas with more and more intensity each year.
I will also discuss the eventuality of what kind of effect these extreme weather events will have on our ever growing and largely urban populations, studying the effect and subsequent crisis as the world’s fresh water supply dries up, and what it will mean for the 80% of the world’s population that live on the world’s coastlines.
Lastly, I will look to the future of our world of extreme weather, and just what we, as a race, can do to combat the weather and the relentless push of Nature, and whether such a task is even possible. I will delve into the human element of what happens when parts of the world are submerged or wiped out due to natural disasters, and if indeed the Earth can sustain a population as large as we currently have in a world with both extreme weather and ever more limited resources.
Without further ado, I present part one of my report.
[color=DarkOrange3]
Strange Days On Planet Earth.
Growing up as a kid in southern Australia, there were always times of the year that came with a certain guarantee. Summery, warm to hot days were always around Christmas and the end of year school holidays, leading into the cooler and often rainier Autumn months of April/May.
Winter would be cold and wet, and would generally persist until around September/October when we would have a few humid days, along with a few storms, as the seasons once again aligned themselves. This was followed by endless days of clear sunshine, albeit very cold and clear nights as we gradually led back into the warmth of the summer months.
Heatwaves were very rare, lasting only a few days, and stormy summer weather was considered a exceptional event, in fact, to wake to humid and rainy skies during January/February was a very odd and uncommon sight, something my parents would label ‘damn Queensland’ weather.
As a keen study of the effects of meteorology over the years, I have deduced one simple little fact.
The seasons are out of alignment.
Cold days in Summer, extreme heatwaves in between, unseasonal rain and flooding, warm clear days in the dead of Winter, thunderstorms and humidity in the oddest of times. Yes indeed, the weather certainly seems to have itself confused with the regular seasons in recent years, and each year we seem to be breaking new records across the world, with more prolonged and severe heat, cold, rain, drought and even snows than previous years.
So naturally, with our weather out of whack, we begin to ask ourselves the question.
Are we causing this?
(Cont below)
For the first time in human history, much of the world has been modernised. There are more vehicles on our roads than ever before, all relying on
fossil fuels to run, all the while emitting noxious greenhouse gases as their by-products. Countries like China, which have traditionally used
motorbikes or even pushbikes in the past, have led the way in the automobile surpassing a billion cars;

Put in perspective, that’s one car for every seven people on the planet! China of course, being one of the fastest developing countries, lead the rise;
Source
We also see the effects of our industrialisation every day. Our major cities are polluted with smog as a result of our industry, our vehicles, and our very way of life.
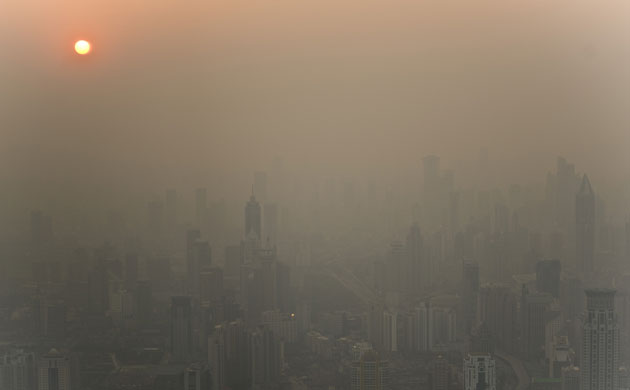
An aerial view of Shanghai, China, showing a thick, enveloping orange smog.
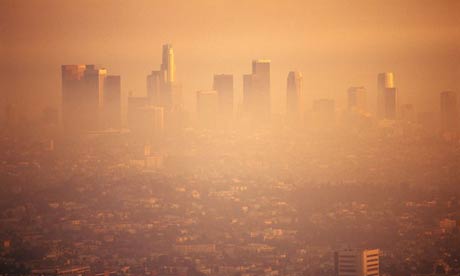
And of course, the sprawling city of Los Angeles, California, coastal home to almost 4 million people, almost invisible under its own cloud of orange smoke.
It’s not hard to see from these pictures alone, just the kind of effect we as humans have had on this fragile planet.
But are we solely to blame for this recent spate of extreme weather? Or are we just a part of the never ending cycle of weather patterns, of which we are only just becoming aware of due to the sudden advancements in technology such as satellites and powerful weather-based computing models?
[color=SkyBlue2]
Over the last five or so decades, these two names have become synonymous with climate change. Everything from droughts to floods, cyclones and generally unpredictable weather has been reputedly the cause and effect of these two sister events. Historically though, they have always been present as shifting systems of weather present across the world, recorded as far back as 1950.
 As this graph shows, there has been a constant shift in weather patterns between the El Niño weather patterns and the La
Niña. The pattern continues on in the next graph, where not surprisingly we have shifted from an almost drought ridden decade in the late 90s/early
00s, to one of extreme wet weather, including cyclones and major flooding throughout the world as the cycle has shifted back to the wetter, more
extreme La Niña pattern.
As this graph shows, there has been a constant shift in weather patterns between the El Niño weather patterns and the La
Niña. The pattern continues on in the next graph, where not surprisingly we have shifted from an almost drought ridden decade in the late 90s/early
00s, to one of extreme wet weather, including cyclones and major flooding throughout the world as the cycle has shifted back to the wetter, more
extreme La Niña pattern. 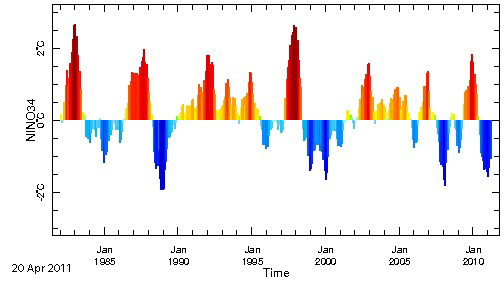
So just what do these two events mean? For both the weather and the general conditions we experience as people?
El Niño
(Cont Below)
The number of cars on the world's roads surpassed one billion last year, according to a study that has spurred debate on what the rapidly-growing car population will mean for the world's economy and environment.
According to a report from Ward’s Auto released last week, the global number of cars exceeded 1.015 billion in 2010, jumping from 980 million the year before.
Put in perspective, that’s one car for every seven people on the planet! China of course, being one of the fastest developing countries, lead the rise;
Not surprisingly, China led the way in vehicle growth, with the number of cars on Chinese roads increasing by 27.5 per cent, amounting to half the entire global growth.
That gives China the world's second largest car population, with 78 million vehicles. But the United States still constitutes by far the largest vehicle population in the world, with 239.8 million cars, the Ward's study reported.
Source
We also see the effects of our industrialisation every day. Our major cities are polluted with smog as a result of our industry, our vehicles, and our very way of life.
An aerial view of Shanghai, China, showing a thick, enveloping orange smog.
And of course, the sprawling city of Los Angeles, California, coastal home to almost 4 million people, almost invisible under its own cloud of orange smoke.
It’s not hard to see from these pictures alone, just the kind of effect we as humans have had on this fragile planet.
But are we solely to blame for this recent spate of extreme weather? Or are we just a part of the never ending cycle of weather patterns, of which we are only just becoming aware of due to the sudden advancements in technology such as satellites and powerful weather-based computing models?
[color=SkyBlue2]
El Niño and La Niña
Over the last five or so decades, these two names have become synonymous with climate change. Everything from droughts to floods, cyclones and generally unpredictable weather has been reputedly the cause and effect of these two sister events. Historically though, they have always been present as shifting systems of weather present across the world, recorded as far back as 1950.
So just what do these two events mean? For both the weather and the general conditions we experience as people?
El Niño
El Niño–Southern Oscillation, or El Niño/La Niña–Southern Oscillation, is a band of anomalously warm ocean water temperatures that occasionally develops off the western coast of South America and can cause climatic changes across the Pacific Ocean. The 'Southern Oscillation' refers to variations in the temperature of the surface of the tropical eastern Pacific Ocean (warming and cooling known as El Niño and La Niña, respectively) and in air surface pressure in the tropical western Pacific. The two variations are coupled: the warm oceanic phase, El Niño, accompanies high air surface pressure in the western Pacific, while the cold phase La Niña, and accompanies low air surface pressure in the western Pacific.
The extremes of this climate pattern's oscillations cause extreme weather (such as floods and droughts) in many regions of the world. Developing countries dependent upon agriculture and fishing, particularly those bordering the Pacific Ocean, are the most affected.
(Cont Below)
La Niña
Source 1
Source 2
As this next figure shows, the surface temperature is affected by up to five degrees in variance between an El Niño and a La Niña event. As you can see from the differences in water temperature, the ocean temperatures can be quite dramatically different between the different events.
It comes as no surprise that in as we swap between the two events, we also see extremes in weather. Cold snaps in northern areas, flooding and cyclones along the coastlines of the Pacific, while extreme drought tends to form in areas where previously there was an abundance of rainfall. The warmer water, particularly in tropical areas, has the potential, as we have seen with the recent spate of hurricanes, cyclones and heavy rains; tend to create a more powerful, more perfect storm.
Source
In closing, we now have the basic causes for the extreme climate changes and anomalous weather patterns we have seen sweeping the globe in recent decades. In the next part, I will focus more closely on the unseasonal flooding that has devastated northern and even southern Australia, the UK, USA and parts of Asia, and look into whether these events could have been avoided or better prepared for using the current weather pattern modelling, or whether our current levels of industrialisation and modernisation have contributed to the extreme flooding we continue to see year after year.
La Niña is a coupled ocean-atmosphere phenomenon that is the counterpart of El Niño as part of the broader El Niño-Southern Oscillation climate pattern. During a period of La Niña, the sea surface temperature across the equatorial Eastern Central Pacific Ocean will be lower than normal by 3–5 °C. In the United States, an episode of La Niña is defined as a period of at least 5 months of La Niña conditions. El Niño is known for its potentially catastrophic impact on the weather along the Chilean, Peruvian, New Zealand, and Australian coasts, among others. It has extensive effects on the weather in North America, even affecting the Atlantic Hurricane Season. La Niña is often, though not always, preceded by an El Niño.
Source 1
Source 2
As this next figure shows, the surface temperature is affected by up to five degrees in variance between an El Niño and a La Niña event. As you can see from the differences in water temperature, the ocean temperatures can be quite dramatically different between the different events.
It comes as no surprise that in as we swap between the two events, we also see extremes in weather. Cold snaps in northern areas, flooding and cyclones along the coastlines of the Pacific, while extreme drought tends to form in areas where previously there was an abundance of rainfall. The warmer water, particularly in tropical areas, has the potential, as we have seen with the recent spate of hurricanes, cyclones and heavy rains; tend to create a more powerful, more perfect storm.
Higher Sea Levels
When water heats up, it expands. Thus, the most readily apparent consequence of higher sea temperatures is a rapid rise in sea level. Sea level rise causes inundation of coastal habitats for humans as well as plants and animals, shoreline erosion, and more powerful storm surges that can devastate low-lying areas.
Stronger Storms
Many weather experts say we are already seeing the effects of higher ocean temperatures in the form of stronger and more frequent tropical storms and hurricanes/cyclones. Warmer surface water dissipates more readily into vapor, making it easier for small ocean storms to escalate into larger, more powerful systems.
These stronger storms can increase damage to human structures when they make landfall. They can also harm marine ecosystems like coral reefs and kelp forests. And an increase in storm frequency means less time for these sensitive habitats to recover.
Source
In closing, we now have the basic causes for the extreme climate changes and anomalous weather patterns we have seen sweeping the globe in recent decades. In the next part, I will focus more closely on the unseasonal flooding that has devastated northern and even southern Australia, the UK, USA and parts of Asia, and look into whether these events could have been avoided or better prepared for using the current weather pattern modelling, or whether our current levels of industrialisation and modernisation have contributed to the extreme flooding we continue to see year after year.
I'd like to repeat 74Templars's sentiment and thank Druid42 for taking the helm on this project, the readers and my fellow researchers.
As indicated in the opening statement, my purpose throughout this research project is to provide information about Global Warming's effects on the environment. Considering the vast depth of such a topic, I will focus on key issues that include, but are not limited to:
> Melting of the Polar Ice Caps -
On this topic I will provide data and sources that discuss the current and historical state of the Arctic/Antarctic Ice sheets, how their potential melting may effect the global sea levels and projections by the scientific community as to what lies ahead for the Polar Ice Sheets.
> Deforestation -
In this section we will look into the numbers behind deforestation, what occurs when these large amounts of trees are removed and how it effects the environment.
> Animals/Insects -
Here we will look into the effects global warming may have on our furry friends of the forest and insects. Included in this will be information about the changing of migration patterns as changes occur in regional temperatures, if/how insect migration may carry diseases from one region to another and we will also look into the effects global warming may have on ocean life.
> Sea Currents and Terrestrial Biomes
This section will look into how global warming, through the melting of polar ice, may effect ocean currents and also the potential effects on particular biomes and the changes that may occur.
With a rough outline in place to help guide us through my particular part of the project, let's dig right in!
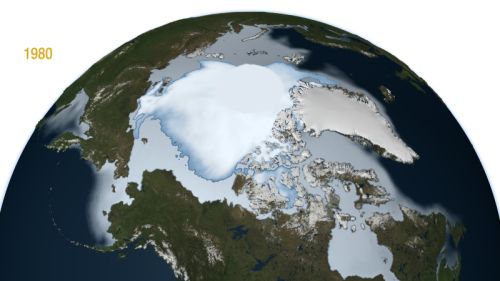
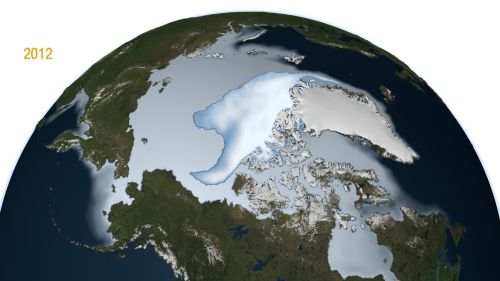
Images courtesy of NASA
According to the data collected by NASA over the course of 3 decades, the thicker sections of Arctic ice that were capable of surviving the summer melting seasons are declining at a surprising rate.
Nasa's data also concludes that "younger" ice, meaning it was formed during the last winter season, was actually increasing during certain periods. Overall, as can be seen in the above images, the Arctic ice has significantly decreased over the past few decades, but they were able to confirm that the ice goes through cycles of growth and recession that may be directly tied to particular weather events, which correlates with information provided by 74Templar.
The conclusions made by NASA are compounded by data collected by the National Snow and Ice Data Center...showing a decline of ice cover over many decades...but also showing a cyclical tendency of growth and recession.
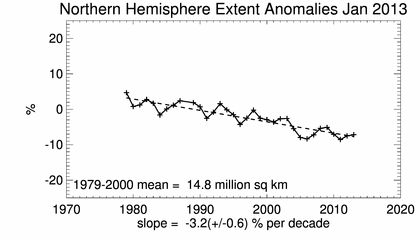
Image courtesy of NSIDC
In the following post, we shall delve into the information concerning Antarctic Ice and the data that has been collected....providing insight into whether global warming has had an effect in that region as well.
As indicated in the opening statement, my purpose throughout this research project is to provide information about Global Warming's effects on the environment. Considering the vast depth of such a topic, I will focus on key issues that include, but are not limited to:
> Melting of the Polar Ice Caps -
On this topic I will provide data and sources that discuss the current and historical state of the Arctic/Antarctic Ice sheets, how their potential melting may effect the global sea levels and projections by the scientific community as to what lies ahead for the Polar Ice Sheets.
> Deforestation -
In this section we will look into the numbers behind deforestation, what occurs when these large amounts of trees are removed and how it effects the environment.
> Animals/Insects -
Here we will look into the effects global warming may have on our furry friends of the forest and insects. Included in this will be information about the changing of migration patterns as changes occur in regional temperatures, if/how insect migration may carry diseases from one region to another and we will also look into the effects global warming may have on ocean life.
> Sea Currents and Terrestrial Biomes
This section will look into how global warming, through the melting of polar ice, may effect ocean currents and also the potential effects on particular biomes and the changes that may occur.
With a rough outline in place to help guide us through my particular part of the project, let's dig right in!
Melting of the Polar Ice Caps
GREENBELT, Md. -- A new NASA study revealed that the oldest and thickest Arctic sea ice is disappearing at a faster rate than the younger and thinner ice at the edges of the Arctic Ocean’s floating ice cap.
Images courtesy of NASA
According to the data collected by NASA over the course of 3 decades, the thicker sections of Arctic ice that were capable of surviving the summer melting seasons are declining at a surprising rate.
Multi-year ice "extent" – which includes all areas of the Arctic Ocean where multi-year ice covers at least 15 percent of the ocean surface – is diminishing at a rate of -15.1 percent per decade, the study found.........Comiso found that multi-year ice area is shrinking even faster than multi-year ice extent, by -17.2 percent per decade.
Nasa's data also concludes that "younger" ice, meaning it was formed during the last winter season, was actually increasing during certain periods. Overall, as can be seen in the above images, the Arctic ice has significantly decreased over the past few decades, but they were able to confirm that the ice goes through cycles of growth and recession that may be directly tied to particular weather events, which correlates with information provided by 74Templar.
He also detected a periodic nine-year cycle, where sea ice extent would first grow for a few years, and then shrink until the cycle started again. This cycle is reminiscent of one occurring on the opposite pole, known as the Antarctic Circumpolar Wave, which has been related to the El Niño-Southern Oscillation atmospheric pattern. If the nine-year Arctic cycle were to be confirmed, it might explain the slight recovery of the sea ice cover in the three years after it hit its historical minimum in 2008, Comiso said.
The conclusions made by NASA are compounded by data collected by the National Snow and Ice Data Center...showing a decline of ice cover over many decades...but also showing a cyclical tendency of growth and recession.
Image courtesy of NSIDC
In the following post, we shall delve into the information concerning Antarctic Ice and the data that has been collected....providing insight into whether global warming has had an effect in that region as well.
I would also like to thank ATS and Druid for putting this important project forward, As stated each of us has a specific task within, and mine is to
look at and analyse the historical climate changes that the planet has gone through in it's history. To that end I am currently looking through no
less than hundreds of charts, and graphs that have been compiled by NASA, and the NOAA, as well as private research firms to try and get a fix on
whether the Earth has seen a spike in temp over the industrial age, ie: Mankind has been effecting the climate, OR whether the Earth naturally goes
through these cycles.
So in opening I would like to first examine a very simplified look at the climate since 2500BCE
Source
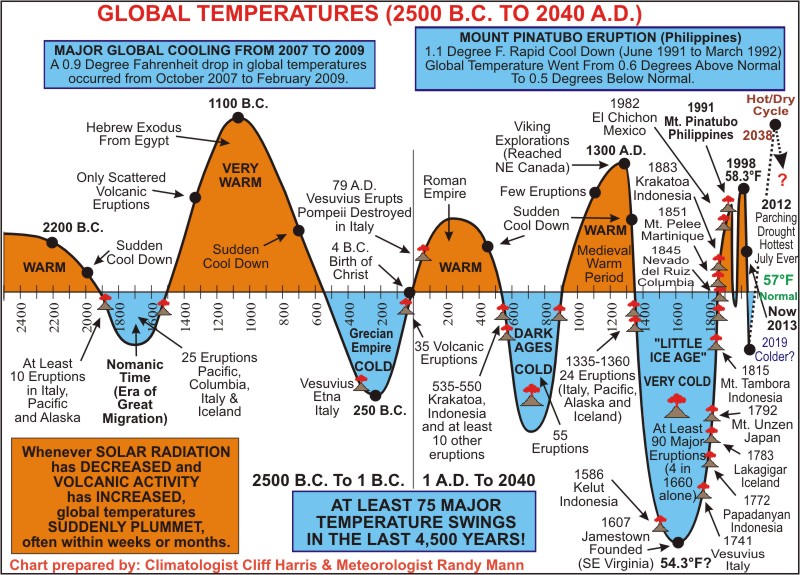
As we can see in this picture the planet has been through many such ups and downs in it's history, it's not until 2007 that the chart gets a little strange, however, this could be due to advanced monitoring equipment, and technology we did not have previously. What it shows in essence is that throughout history the Earth has undergone severe shifts in it's overall temps. The Chart claims that whenever Solar radiation DECREASES and volcanic activity thus INCREASES we see a sudden cooling of the planet, and even now, in the midst of all of this debate on global warming, the Earth is settling down to it's mean normal temp of 57 Degrees F.
One other sidenote before i get back to writing the meatier portions of my presentation on historical trends, a very interesting bit of information buried in all of this that I am going to find the original citations and research on, because if true, shows that this sudden change in our climate was predictable based upon history.
from the same source as above:
So. Upon, albeit early and incomplete research, still pouring over various charts and data, if this holds up, it will prove that the Earth does indeed go through these changes, and that while we may make a marginal impact upon them, we are not the cause of the shifting climates, rather the Earth herself is.
So in opening I would like to first examine a very simplified look at the climate since 2500BCE
Source
As we can see in this picture the planet has been through many such ups and downs in it's history, it's not until 2007 that the chart gets a little strange, however, this could be due to advanced monitoring equipment, and technology we did not have previously. What it shows in essence is that throughout history the Earth has undergone severe shifts in it's overall temps. The Chart claims that whenever Solar radiation DECREASES and volcanic activity thus INCREASES we see a sudden cooling of the planet, and even now, in the midst of all of this debate on global warming, the Earth is settling down to it's mean normal temp of 57 Degrees F.
One other sidenote before i get back to writing the meatier portions of my presentation on historical trends, a very interesting bit of information buried in all of this that I am going to find the original citations and research on, because if true, shows that this sudden change in our climate was predictable based upon history.
from the same source as above:
The Weather Science Foundation also predicted, based on these various climate cycles, that our planet would turn much warmer and wetter by the early 2000s, resulting in general global prosperity. They also said that we would be seeing at this time widespread weather ‘extremes.’ There’s little doubt that most of their early predictions came true.
So. Upon, albeit early and incomplete research, still pouring over various charts and data, if this holds up, it will prove that the Earth does indeed go through these changes, and that while we may make a marginal impact upon them, we are not the cause of the shifting climates, rather the Earth herself is.
I wish to thank all the members that have joined me on this Research Project, an in-depth study on the Reality of Global Warming, the staff of ATS
that are involved with the Research Forum, and all those who read this Project. I'll be researching HAARP, the atmosphere, and finally the
relationship between pollution and our environment.
-------------------------------------------------------------------------------------------------
What is HAARP?
To some, it's been alleged as a nefarious government agency that seeks to control the weather on this planet, somehow tied into brainwashing and mind control, that causes all sorts of environmental disasters, including earthquakes and hurricanes.
HAARP stands for the High Frequency Active Auroral Research Project. It is a facility in Alaska that studies Ionospheric Physics and Radio Science. Well, by using a few technical terms that are poorly understood we can surely see something horrible occurring, right? Why would anyone want to study the Ionosphere? What is the Ionosphere, anyway?
Aerial view of the HAARP, looking towards Mt. Sanford, Alaska.
First, a bit of history, then some explanations:
Long distance communications are reliant upon the Ionosphere, and without it, global communication would not be possible in it's current form.
Accordingly, we find that,
Here's a few technical details:
Military funded? Well, they do have a vested interest in communicating with troops around the world, and as we continue our research on global warming, we'll see how important the HAARP is, not only for the military, but as an aid in understanding how our planet protects us from solar radiation.
continued......
-------------------------------------------------------------------------------------------------
What is HAARP?
To some, it's been alleged as a nefarious government agency that seeks to control the weather on this planet, somehow tied into brainwashing and mind control, that causes all sorts of environmental disasters, including earthquakes and hurricanes.
HAARP stands for the High Frequency Active Auroral Research Project. It is a facility in Alaska that studies Ionospheric Physics and Radio Science. Well, by using a few technical terms that are poorly understood we can surely see something horrible occurring, right? Why would anyone want to study the Ionosphere? What is the Ionosphere, anyway?
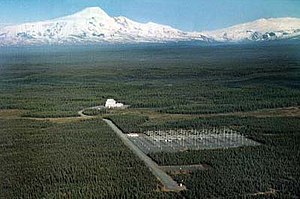
Aerial view of the HAARP, looking towards Mt. Sanford, Alaska.
First, a bit of history, then some explanations:
In 1864, a Scottish mathematician named James Clerk Maxwell published a remarkable paper describing the means by which a wave consisting of electric and magnetic fields could propagate (or travel) from one place to another. Maxwell's theory of electromagnetic (EM) radiation was eventually proven correct by the German physicist, Heinrich Hertz in the late 1880's in a series of careful laboratory experiments.
In a landmark experiment on December 12, 1901, Marconi, who is often called the "Father of Wireless," demonstrated transatlantic communication by receiving a signal in St. John's Newfoundland that had been sent from Cornwall, England. Because of his pioneering work in the use of electromagnetic radiation for radio communications, Marconi was awarded the Nobel Prize in physics in 1909.
In 1902, Oliver Heaviside and Arthur Kennelly each independently proposed that a conducting layer existed in the upper atmosphere that would allow a transmitted EM signal to be reflected back toward the Earth. Up to this time, there was no direct evidence of such a region and little was known about the physical or electrical properties of the Earth's upper atmosphere.
The excitement of Marconi's transatlantic demonstration inspired numerous private and commercial experiments to determine the ultimate capabilities of this newly discovered resource, the ionosphere. Among the most important early experiments were those conducted by radio amateurs who showed the value of the so-called high frequencies above 2 MHz for long distance propagation using the ionosphere.
Although our society has learned to use the properties of the ionosphere in many beneficial ways over the last century, there is still a great deal to learn about its physics, its chemical makeup and its dynamic response to solar influence.
Long distance communications are reliant upon the Ionosphere, and without it, global communication would not be possible in it's current form.
Accordingly, we find that,
HAARP is a scientific endeavor aimed at studying the properties and behavior of the ionosphere, with particular emphasis on being able to understand and use it to enhance communications and surveillance systems for both civilian and defense purposes.
Here's a few technical details:
...is an ionospheric research program jointly funded by the U.S. Air Force, the U.S. Navy, the University of Alaska, and the Defense Advanced Research Projects Agency (DARPA).
Military funded? Well, they do have a vested interest in communicating with troops around the world, and as we continue our research on global warming, we'll see how important the HAARP is, not only for the military, but as an aid in understanding how our planet protects us from solar radiation.
Built by BAE Advanced Technologies (BAEAT), its purpose is to analyze the ionosphere and investigate the potential for developing ionospheric enhancement technology for radio communications and surveillance. The HAARP program operates a major sub-arctic facility, named the HAARP Research Station, on an Air Force–owned site near Gakona, Alaska.
continued......
edit on 2/16/13 by Druid42 because: spelling
......continued.
Why is this important? We'll get to that in a moment. Let's dispel the myth of secret military research first:
Sorry, Jesse Ventura, but you are not an accredited scientist, and this IS a scientific research facility. Wait for the yearly tour next time.
Here's a LINK to their data index. Yes, all research is freely available.
As far as sending "beams" around the world? The research conducted at the facility only affects the Ionosphere directly above the antenna array.
We've discovered so far that HAARP researches the Ionosphere. They are not alone, as there are other research facilities around the world:
Why is there so much interest in the Ionosphere? Communication disruption is only one aspect of the total interest.
The Ionosphere is the layer between our atmosphere, the air we breath, and the cold confines of space. It absorbs Solar Radiation, and together with the magnetosphere, protects our planet from the Sun. In the next segment we'll look closer at the Ionosphere, the way it functions, and define the relationship to changes in the environment.
The most prominent instrument at the HAARP Station is the Ionospheric Research Instrument (IRI), a high-power radio frequency transmitter facility operating in the high frequency (HF) band. The IRI is used to temporarily excite a limited area of the Ionosphere. Other instruments, such as a VHF and a UHF radar, a fluxgate magnetometer, a digisonde, and an induction magnetometer, are used to study the physical processes that occur in the excited region.
The HAARP project directs a 3.6 MW signal, in the 2.8–10 MHz region of the HF (high-frequency) band, into the ionosphere. The signal may be pulsed or continuous. Then, effects of the transmission and any recovery period can be examined using associated instrumentation, including VHF and UHF radars, HF receivers, and optical cameras.
this will advance the study of basic natural processes that occur in the ionosphere under the natural but much stronger influence of solar interaction, and how the natural ionosphere affects radio signals.
Why is this important? We'll get to that in a moment. Let's dispel the myth of secret military research first:
The HAARP program began in 1990.....Many other universities and educational institutions of the United States have been involved in the development of the project and its instruments, namely the University of Alaska Fairbanks, Stanford University, Penn State University (ARL), Boston College, UCLA, Clemson University, Dartmouth College, Cornell University, Johns Hopkins University, University of Maryland, College Park, University of Massachusetts Amherst, MIT, Polytechnic Institute of New York University, and the University of Tulsa. The project's specifications were developed by the universities, which are continuing to play a major role in the design of future research efforts.
According to HAARP's management, the project strives for openness, and all activities are logged and publicly available. Scientists without security clearances, even foreign nationals, are routinely allowed on site. The HAARP facility regularly (once a year on most years according to the HAARP home page) hosts open houses, during which time any civilian may tour the entire facility.
Sorry, Jesse Ventura, but you are not an accredited scientist, and this IS a scientific research facility. Wait for the yearly tour next time.
Here's a LINK to their data index. Yes, all research is freely available.
As far as sending "beams" around the world? The research conducted at the facility only affects the Ionosphere directly above the antenna array.
That portion of the ionosphere that is not directly over the facility is not affected in any way by HAARP. As a result, there will be no impact produced by HAARP on the protective qualities of the earth's atmosphere. This was the conclusion of the environmental impact process, and the question was thoroughly studied by experts in the field prior to granting permission to proceed with the project.
We've discovered so far that HAARP researches the Ionosphere. They are not alone, as there are other research facilities around the world:
In America, there are two related ionospheric heating facilities: the HIPAS, near Fairbanks, Alaska, which was dismantled in 2009, and (currently offline for reconstruction) one at the Arecibo Observatory in Puerto Rico. The European Incoherent Scatter Scientific Association (EISCAT) operates an ionospheric heating facility, capable of transmitting over 1 GW effective radiated power (ERP), near Tromsø, Norway. Russia has the Sura Ionospheric Heating Facility, in Vasilsursk near Nizhniy Novgorod, capable of transmitting 190 MW ERP.
Why is there so much interest in the Ionosphere? Communication disruption is only one aspect of the total interest.

This figure shows how ionospheric delay can effect the transmission of GPS radio signals. This example shows that the amount of ionospheric delay varies based on the electron density and that the electron density can vary based on geographic location and sunspot activity. This diagram also shows that the amount of delay is different for the different GPS frequencies.
The Ionosphere is the layer between our atmosphere, the air we breath, and the cold confines of space. It absorbs Solar Radiation, and together with the magnetosphere, protects our planet from the Sun. In the next segment we'll look closer at the Ionosphere, the way it functions, and define the relationship to changes in the environment.
Before starting, i must thank Druid42 for allowing me into this project. I must also thank the moderators, Rising Against, ADVISOR, Sauron and
Davespanners for their astounding job in helping and keeping things in order. Lastly, i must also thank my team mates for this wonderful
opportunity.
Good Afternoon everybody, i am daaskapital, and my goals during this research project primarily focus around the political aspects of Global Warming. Delving into the political spheres of Global Warming, i will be providing, and discussing the elements of:
- The UN standards in regards to Global Warming
- The reluctant countries thereof.
- Governmental Regulations (of primary countries around the globe).
- The circumvention tactics on behalf of the major companies found within said countries.
- And corporate greed inhibiting the success of strict environmental laws
_______________________________________________________________________________
With the United Nations (UN) being the official representative of international countries the world over, it is only natural for it to construct and apply its own methods and standards in regards to the ever apparent threat of Global Warming, or Climate Change. The standards of which the UN applies are expected to be agreed with, and imposed by its member countries.
While the UN has taken many steps in minimising the effects of human interference on nature (a critical factor in Global Warming/Climate Change), perhaps its greatest effort is that of the Kyoto Protocol. The Kyoto Protocol as explained by the UN is:
The UN goes further in explaining exactly what the Kyoto Protocol covers:
unfccc.int...
The Kyoto Protocol is adhered to by the majority of the countries in the world today. Out of the 196 independent nations, 190 countries have signed the Kyoto Protocol and are intending to ratify it, while 1 nation has signed it, but is not intending to ratify it.
List of member Nations:
en.wikipedia.org...
List of Independent Nations in the world today:
geography.about.com...
For further information on the Kyoto Protocol, one can see the link below. It includes the official documentation of the Kyoto Protocol itself:
unfccc.int...
My next post will revolve around the reluctant countries (who have not signed the Kyoto Protocol), and individual Governmental regulations of independent nations in regards to Global Warming or Climate Change.
Good Afternoon everybody, i am daaskapital, and my goals during this research project primarily focus around the political aspects of Global Warming. Delving into the political spheres of Global Warming, i will be providing, and discussing the elements of:
- The UN standards in regards to Global Warming
- The reluctant countries thereof.
- Governmental Regulations (of primary countries around the globe).
- The circumvention tactics on behalf of the major companies found within said countries.
- And corporate greed inhibiting the success of strict environmental laws
_______________________________________________________________________________
The UN standards in regards to Global Warming
With the United Nations (UN) being the official representative of international countries the world over, it is only natural for it to construct and apply its own methods and standards in regards to the ever apparent threat of Global Warming, or Climate Change. The standards of which the UN applies are expected to be agreed with, and imposed by its member countries.
While the UN has taken many steps in minimising the effects of human interference on nature (a critical factor in Global Warming/Climate Change), perhaps its greatest effort is that of the Kyoto Protocol. The Kyoto Protocol as explained by the UN is:
...an international agreement linked to the United Nations Framework Convention on Climate Change, which commits its Parties by setting internationally binding emission reduction targets.
The UN goes further in explaining exactly what the Kyoto Protocol covers:
Recognizing that developed countries are principally responsible for the current high levels of GHG emissions in the atmosphere as a result of more than 150 years of industrial activity, the Protocol places a heavier burden on developed nations under the principle of "common but differentiated responsibilities."
The Kyoto Protocol was adopted in Kyoto, Japan, on 11 December 1997 and entered into force on 16 February 2005. The detailed rules for the implementation of the Protocol were adopted at COP 7 in Marrakesh, Morocco, in 2001, and are referred to as the "Marrakesh Accords." Its first commitment period started in 2008 and ended in 2012.
unfccc.int...
The Kyoto Protocol is adhered to by the majority of the countries in the world today. Out of the 196 independent nations, 190 countries have signed the Kyoto Protocol and are intending to ratify it, while 1 nation has signed it, but is not intending to ratify it.
List of member Nations:
en.wikipedia.org...
List of Independent Nations in the world today:
geography.about.com...
For further information on the Kyoto Protocol, one can see the link below. It includes the official documentation of the Kyoto Protocol itself:
unfccc.int...
My next post will revolve around the reluctant countries (who have not signed the Kyoto Protocol), and individual Governmental regulations of independent nations in regards to Global Warming or Climate Change.
The countries which refuse to accept the Kyoto Protocol
While the majority of the world's countries have signed and ratified the UN's Kyoto Protocol; there is still a list of countries which have not. This post will go into detail about said countries, and provide reasons as to why they had refused.
The following countries are those which are yet to sign and ratify the Kyoto Protocol:
- Andorra
- Afghanistan
- Palestine
- Vatican City
- South Sudan
It must also be stated at this time, that Canada has withdrew from the Kyoto Protocol as of 2012.
Mr. Kent said staying in Kyoto would force Canada to spend about $14-billion buying carbon credits abroad because the country is so far behind in meeting its targets. He blamed the previous Liberal government, saying it agreed to targets without a plan to achieve them.
www.theglobeandmail.com...
The USA has signed the Kyoto Protocol, but is not intending to ratify it.
Vice President Al Gore was a main participant in putting the Kyoto Protocol together in 1997. President Bill Clinton signed the agreement in 1997, but the US Senate refused to ratify it, citing potential damage to the US economy required by compliance. The Senate also balked at the agreement because it excluded certain developing countries, including India and China, from having to comply with new emissions standards.
usliberals.about.com...
___________________________________________________________________________________
Upon further research, there are no apparent reasons as to why the other countries have not yet signed and ratified the Kyoto Protocol. One can, however, surmise that some of the stated countries are either too small (in land or population), while also not having the means to contribute to and aid the fight against Global Warming, Furthermore, it can be argued that said counties do not contribute majorly to pollution and Global Warming, thus meaning that they do not have to work as hard in combatting it (i.e. signing the Kyoto Protocol).
Governmental Regulations in regards to Global Warming
This post will provide information on individual governmental regulations in regards to global warming, The countries of which will be covered include China, the USA, Russia and Australia. One reason being that most of the countries fall within the top 10 global warming producing countries (with the exception of Australia). Another reason being that most of the countries have taken their own steps in combating and reducing the amount of emissions they produce.
www.ucsusa.org...
China
:Considering China has contributed much to Global warming, it is only right for it to help combat it. Indeed, China has taken steps to decrease its emissions of greenhouse gases through what they call the Chinese national carbon trading scheme.
The carbon price of 60 yuan a ton last month in Guandong, the manufacturing hub near Hong Kong, reflects government policy more than market forces, said Milo Sjardin, the Singapore-based head of Asia-Pacific analysis at New Energy Finance. Depending on whether China allows investors and financial intermediaries to participate in the domestic market, prices may eventually be driven by the supply and demand, he said.
Shanghai, China’s biggest city, and Guangdong plan to require producers of steel, petrochemicals and electricity and others with annual emissions of more than 20,000 tons to buy tradable permits. The other regions in China’s pilot program are Beijing, Tianjin, Chongqing, Shenzhen and Hubei.
China is starting a domestic carbon-trading system in the five years through 2015 to achieve a 2020 target to control greenhouse-gas emissions through a market-based mechanism, the National Development and Reform Commission said in a statement in January.
www.smh.com.au...
Doing this, china is able to effectively decrease the amount of emissions the country itself produces (as companies must pay money for the amount of pollution they produce).
United States of America
:The USA has also taken its own steps against global warming, through both, state and federal levels. This section will be focusing on the federal side of things. The global warming policies have changed as time moved on and as such, this section will also be focusing on the policies under the Obama administration.
On a federal level, the Obama Administration has announced the plan of "New Energy for America."
The Obama-Biden comprehensive New Energy for America plan will:
•Help create five million new jobs by strategically investing $150 billion over the next ten years to catalyze private efforts to build a clean energy future.
•Within 10 years save more oil than we currently import from the Middle East and Venezuela combined.
•Put 1 million Plug-In Hybrid cars -- cars that can get up to 150 miles per gallon -- on the road by 2015, cars that we will work to make sure are built here in America.
•Ensure 10 percent of our electricity comes from renewable sources by 2012, and 25 percent by 2025.
•Implement an economy-wide cap-and-trade program to reduce greenhouse gas emissions 80 percent by 2050.
To achieve these results, the plan aims to achieve:
Provide Short-term Relief to American Families:
•Crack Down on Excessive Energy Speculation.
•Swap Oil from the Strategic Petroleum Reserve to Cut Prices.
Eliminate Our Current Imports from the Middle East and Venezuela within 10 Years
•Increase Fuel Economy Standards.
•Get 1 Million Plug-In Hybrid Cars on the Road by 2015.
•Create a New $7,000 Tax Credit for Purchasing Advanced Vehicles.
•Establish a National Low Carbon Fuel Standard.
•A “Use it or Lose It” Approach to Existing Oil and Gas Leases.
•Promote the Responsible Domestic Production of Oil and Natural Gas.
Create Millions of New Green Jobs
•Ensure 10 percent of Our Electricity Comes from Renewable Sources by 2012, and 25 percent by 2025.
•Deploy the Cheapest, Cleanest, Fastest Energy Source – Energy Efficiency.
•Weatherize One Million Homes Annually.
•Develop and Deploy Clean Coal Technology.
•Prioritize the Construction of the Alaska Natural Gas Pipeline.
Reduce our Greenhouse Gas Emissions 80 Percent by 2050
•Implement an economy-wide cap-and-trade program to reduce greenhouse gas emissions 80 percent by 2050.
•Make the U.S. a Leader on Climate Change.
change.gov...
This post will be continued further.
Russia:
Even though Russia is affected drastically by the effects of global warming, it has not, for the most part, taken any individual governmental steps in order to halt it. In fact, Russia's decision to drop the Kyoto Protocol probably displays Russia's careless attitude when it comes to global warming and climate change.
Russia decided to discontinue its participation in the protocol because the world’s major producers of greenhouse gases – the United States, China and India – are still refusing to commit themselves to reduce greenhouse gas emissions.
Because of that, Russian leaders say, the Kyoto Protocol, which came into force seven years ago, had no impact on the rate of global warming.
www.thegwpf.org...
While it may seem like a logical move, it is in fact, not. Instead of spearheading the fight against global warning, Russia has decided to pull out due to reasons stated in the above article. Again, the reasons stated prove that Russia sees the fight against global warming as a lost cause, due to the fact that other countries refuse to lift their game.
Australia:
Considering Australia is perhaps one of the most threatened countries when it comes to global warming and climate change (due to its climate and location), it is no surprise that the country's government has made moves in combating it. Perhaps the greatest move in which Australia has made is that of the Carbon tax.
The national and international carbon market is set to change dramatically over the next few years and Australia’s Carbon Tax is a significant part of this transition – organisations must adapt and prepare for a carbon constrained future.
What it Means for the Top 500 Emitters
The top 500 emitters will be charged a flat rate fee of $23 per tonne of emissions by the government in the first year, beginning 1 July 2012. The main objective is to cut Australia’s carbon emissions by 5% by 2020. Major industries affected include electricity and energy generators, mining, business transport, waste and industrial processes.
What Happens with the Money?
Monies will be reinvested into clean energy technology and renewable energy projects. Offshoot development funds will also be set up to focus on biodiversity, low carbon agriculture, small business grants and indigenous communities. The government has promised to compensate 90% of households for any increase in energy bills via tax cuts or increases to family benefits.
www.carbonneutral.com.au...
Considering the governments of the world have taken drastic steps in halting Global Warming, it is only natural for greedy companies to combat the regulations imposed by said governments, My next post will cover, in detail, the companies and their circumvention tactics used to bypass the legislations.
Polar Ice continued......
Now we turn our attention to the opposite side of the globe.....Antarctica.
It came become quite confusing in this area considering that the information provided seems to contradict itself at times.
For Example:
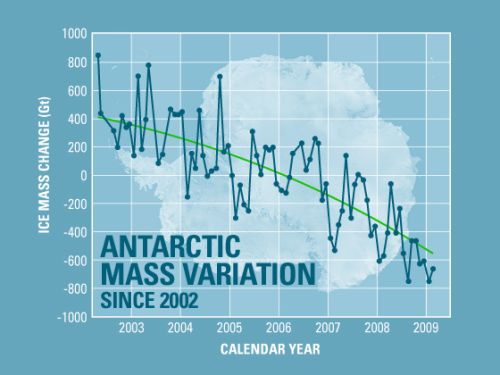
Source
The graph above gives us an idea of how changes in ice mass concentration changes constantly, but shows a steady decline within the timeline provided.
Gravity data collected from space using NASA's Grace satellite show that Antarctica has been losing more than a hundred cubic kilometers (24 cubic miles) of ice each year since 2002. The latest data reveal that Antarctica is losing ice at an accelerating rate, too
But then the same source gives us this:
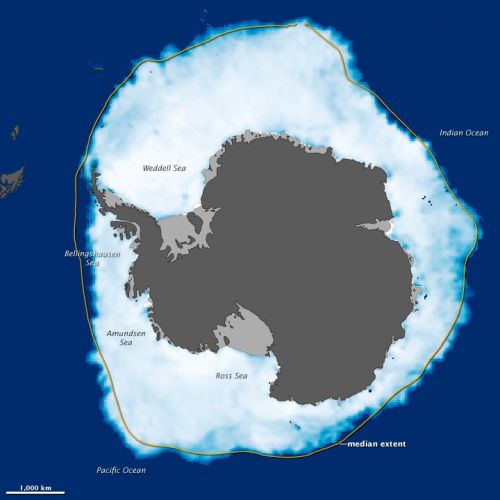
Source
Here we have information that tells us the ice shelf is growing beyond the average extent.
Two weeks after a new record was set in the Arctic Ocean for the least amount of sea ice coverage in the satellite record, the ice surrounding Antarctica reached its annual winter maximum—and set a record for a new high. Sea ice extended over 19.44 million square kilometers (7.51 million square miles) in 2012, according to the National Snow and Ice Data Center (NSIDC). The previous record of 19.39 million kilometers (7.49 million square miles) was set in 2006.
It can leave one a little confused as to what this exactly means. On one hand the overall mass is in a steady decline. On the other, we see that the breadth of the ice is at or above the average.
It turns out that the answer is fairly simple.
While the newly frozen water increases the overall width and extent of the Antarctic Ice, the underlying multi-year ice is slowly melting or shifting away. As this occurs, the foundation that supports the addition of mutli-year ice over time....is becoming unstable; causing the overall integrity of the ice shelf to become compromised.
As an illustration:
So as you can see, it's quality not quantity that is important. While the coverage of the ice can increase throughout it's various cycles, what's really important is the overall mass that is key and serves to stand as the stepping stone for maintaining or increasing the quantity AND quality of the Antarctic region.
Now since we have briefly discussed both polar regions, I feel it's mandatory to discuss the Ozone layer and the effects it has on the ice sheets.
The ozone layer is a concentration of ozone molecules in the stratosphere. About 90% of the planet's ozone is in the ozone layer. The layer of the Earth's atmosphere that surrounds us is called the troposphere. The stratosphere, the next higher layer, extends about 10-50 kilometers above the Earth's surface. Stratospheric ozone is a naturally-occurring gas that filters the sun's ultraviolet (UV) radiation. A diminished ozone layer allows more radiation to reach the Earth's surface. For people, overexposure to UV rays can lead to skin cancer, cataracts, and weakened immune systems. Increased UV can also lead to reduced crop yield and disruptions in the marine food chain.
Source
Each year for the past few decades during the Southern Hemisphere spring, chemical reactions involving chlorine and bromine cause ozone in the southern polar region to be destroyed rapidly and severely. This depleted region is known as the “ozone hole”.
Source
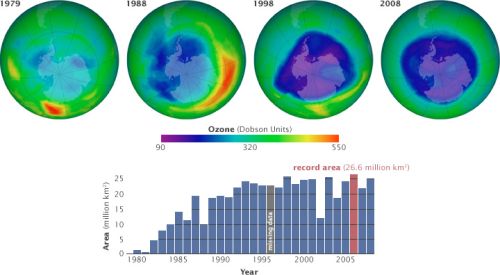
The Total Ozone Mapping Spectrometer revealed the size and depth of the ozone hole that first formed over Antarctica in the 1980s. Scientists used the data to demonstrate the need for a ban on ozone-destroying chemicals, which went into effect in 1989. (Images and data courtesy NASA Ozone Hole Watch.)
Source
So far it seems that we can conclude that changes are occurring on both poles, but it seems to go far beyond the cyclical "ups and downs" researchers expect. The depletion of ozone and various other factors have an obvious effect on the polar ice sheets.
In the next post we will discuss sea levels, why it's so important and what may lie ahead.
edit on 23-2-2013 by sheepslayer247 because: grammar
Part Two:
[color=SkyBlue2]
From our previous report, two facts have emerged that lend credence to the nature of extreme weather events. A shift between the El Niño (warmer) and the La Niña (cooler) system cause differentiation in the ocean’s temperature by up to five degrees. This variance can cause higher sea levels, which to lower lying urban areas can spell disaster, literally. Many of the world’s cities are either at or below sea level, kept dry by both constant human maintenance and technology.
The second fact is higher ocean temperatures tend to form into water vapour more easily, and is stored by clouds in larger amounts. With the higher ocean levels, higher concentrates of water vapour stored in clouds, and the crossing over higher land into areas of flood plains is fuelled by warmer ocean winds, it creates devastating tidal storm surges, and has the potential to deliver record amounts of rain and devastating winds over coastal areas.
In short, what we have is the perfect storm.
Katrina. Yasi. Sandy. Three names that will remain synonymous in modern history with death, destruction and the pure fury of nature. Since 2005, the frequency of hurricanes in the northern hemisphere and the cyclones and typhoons in the southern hemisphere have dramatically intensified. So what cause these monsters?
Source
Cyclones and hurricanes can vary in size and strength, and intensity, generally beginning with a Category 1 storm, to a full-fledged Category 5. Hurricane Sandy was a category 3 hurricane, both Yasi and Katrina were both category 5.
When you take into account warmer ocean temperatures, which allow more vapour into the atmosphere, generating larger and more precipitous clouds, and already higher ocean levels due to the rise in ocean temperature over the last century, higher levels of rainfall across tropical areas and a greater intensity of storms heading towards land, we are faced with a doubly-devastating potential.
(Cont below)
[color=SkyBlue2]
Water and Wind.
From our previous report, two facts have emerged that lend credence to the nature of extreme weather events. A shift between the El Niño (warmer) and the La Niña (cooler) system cause differentiation in the ocean’s temperature by up to five degrees. This variance can cause higher sea levels, which to lower lying urban areas can spell disaster, literally. Many of the world’s cities are either at or below sea level, kept dry by both constant human maintenance and technology.
The second fact is higher ocean temperatures tend to form into water vapour more easily, and is stored by clouds in larger amounts. With the higher ocean levels, higher concentrates of water vapour stored in clouds, and the crossing over higher land into areas of flood plains is fuelled by warmer ocean winds, it creates devastating tidal storm surges, and has the potential to deliver record amounts of rain and devastating winds over coastal areas.
In short, what we have is the perfect storm.
Katrina. Yasi. Sandy. Three names that will remain synonymous in modern history with death, destruction and the pure fury of nature. Since 2005, the frequency of hurricanes in the northern hemisphere and the cyclones and typhoons in the southern hemisphere have dramatically intensified. So what cause these monsters?
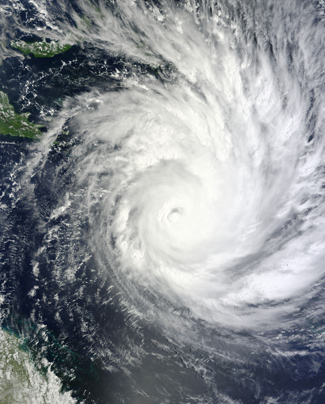
How a cyclone/hurricane forms
A cyclone/hurricane needs two main ingredients: a cluster of thunderstorms and a warm body of water – at least 27ºC – from which the storm gathers its energy. The warm, tropical ocean under a developing storm evaporates then condenses to form clouds, releasing heat throughout the process.
The heat energy combined with the rotation of the Earth gets the cyclone spinning and propels it forward. While the cyclone looks savage from the outside, its low-pressure centre, commonly known as the eye, is deceptively calm. This belies the danger of the dense wall of cloud that surrounds it, which is the deadliest part of a cyclone.
Here the strongest winds and greatest rainfall are found. The eye is usually 40 km in diameter, but can range in size from less than 10 km to over 100 kms.
Source
Cyclones and hurricanes can vary in size and strength, and intensity, generally beginning with a Category 1 storm, to a full-fledged Category 5. Hurricane Sandy was a category 3 hurricane, both Yasi and Katrina were both category 5.
Cyclone categories
Tropical Cyclones are characterised by strong continuous winds of more than 63 km/h. Once those winds reach 118 km/h the cyclone is classified as severe. Australia's Bureau of Meteorology classifies cyclones by the following criteria:
CATEGORY 1
Strongest winds: Gales, 90 - 125 km/h
Negligible house damage. Damage to some crops, trees and caravans. Boats may drag moorings.
CATEGORY 2
Strongest winds: Destructive, 125 - 164 km/h
Minor house damage. Significant damage to signs, trees and caravans. Heavy damage to some crops. Risk of power failure. Small boats may break moorings.
CATEGORY 3
Strongest winds: Very destructive,165 - 224 km/h
Some roof and structural damage. Some caravans destroyed. Power failures likely.
CATEGORY 4
Strongest winds: Very destructive, 225 - 279 km/h
Significant roofing loss and structural damage. Many caravans destroyed and blown away. Dangerous airborne debris. Widespread power failures.
CATEGORY 5
Strongest winds: Very destructive, more than 290 km/h
Extremely dangerous with widespread destruction.
However, wind is not always the most destructive aspect of a storm. A cyclone can cause massive walls of water – storm surges – to move to shore at a high speed. The force of the water can cause damage to properties near the coast and is likely accompanied by torrential rain.
When you take into account warmer ocean temperatures, which allow more vapour into the atmosphere, generating larger and more precipitous clouds, and already higher ocean levels due to the rise in ocean temperature over the last century, higher levels of rainfall across tropical areas and a greater intensity of storms heading towards land, we are faced with a doubly-devastating potential.
(Cont below)
edit on 6/3/2013 by 74Templar because: fixed ex links
Flooding.
Many of the world’s major cities are either at or below sea level, and many are ringed by ranges and mountains. As these storms cross the land, they whip up the water of the oceans, raising the sea level even further as it approaches. If a storm hits at a high tide, then it pushes the higher water levels into the low lying coastal areas, as the storm runs into higher ground and cannot pass due to the large amounts of water vapour already stored. This creates a double effect of wet weather.
First the rains begin to fall, and are extremely heavy. This soaks the ground to saturation, and begins to fill up dams and waterways exponentially. Rains can sometimes top 200-300mm in just days, or even hours as evidenced by the ‘inland tsunami’ that devastated Australia’s Lockyer Valley in 2011.
The city of Toowoomba, in the Darling Downs, was hit by flash flooding after more than 160 millimeters (6.3 in) of rain fell in 36 hours to 10 January 2011; this event caused four deaths in a matter of hours.
A three-week period where it had rained on all but three days had left the soil around Toowoomba super saturated and when a line of storms hit the city on 10 January, the resulting torrential rain rapidly ran off down gullies and streets. The central business district of the city sits in a small valley where two small water courses—East Creek and West Creek—meet to form Gowrie Creek. Unable to cope with the volume of water heading toward them, the creeks burst their banks, pushing a devastating wall of water through the city centre. This water then headed west, not towards the Lockyer Valley which was also experiencing extreme rainfall that fell on eastern facing slopes.
Source
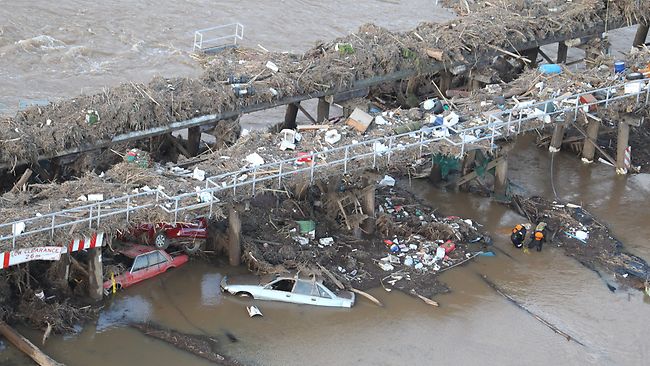
This was the end result of the 2011 floods. Thirty-five people dead across southern Queensland, 21 alone from the Lockyer Valley region, where what was described as an ‘inland tsunami’ destroyed townships, swept away lives and generally wreaked havoc on the people of SE Queensland.
But this flooding is not restricted to areas along the Pacific and Atlantic coastlines. Although it is relatively common for cyclones and hurricanes, wet weather and torrential rain to pummel the coasts of the tropics in a La Nina year, other areas have felt the brunt of some of the wettest years on record, and some of the most deadly flooding in centuries.
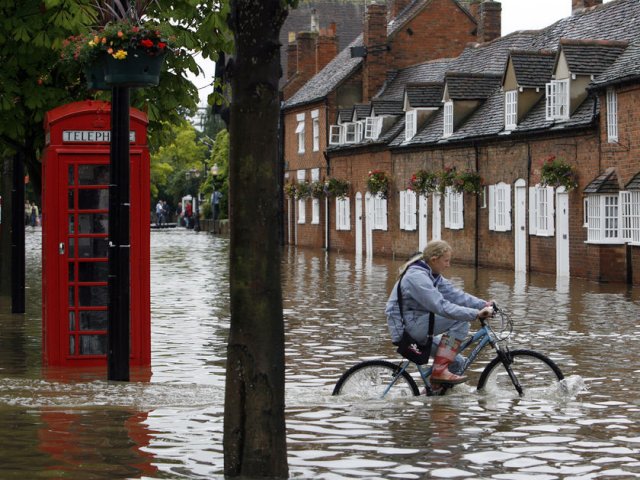
The United Kingdom 2012. Perhaps the strangest, and most prolific wet weather year and strangest weather pattern on record. In early 2012, England suffered through a crippling drought, followed by three months of torrential rain and flooding that enveloped almost the entire country. The cause? The moving of the northern Jet Stream to a more southerly route, taking it south of the UK.
This year has seen the wettest April, the wettest June and the wettest April-to-June period on record.
The cause has been the unusually southerly location of the jet stream, a high-altitude belt of wind; but it is expected to move northwards soon.
The northern Jet Stream, which carries wind around the entire northern hemisphere, moved south, as shown here;
This shows the normal path of the Jet Stream, which flows north into the Arctic, sending much of the wet weather and storms away from the coast of the UK. However, 2012 saw a very different pattern emerge;
The southern path of the Jet Stream pushed the rough weather normally found in the North Atlantic across continental Europe, sending storm surges and torrential rain across the country. As much of the UK lies at or below sea level, as is the case with South-East Queensland in Australia, and with storm surges coming out of the west towards the UK, coupled with high levels of rain in a short amount of time, areas of England flooded that have never experienced flooding before.
4–5 August saw localised flooding across the UK in Devon, Tyne and Wear, West Yorkshire and Southern Scotland from torrential rains, in places exceeding 30mm over a short time. This storm crossed the North Sea and was designated as extreme weather event "Frida" by the Norwegian Meteorological Institute. Rainfall totals up to 100mm in 24 hours across southern Norway and parts of Denmark resulted in flooding and landslips.
Source
As mentioned by Sheepslayer, the Arctic ice is receding at a dramatic pace. The IPCC Fourth Assessment Report is a governmental and scientific report on how climate change is affecting the ice melt and sea levels in the Arctic areas.
(Cont Below)
edit on 6/3/2013 by 74Templar because: ETA
Arctic sea ice extent
According to a study conducted by the National Center for Atmospheric Research and the National Snow and Ice Data Center, Arctic Sea ice is melting faster than predicted by climate models. The study concludes that the 18 models on which the IPCC has based its current recommendations could already be out of date, and that the retreat of the ice could already be 30 years ahead of the IPCC's worst case scenario, possibly leading to an ice-free summer Arctic before the end of the 21st century.
The IPCC [Working Group I] (2007) midrange projection for sea level rise this century is 20–43 cm (8–17 inches) and its full range is 18– 59 cm (7–23 inches). The IPCC notes that they are unable to evaluate possible dynamical responses of the ice sheets, and thus do not include any possible ‘rapid dynamical changes in ice flow’. Yet the provision of such specific numbers for sea level rise encourages a predictable public response that the projected sea level change is moderate, and smaller than in IPCC (2001). Indeed, there have been numerous media reports of ‘reduced’ sea level rise predictions, and commentators have denigrated suggestions that business-as-usual greenhouse gas emissions may cause a sea level rise of the order of meters.
With higher sea levels no doubt feeding into the southern areas of the Arctic, it seems likely the melting ice drives the weather southwards, thus we have a more southerly Jet Stream that forces the weather normally confined to the North Atlantic south, across continental Europe and the UK.
Arctic sea ice is an important component of the global climate system. The polar ice caps help to regulate global temperature by reflecting sunlight back into space. White snow and ice at the poles reflects sunlight, but dark ocean absorbs it. Replacing bright sea ice with dark ocean is a recipe for more and faster global warming. The Autumn air temperature over the Arctic has increased by 4 - 6°F in the past decade, and we could already be seeing the impacts of this warming in the mid-latitudes, by an increase in extreme weather events. Another non-trivial impact of the absence of sea ice is increased melting in Greenland. We already saw an unprecedented melting event in Greenland this year, and as warming continues, the likelihood of these events increase.
The impacts of an ice-free Arctic are far-reaching, and could be a trigger for abrupt, cataclysmic climate change in the future. Although it is difficult to see exactly how sea ice decline will impact the local and global environment, basic understanding of the Arctic as well as recent observations give us a good idea of how things might change.
Source
If the trend continues towards more Polar Ice melting, sea levels rising and generally the oceans warming more due to the lack of ice to deflect solar radiation back into space, the gathered data suggests that these extreme weather patterns will continue to plague us year after year, and worsen as each season passes. In short, the devastation will continue on worldwide coastlines, and storms, hurricanes and cyclones will intensify into what could only be called the perfect storm.
In my last part, I will review the effects of what these extreme weather events, rising sea levels and more intense weather systems could potentially mean for the future of humanity. And we will close by addressing the ultimate question of climate change.
Are we genuinely responsible for the changes in our planet?
In closing (The end of the world as we know it?)
The world is scared of this change, of that there is no doubt. Everyone from those at the top of government to those in the street all hear and are moved by this constant whisper of Global Warming and Climate Change, and what it all means.
But are these just buzz words to ultimately make us fear what is happening to our world? Or is it someone’s game plan to reap the riches of supposed cleaner living? Or, is indeed the result of humanity’s incessant march into the industrial revolution finally rearing its ugly head, and put quite simply, Mother Nature has had her fill of humans destroying and degrading this planet?
There are of course, a few factors to consider. The very idea of global warming, raised temperatures, a lack of drinkable water, even our major cities permanently underwater, breeds an innate fear in people. Naturally, fear in consumers is driven by greed in suppliers. So the big question really is, if global warming and climate change are just buzz words for the profiteers of this world, is the situation as bad as we are led to believe?
Everything from government (taxes) to businesses (profits) has a benefit in pushing the global warming agenda, and already we are beginning to see these changes, in Carbon Taxes springing up across countries the world over. Alternate means of powering our lives have become almost commonplace in the 21st century. Sadly, this is due to rising costs of basic energies, such as fuel and power, more than a need for change in how we use the resources of our planet.
There is also the reality of what we are doing to this world to consider. I have no doubt, through my studies of global warming/climate change, that we are, at least in part, responsible for extremity of the weather we have begun to see in recent years. We mine the planet of its riches; strip the land of the natural elements that are meant to be there such as forests and natural areas, building on areas designed by nature to stem the tide of floods, cyclones and other natural disasters, drive animals to extinction by removing and cutting off their habitats and breeding areas, and pump tonne after tonne of noxious gases such as carbon monoxide into the air through industry and the very inventions that are meant to make our lives easier.
Having said this, nature inadvertedly follows cycles. Ice ages, tropical periods, droughts, and the big wets we have seen. Follow the pattern back long enough, and nature reveals itself to have followed these patterns for longer than even we have been here. There has been extended drought periods throughout history, periods of extreme flooding that have followed on, some extreme, some minor. One way or the other, just like everything else in nature, the weather follows its cycles, no matter whether we are here to upset the balance or even play God with nature with industrialisation.
Then there is the last factor to consider. The world is no different in terms of climate than it ever has been.
The one difference?
Us.
We live now in a world of immediate communication. If there is a flood, a cyclone, a fire, anywhere in the world, social media and the instant nature of the internet guarantees us that every story, no matter how small, is reported upon, even if it is by an amateur recorder with a phone recording it as it happens. Sites such as this very one ensures the people across the world know instantly what is happening around them, whereas in the past we relied on the MSM and what they chose to report to inform us.
In saying this, there has been little change in the patterns of the world’s weather, but in the way we report it. It is my belief from this study, that we are so saturated in news these days, it is hard not see the continual reports of doom when it comes to the extremity of weather, and make the leap between that and our part as humans that we play in this ever changing world.
The ultimate question then is, are we responsible for this?
In short. Yes, we are. But not in the way you think.
new topics
-
President BIDEN Vows to Make Americans Pay More Federal Taxes in 2025 - Political Suicide.
2024 Elections: 5 minutes ago -
Ode to Artemis
General Chit Chat: 53 minutes ago -
Ditching physical money
History: 4 hours ago -
One Flame Throwing Robot Dog for Christmas Please!
Weaponry: 4 hours ago -
Don't take advantage of people just because it seems easy it will backfire
Rant: 4 hours ago -
VirginOfGrand says hello
Introductions: 5 hours ago -
Should Biden Replace Harris With AOC On the 2024 Democrat Ticket?
2024 Elections: 6 hours ago -
University student disciplined after saying veganism is wrong and gender fluidity is stupid
Education and Media: 8 hours ago -
Geddy Lee in Conversation with Alex Lifeson - My Effin’ Life
People: 9 hours ago -
God lived as a Devil Dog.
Short Stories: 10 hours ago
top topics
-
Hate makes for strange bedfellows
US Political Madness: 14 hours ago, 20 flags -
Who guards the guards
US Political Madness: 17 hours ago, 13 flags -
University student disciplined after saying veganism is wrong and gender fluidity is stupid
Education and Media: 8 hours ago, 12 flags -
Police clash with St George’s Day protesters at central London rally
Social Issues and Civil Unrest: 11 hours ago, 9 flags -
TLDR post about ATS and why I love it and hope we all stay together somewhere
General Chit Chat: 12 hours ago, 7 flags -
Should Biden Replace Harris With AOC On the 2024 Democrat Ticket?
2024 Elections: 6 hours ago, 5 flags -
Don't take advantage of people just because it seems easy it will backfire
Rant: 4 hours ago, 4 flags -
One Flame Throwing Robot Dog for Christmas Please!
Weaponry: 4 hours ago, 4 flags -
God lived as a Devil Dog.
Short Stories: 10 hours ago, 3 flags -
Ditching physical money
History: 4 hours ago, 3 flags
active topics
-
Hundreds of teenagers flood into downtown Chicago, smashing car windows
Other Current Events • 111 • : 777Vader -
President BIDEN Vows to Make Americans Pay More Federal Taxes in 2025 - Political Suicide.
2024 Elections • 0 • : WeMustCare -
Should Biden Replace Harris With AOC On the 2024 Democrat Ticket?
2024 Elections • 43 • : YourFaceAgain -
British TV Presenter Refuses To Use Guest's Preferred Pronouns
Education and Media • 125 • : Annee -
University student disciplined after saying veganism is wrong and gender fluidity is stupid
Education and Media • 22 • : ImagoDei -
Who guards the guards
US Political Madness • 4 • : kwaka -
New whistleblower Jason Sands speaks on Twitter Spaces last night.
Aliens and UFOs • 44 • : pianopraze -
"We're All Hamas" Heard at Columbia University Protests
Social Issues and Civil Unrest • 263 • : YourFaceAgain -
Remember These Attacks When President Trump 2.0 Retribution-Justice Commences.
2024 Elections • 50 • : Asher47 -
Ode to Artemis
General Chit Chat • 0 • : BrotherKinsMan
17