It looks like you're using an Ad Blocker.
Please white-list or disable AboveTopSecret.com in your ad-blocking tool.
Thank you.
Some features of ATS will be disabled while you continue to use an ad-blocker.

Japan Preliminary Earthquake Maps NIED
page: 2share:
24 hours 41 minutes period this time
09/01/2013 11:45:49JST (09/01/2013 02:45:49UTC)
to
10/01/2013 12:26:59JST (10/01/2013 03:26:59UTC)
not sure about some of the text locations on the tags, the biggest quake is a 4.1 near Niigata on the west coast of Honshu, but the program came up with "Eastern Honshu"
I might have to use the slower Batch Reverse Geocoding and get the actual addresses.
next time
10/01/2013 12:33:47 to 11/01/2013 12:12:28JST
(10/01/2013 03:33:47 to 11/01/2013 03:12:28UTC)
I ran that one through the batch Geocoder to get the addresses, took 7 1/2 minutes to process the 236 lines, not much better either, anything offshore is blank and any Japanese writing is not converted to English by Google Earth, its just put in as ????????.
So I ran it through the FE Regions Finder to get the offshore stuff and combined them.
map of the period 11/01/13 03:36:13 to 12/01/13 03:12:13UTC
I have reverted to FE Regions for the locations, will stick with that.
summary
mag
I have reverted to FE Regions for the locations, will stick with that.
summary
mag
yep found the old Hierro graphs.
I've saved it as a template and adjusted to fit the Japan data.
Its a bit more complicated though as the data I'm mapping here transcends two 24 hour periods and the graph is just 00:00:00 to 23:59:59
So had to make two graphs and stitch them together. Its a bit like doing a search on ANSS for Alaska data where the area transcends the anti-meridian so you have to do two seperate searches to complete the area.
At first glance it doesn't look much different than the numbered 0-271 graph, but if you look closely you will see the lines are slightly different. I've marked on this one the differences.
So this graph is more accurate and at a glance you can see when things were quiet for a period ( the lines stretch out width wise more and the opposite too, when they are compressed there were a lot of quakes in a short period of time..
the two black dots are where the first graph ended and the second one started
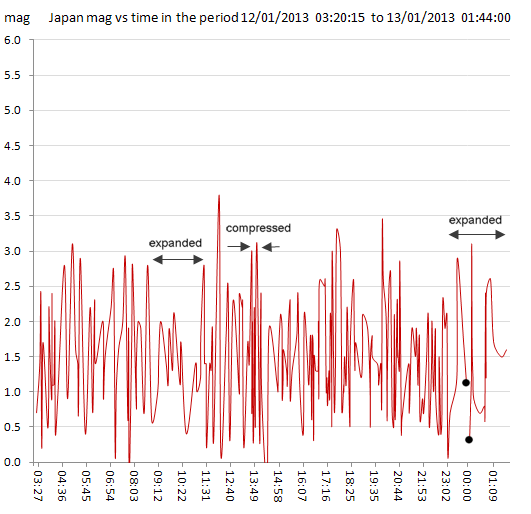
just need to add the vertical grid lines and maybe add some more time marks and good to go
I've saved it as a template and adjusted to fit the Japan data.
Its a bit more complicated though as the data I'm mapping here transcends two 24 hour periods and the graph is just 00:00:00 to 23:59:59
So had to make two graphs and stitch them together. Its a bit like doing a search on ANSS for Alaska data where the area transcends the anti-meridian so you have to do two seperate searches to complete the area.
At first glance it doesn't look much different than the numbered 0-271 graph, but if you look closely you will see the lines are slightly different. I've marked on this one the differences.
So this graph is more accurate and at a glance you can see when things were quiet for a period ( the lines stretch out width wise more and the opposite too, when they are compressed there were a lot of quakes in a short period of time..
the two black dots are where the first graph ended and the second one started
just need to add the vertical grid lines and maybe add some more time marks and good to go
edit on 13-1-2013 by muzzy because: (no reason
given)
Note: disregard the title on that last chart, I forgot to change the templates text there
This is all a work in development
The feed back has been overwhelming ie I don't know why I bother.
Who seen the change of movement to the west over the last few days eh?
This is all a work in development
The feed back has been overwhelming ie I don't know why I bother.
Who seen the change of movement to the west over the last few days eh?
edit on 14-1-2013 by muzzy because: (no reason given)
Originally posted by muzzy
Note: disregard the title on that last chart, I forgot to change the templates text there
This is all a work in development
The feed back has been overwhelming ie I don't know why I bother.
Who seen the change of movement to the west over the last few days eh?edit on 14-1-2013 by muzzy because: (no reason given)
keep up the good work appreciate the graphs and the info. Thankx
thanks for the encouragement lurksoften
I couldn't be bothered last night, but here is the map now anyway
15/01/2013 04:26:28 to 16/01/2013 08:41:56UTC
movement is back to the east
Four 4's Near or Off East Coast Of Honshu
I couldn't be bothered last night, but here is the map now anyway
15/01/2013 04:26:28 to 16/01/2013 08:41:56UTC
movement is back to the east
Four 4's Near or Off East Coast Of Honshu
reply to post by muzzy
Thank you.
This is great.
I guess I'm becoming kind of an earthquake geek. I learn so much from you all.
to add:
Thank you.
This is great.
I guess I'm becoming kind of an earthquake geek. I learn so much from you all.
to add:
edit on 16-1-2013 by crappiekat because: too add
up to an hour ago;
16/01/2013 08:49:51 to 17/01/2013 02:59:57UTC
shows
Lat/Long: 42.2073 144.8395
UTC: 16/01/2013 23:32:47
JST: 17/01/2013 08:32:47
Depth: 19.9 km
Mag: 5.0 ML
Location: Hokkaido. Japan Region
interesting, no 4's at all
16/01/2013 08:49:51 to 17/01/2013 02:59:57UTC
shows
Lat/Long: 42.2073 144.8395
UTC: 16/01/2013 23:32:47
JST: 17/01/2013 08:32:47
Depth: 19.9 km
Mag: 5.0 ML
Location: Hokkaido. Japan Region
interesting, no 4's at all
reply to post by crappiekat
Good
Japan is becoming an obsession for me, the more I look into it, the more I want to know.
I'm looking at the various FE regions, (thats the addresses on the tags), at the moment I have no clue as to where the borders are. I have a pdf file somewhere that I'll try and figure out how to convert the vectors to a kml file then I can map them too.
I haven't been putting the TTNT energy released on these files, but its easy enough to do, just add another column.
Then I can add up the energy released for each area during each period.
Like on that last map the areas where;
Eastern Honshu. Japan
Eastern Sea Of Japan
Hokkaido. Japan Region
Kuril Islands
Kyushu. Japan
Near East Coast Of Honshu. Japan
Near S. Coast Of Honshu. Japan
Near S. Coast Of Western Honshu
Near West Coast Of Honshu. Japan
Shikoku. Japan
Western Honshu. Japan
but thats not them all
Its all a bit confusing, because on the NIED reviewed data they have the areas broken down even further into Prefectures.
I've made my first Japan FE region KMZ file, for 228-near the East Coast of Honshu
Took a while, Puterman and I did this for New Zealand about a year ago, but I had forgotten how to do the filling of the polygon and set the opacity.
here is 228-near the East Coast of Honshu
There are 30 FE regions more that fit within the basic map size I do for Japan, once I plot them all I'll group them all into one single file which will come up with one click, similar to the Plate Boundries file.
One name that is missing from the FE lists is "Far off the East Coast of Honshu", that shows on the NIED "reviewed" data, not sure if it is part of 229-off the East Coast of Honshu, or JMA just made it up, from what I have seen on the locations that are marked with this name so far it appears to be the eastern side of the Japan Trench, JMA name events on the western side as "FAR E OFF FUKUSHIMA PREF" or "FAR E OFF SANRIKU" or whatever, but that's a different kettle of fish anyway (the reviewed data)
Ha did another one
227-Eastern Honshu
I was particularly interested to see that one, as I couldn't figure how Niigata ended up as eastern Honshu when it is on the west coast (as per this post on the 10th Jan).
"North and Central Honshu" would have made more sense to me
I won't post any more until I get them all done, should get through it this weekend, Monday is a holiday for us here
edit on 17-1-2013 by
muzzy because: (no reason given)
interactive map for 17/01/2013 03:01:30 to 18/01/2013 03:55:16UTC
includes this one
with 9 aftershocks
also the Tonnes of TNT energy released by F_E Region
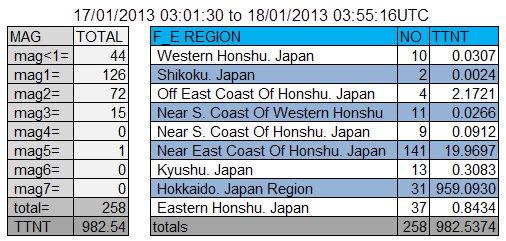
.................... see where I'm going with this?
obviously a mag 5 pumps the energy out, it takes a lot of 3's to make a 5
9 of those 141 Near East Coast Of Honshu. Japan were 3's, making up the bulk of the TTNT at 17.32TTNT
I could break it down further and have the columns for each magnitude for each region, need to write some more Excel formulas.
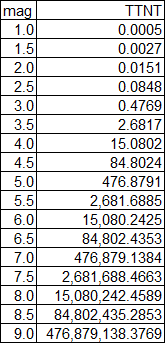
for those readers not familiar with the conversion of magnitude to Tonnes of TNT energy released here are some examples.
includes this one
Lat/Long: 42.0552 142.7449
UTC: 17/01/2013 05:13:23
JST: 17/01/2013 14:13:23
Depth: 50.6 km
Mag: 5.2 ML
Location: Hokkaido. Japan Region
Energy Released: 951.5 tonnes of TNT
with 9 aftershocks
also the Tonnes of TNT energy released by F_E Region
.................... see where I'm going with this?
obviously a mag 5 pumps the energy out, it takes a lot of 3's to make a 5
9 of those 141 Near East Coast Of Honshu. Japan were 3's, making up the bulk of the TTNT at 17.32TTNT
edit on 18-1-2013 by muzzy because: (no reason given)
I could break it down further and have the columns for each magnitude for each region, need to write some more Excel formulas.
edit on
18-1-2013 by muzzy because: (no reason given)
for those readers not familiar with the conversion of magnitude to Tonnes of TNT energy released here are some examples.
edit on 18-1-2013 by muzzy because: (no reason given)
You would think someone would have already done this, but I couldn't find anything that was useable on the Internet.
Exclusive Global Release right here on ATS
KML version of Japans Flinn-Engdahl regions (or F-E regions)
I made 2 versions.
1. Interactive with each region having a different colour 30% opacity, so you can see the map or land form behind. Japan F_E Regions V1.0
2. A simple interactive lined version Japan F_E Regions V2.0
You can save either version to Google Earth by copying the file link address from the Google Maps search bar and paste it into your browser address bar. Providing you already have Google Earth, it should open directly when you click go.
The lined version doesn't stand out very well on Google Earth as the lines are black, but you can easily open the first sub folder and right click Properties/Style,Color on the file and change the lines to whatever colour you want. It looks great on Google Satelitte though
As with all the Google Maps I do you can click or unclick each sub file as you wish. Actually works better with lines than it does with icons.
For readers who have no clue what I'm talking about ....................
These are the names that appear in the popup tags off each icon on my interactive maps here and elsewhere.
Took me about a day to plot all the polygons, doing one or three here and there as I had time.
Theoretically given time if you search "F_E Regions KML files" on Google, it should bring you back to this page.
The resource I used is an oldish pdf by J.B. Young , B.W. Presgrave, H. Aichele, D.A. Wiens , E.A. Flinn
called "The Flinn-Engdahl Regionalisation Scheme: the 1995 revision]
original copy available here.
Exclusive Global Release right here on ATS
KML version of Japans Flinn-Engdahl regions (or F-E regions)
I made 2 versions.
1. Interactive with each region having a different colour 30% opacity, so you can see the map or land form behind. Japan F_E Regions V1.0
2. A simple interactive lined version Japan F_E Regions V2.0
You can save either version to Google Earth by copying the file link address from the Google Maps search bar and paste it into your browser address bar. Providing you already have Google Earth, it should open directly when you click go.
The lined version doesn't stand out very well on Google Earth as the lines are black, but you can easily open the first sub folder and right click Properties/Style,Color on the file and change the lines to whatever colour you want. It looks great on Google Satelitte though
As with all the Google Maps I do you can click or unclick each sub file as you wish. Actually works better with lines than it does with icons.
For readers who have no clue what I'm talking about ....................
The Flinn-Engdahl regions (or F_E regions) are a division of the Earth into seismic zones. In seismology, it is the standard of localizing earthquakes. The scheme was proposed in 1965 by Edward A. Flinn and E. R. Engdahl. The first official definition was published in 1974 and a revision in 1995. Borders of the F-E regions may differ from political boundaries. For instance, the F-E region 545 ("Northern Italy") also includes parts of France, Switzerland, Austria and Slovenia. After the 1995 revision there are 754 F-E regions, subsequently numbered from 1 to 757 with three gaps (172, 299 and 550) at dissolved regions. (wikipedia)
These are the names that appear in the popup tags off each icon on my interactive maps here and elsewhere.
Took me about a day to plot all the polygons, doing one or three here and there as I had time.
Theoretically given time if you search "F_E Regions KML files" on Google, it should bring you back to this page.
The resource I used is an oldish pdf by J.B. Young , B.W. Presgrave, H. Aichele, D.A. Wiens , E.A. Flinn
called "The Flinn-Engdahl Regionalisation Scheme: the 1995 revision]
original copy available here.
Thought I would try something different this evening,
I have always preferred Open Street Map maps, they are clean and easy to read IMO, but unfortunately you cannot create interactive maps with them in the manner that Google Maps offers.
So here is an alternative
A screenshot of the days events in Japan on Open Street Maps.
Click it and it opens (in a new tab/window) the interactive Google Maps version.
As a bonus I have centered that (the interactive Gmap) on the spot mentioned in the comment text below the screenshot
Killed 3 birds with one stone
o/s Choshi finally popped a 5, been watching that peninsula for months now, always a cluster of quakes every day, first time I've seen one that big amongst them (since the 2011 mag 9.0 aftershock sequence)
there.
Actually 4 birds with one stone, I stamped the time period on the screenshot too.
Don't forget you can oom out on the GMap too see all the other events and click on them for the data too.
edit on 21-1-2013 by muzzy because:
(no reason given)
new topics
-
Michigan school district cancels lesson on gender identity and pronouns after backlash
Education and Media: 2 minutes ago -
When an Angel gets his or her wings
Religion, Faith, And Theology: 55 minutes ago -
Comparing the theology of Paul and Hebrews
Religion, Faith, And Theology: 1 hours ago -
Pentagon acknowledges secret UFO project, the Kona Blue program | Vargas Reports
Aliens and UFOs: 2 hours ago -
Boston Dynamics say Farewell to Atlas
Science & Technology: 2 hours ago -
I hate dreaming
Rant: 3 hours ago -
Man sets himself on fire outside Donald Trump trial
Mainstream News: 5 hours ago -
Biden says little kids flip him the bird all the time.
Politicians & People: 5 hours ago -
The Democrats Take Control the House - Look what happened while you were sleeping
US Political Madness: 6 hours ago -
Sheetz facing racial discrimination lawsuit for considering criminal history in hiring
Social Issues and Civil Unrest: 6 hours ago
top topics
-
The Democrats Take Control the House - Look what happened while you were sleeping
US Political Madness: 6 hours ago, 16 flags -
In an Historic First, In N Out Burger Permanently Closes a Location
Mainstream News: 8 hours ago, 14 flags -
A man of the people
Medical Issues & Conspiracies: 13 hours ago, 8 flags -
Biden says little kids flip him the bird all the time.
Politicians & People: 5 hours ago, 8 flags -
Man sets himself on fire outside Donald Trump trial
Mainstream News: 5 hours ago, 7 flags -
Pentagon acknowledges secret UFO project, the Kona Blue program | Vargas Reports
Aliens and UFOs: 2 hours ago, 5 flags -
4 plans of US elites to defeat Russia
New World Order: 15 hours ago, 4 flags -
Sheetz facing racial discrimination lawsuit for considering criminal history in hiring
Social Issues and Civil Unrest: 6 hours ago, 3 flags -
Boston Dynamics say Farewell to Atlas
Science & Technology: 2 hours ago, 3 flags -
Are you ready for the return of Jesus Christ? Have you been cleansed by His blood?
Religion, Faith, And Theology: 10 hours ago, 3 flags
active topics
-
I hate dreaming
Rant • 6 • : Hecate666 -
Israeli Missile Strikes in Iran, Explosions in Syria + Iraq
World War Three • 102 • : DumbNut -
Michigan school district cancels lesson on gender identity and pronouns after backlash
Education and Media • 0 • : Consvoli -
The Democrats Take Control the House - Look what happened while you were sleeping
US Political Madness • 61 • : Threadbarer -
Man sets himself on fire outside Donald Trump trial
Mainstream News • 32 • : cherokeetroy -
Pentagon acknowledges secret UFO project, the Kona Blue program | Vargas Reports
Aliens and UFOs • 5 • : Ophiuchus1 -
-@TH3WH17ERABB17- -Q- ---TIME TO SHOW THE WORLD--- -Part- --44--
Dissecting Disinformation • 546 • : MetalThunder -
Boston Dynamics say Farewell to Atlas
Science & Technology • 4 • : Terpene -
12 jurors selected in Trump criminal trial
US Political Madness • 111 • : WeMustCare -
Election Year 2024 - Interesting Election-Related Tidbits as They Happen.
2024 Elections • 68 • : WeMustCare