It looks like you're using an Ad Blocker.
Please white-list or disable AboveTopSecret.com in your ad-blocking tool.
Thank you.
Some features of ATS will be disabled while you continue to use an ad-blocker.

Quake Watch 2013
page: 9share:
Originally posted by Phantasm
Originally posted by Phantasm
2.9 just happened in Marion,Illinois...the New Madrid.
Some interesting activity to keep an eye on. There's been a few of these in the passed week on that fault.
Downgraded to a 2.7 magnitude.
Thank you for posting. I keep an eye on the New Madrid because I live in Illinios.
quake model looks for 'big one' in NW
I just caught this on a science site I monitor. It looks like the worry level is building around the Cascadia subduction zone.
SOURCE
PORTLAND - New research is giving us some insight into when a major earthquake could strike the Northwest.
The research was done in part by Stanford geophysics Professor Paul Segall. He has been tracking a series of very small tremors that rumble deep within the earth.
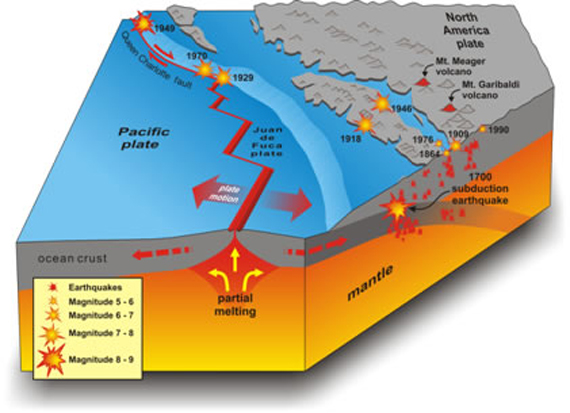
Over the last decade, data shows the tremors have been getting progressively bigger. Last summer, the Pacific Northwest experienced a notably large one.
Experts believe those tremors are adding stress to the offshore fault.
edit on 11-1-2013 by happykat39 because: added picture
In response to recent comments about "mag 5's are/were down", or "they are back to normal"
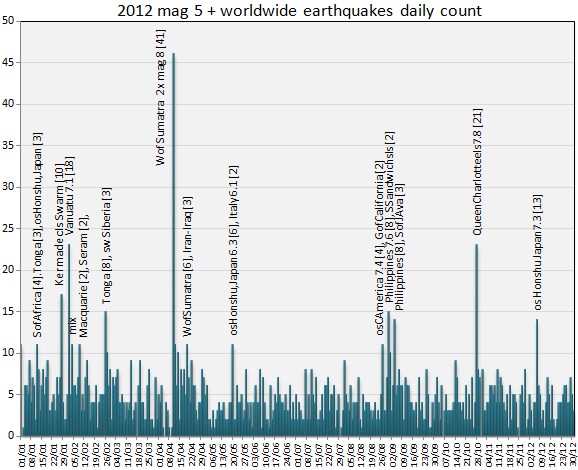
Lets have a look at a 12 month period and just see how those perceptions of how many quakes above mag 5 per day is "normal" stack up
data from ANSS ( easiest to get all the data in one click)
here is a graph of 2012, (1746 events)
I've marked the days above 10 per day with the locations of the majority of quake locations within that days count, with the number in brackets
number per day and %
0= 8 (2.19%)
1= 24 (6.56%)
2= 56 (15.30%)
3= 47 (12.84%)
4= 72 (19.67%)
5= 44 (12.02%)
6= 44 (12.02%)
7= 26 (7.10%)
8= 18 (4.92%)
9= 8 (2.19%)
10-20= 16 (4.37%)
>20= 3 (0.82%)
as expected its the biguns ( a 7+) that pump the daily numbers up, only thrice in 2012 was the count above 10 when the quakes where scattered about the planet, 21/01, 04/02, and 09/02
so based on 2012 anything between 2 and 6 per day would seem to be the norm. with 4 per day standing out at nearly 20%.
To have 0-1 per day is rare, as is more than 8.
While I was a it, heres a list of the top 20
(some entries are combined, others are separate, its based on FE geological regions, not political regions)
102 ~ Near and Off East Coast Of Honshu. Japan
82 ~ Off W Coast Of Northern Sumatra and N Indian Ocean
81 ~ Tonga Is and Tonga islands Region
77 ~ Luzon, Samar, Philippine Islands Region
62 ~ Vanuatu Islands
46 ~ New Britain and New Ireland Region. P.N.G.
45 ~ Kuril Islands
37 ~ Fiji Islands Region
36 ~ Kermadec Is and Kermadec Islands Region
35 ~ South Sandwich Islands Region
33 ~ South Of Fiji Islands
32 ~ Queen Charlotte Islands Region
28 ~ Solomon Islands
24 ~ Near Coast Of Central Chile
24 ~ Southern Sumatra. Indonesia
22 ~ Banda Sea
21 ~ Northern Molucca Sea
19 ~ Northern Sumatra. Indonesia
18 ~ Irian Jaya Region. Indonesia
edit on 11-1-2013 by muzzy because: spelling, and 3 attempts to get the image to fit the page without a scroll bar, seems 578 pixels is the
maximum
Thanks for the 4 stars
Ya'all probably want a map of those eh
here you go
ANSS Mag5_+ 2012
note to add: I made a mistake in adding up those FE area top 20 figures, I included the 5 days into 2013 that was in the data.
But the 2012 graph and the daily totals are 01-01-2012 00:00:00 to 01-01-2013
Ya'all probably want a map of those eh
here you go
ANSS Mag5_+ 2012
note to add: I made a mistake in adding up those FE area top 20 figures, I included the 5 days into 2013 that was in the data.
But the 2012 graph and the daily totals are 01-01-2012 00:00:00 to 01-01-2013
reply to post by muzzy
You could of course also look at my weekly geophysical report which documents a rolling yearly total of Mag5, Mag 6 etc quakes. This week's report will be available in about 2 hours from now.
See the link in my signature. The report links to a more detailed version on my blog.
The average is 3.9 currently over the rolling year with an average of 7.3 Terajoules per quake which is an average magnitude (converted back) of 5.38. See the statistics table in the geophysical report.
You could of course also look at my weekly geophysical report which documents a rolling yearly total of Mag5, Mag 6 etc quakes. This week's report will be available in about 2 hours from now.
See the link in my signature. The report links to a more detailed version on my blog.
To have 0-1 per day is rare, as is more than 8.
The average is 3.9 currently over the rolling year with an average of 7.3 Terajoules per quake which is an average magnitude (converted back) of 5.38. See the statistics table in the geophysical report.
edit on 12/1/2013 by PuterMan because: (no reason given)
reply to post by happykat39
By the look of activity the past few days... I do wonder if there is a genuine fear ~ myself.
By the look of activity the past few days... I do wonder if there is a genuine fear ~ myself.
Off the coast of Oregon:
4.3 247km WNW of Bandon, Oregon 2013-01-12 06:19:51 43.631°N 127.382°W 10.1
earthquake.usgs.gov...
4.3 247km WNW of Bandon, Oregon 2013-01-12 06:19:51 43.631°N 127.382°W 10.1
earthquake.usgs.gov...
reply to post by happykat39
I found the comments more interesting than the article, and have to agree with them.
As has been shown in Christchurch the Insurance industry cannot be relied on to help get your life back in order, rebuild your home etc, and that was just a 7.1./6.4/6.3/6.0
With so many disasters in the last 10 years the Insurance industry is broke.
I found the comments more interesting than the article, and have to agree with them.
smith5870400119 1 day ago
Why is this news, and just what the hey is anyone going to do about it? I guess it just gives scientists something to do, while trying to justify another grant.
January 10, 2013 at 6:42 PM
sbenez4018002797 18 hours ago
I totally agree with Ismith. Saying that a magnitude 9 earth quake is huge, but then to add it could be as far out as 100 years is a good way to make folks buy Earthquake Insurance, if there even is such a thing. How are people supposed to prepare for that?? less
As has been shown in Christchurch the Insurance industry cannot be relied on to help get your life back in order, rebuild your home etc, and that was just a 7.1./6.4/6.3/6.0
With so many disasters in the last 10 years the Insurance industry is broke.
edit on 12-1-2013 by muzzy because: (no reason given)
reply to post by PuterMan
I see you use USGS 7 days for your data.
How do you find ANSS compares?
I'm thinking of changing to ANSS for my USA maps, its easier to get the data if its over 7 days old.
(QVS DataPro is broken)
I was looking over the ANSS 2012 data file again and found the numbers of mag types
Mw= 594
mb= 1028
ML= 99, 3 above 6.0, Fiji Islands Region [2], and SW Of Sumatra
Unk= 10, 3 above 6.0, Queen Charlotte Islands [2] and Off W. Coast Of Baja California
Ms= 2
Total= 1733
Do you make allowances for those 6 ML and Unk mag 6's when you take your data off for the Mag 6.0-6.9 chart/graph?
Often when converted to Mw or mb they might be less than 6.0
it could skew the data and the graph.
same with the 6.8-7.2 range, probably a lot of "floaters"
on the same vein can we assume that say a 5.0Mw is going to be a 5.0mb as well?
Its something I haven't looked at yet.
All goes back to that big quake we had in July S of Taranaki, Geonet said (and still does) 7.148ML, while the others were saying 6.3mb at the time. Now I see ANSS has it at 6.3Mw. At least they agreed on the depth.
Can someone please check the NIED UStream feed & tell me if it's loading or not for them? I have the perpetual loading icon happening, for about an
hour now every time I go to the page. I've cleared my cache & even rebooted, but it's still seemingly stuck at loading.
NIED stream
NIED stream
reply to post by operation mindcrime
Thanks for taking a look, now I know for sure it's not something wrong on my end.
Muzzy, about the LDEO page a moment. I see that the data is being pulled from a USGS page, but I'm noticing some earthquakes listed on the LDEO page aren't on the linked page from the USGS. I'm a little confused, am I missing something obvious? *scratches head in confusion*
reply to post by Nyiah
I think California was off line for a while there, I had trouble connecting to GPS Visualiser for the last hour.
LDEO are seperate from USGS, they do their own locating, I think they use LISS graphs but I'm not 100%sure, LDEO are not communicative at all. Their locations are to the 0.25 Lat/Long, so are just a guide.
They seem to pick up the Oceanic events well, that is why I use them, confirmation is usually available on the LISS SNZO graph if you compare the timing.
I'm having a big rethink on who I'm going to use on my eqarchives, Turkey is already under reconstruction using the Turkish Republic Disaster and Emergency Management Presedency, Earthquake Department (official Govt site which has a better search facility, and more locations BTW) to replace the Bogazici University Kandilli Observatory and Earthquake Research Institute which only goes back 30 days down to 3.0.
and as I mentioned I'm thinking of redoing USGS using ANSS, there are a few issues though (will mention them in a minute)
I just did a test run of ANSS compared to USGS for the Continental USA that I had already mapped for November 2012.
These were on USGS but not ANSS
3.0, 02/11/2012 20:23:42, 38.8082, -122.792, 2.3, Northern California
4.3, 04/11/2012 09:53:09, 24.5042, -110.1831, 10.4, Gulf of California
3.0, 04/11/2012 17:03:01, 34.1697, -117.6673, 3, Greater Los Angeles area. California
3.7, 22/11/2012 17:26:31, 31.3005, -115.6422, 6, 64km NE of Camalu, Mexico
3.1, 26/11/2012 09:32:36, 40.4232, -126.762, 0.1, 212km W of Ferndale, California
3.0, 27/11/2012 15:17:21, 35.7847, -117.2667, 6.6, 12km E of Searles Valley, California
3.0, 01/11/2012 03:24:19, 39.2445, -122.7155, 16.7, Northern California
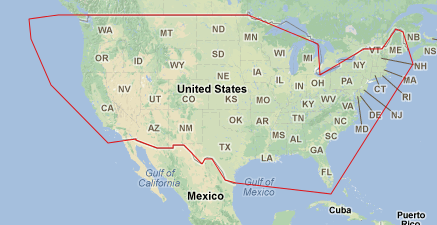
I can understand the two striked out, they were outside the boundary I've created for ANSS Continental USA which basically follows the Canadian and Mexican borders for north and south, and runs offshore a bit to cover Jaun de Fuca plate. I don't know how Mexico and Baja got mixed in there, I must have used their newfangledinteractivemapthingy which does it in rectangles.
I'll go check say 2.8 upwards and see if those 3.0's were downgraded
These were shown on ANSS, but not USGS, and looking at the magnitudes I would hazard a guess they have been added since the end of November when I did the USGS download.
4.2, 07/11/2012 13:06:58, 44.673, -129.216, 10, Off Coast Of Oregon
4.2, 07/11/2012 13:07:31, 44.673, -129.216, 5, Off Coast Of Oregon
3.3, 13/11/2012 13:40:05, 39.0457, -123.0908, 3, Near Coast Of Northern Calif.
3.4, 13/11/2012 13:40:57, 39.047, -123.091, 0, Near Coast Of Northern Calif.
3.2, 30/11/2012 03:19:48, 33.7317, -118.8162, 1.76, Southern California
3.0, 30/11/2012 06:06:52, 43.289, -106.768, 5, Wyoming
As you can see with the 2nd list there are duplications (underlined), having read the instructions now, they do list the same quake more than once if 2 local networks did a seperate reading.
That could complicate things as the ID numbers are different, as is just about everything else in the line, but they are the same quake, the main difference is the source.
I don't want to be mapping duplicates.
easy enough to eyeball them when there are only 30 lines, but when it comes to Alaska there are 100+ lines per month to check
These were on USGS but not ANSS
3.0, 02/11/2012 20:23:42, 38.8082, -122.792, 2.3, Northern California
3.0, 04/11/2012 17:03:01, 34.1697, -117.6673, 3, Greater Los Angeles area. California
3.1, 26/11/2012 09:32:36, 40.4232, -126.762, 0.1, 212km W of Ferndale, California
3.0, 27/11/2012 15:17:21, 35.7847, -117.2667, 6.6, 12km E of Searles Valley, California
3.0, 01/11/2012 03:24:19, 39.2445, -122.7155, 16.7, Northern California
I can understand the two striked out, they were outside the boundary I've created for ANSS Continental USA which basically follows the Canadian and Mexican borders for north and south, and runs offshore a bit to cover Jaun de Fuca plate. I don't know how Mexico and Baja got mixed in there, I must have used their newfangledinteractivemapthingy which does it in rectangles.
I'll go check say 2.8 upwards and see if those 3.0's were downgraded
These were shown on ANSS, but not USGS, and looking at the magnitudes I would hazard a guess they have been added since the end of November when I did the USGS download.
4.2, 07/11/2012 13:06:58, 44.673, -129.216, 10, Off Coast Of Oregon
4.2, 07/11/2012 13:07:31, 44.673, -129.216, 5, Off Coast Of Oregon
3.3, 13/11/2012 13:40:05, 39.0457, -123.0908, 3, Near Coast Of Northern Calif.
3.4, 13/11/2012 13:40:57, 39.047, -123.091, 0, Near Coast Of Northern Calif.
3.2, 30/11/2012 03:19:48, 33.7317, -118.8162, 1.76, Southern California
3.0, 30/11/2012 06:06:52, 43.289, -106.768, 5, Wyoming
As you can see with the 2nd list there are duplications (underlined), having read the instructions now, they do list the same quake more than once if 2 local networks did a seperate reading.
That could complicate things as the ID numbers are different, as is just about everything else in the line, but they are the same quake, the main difference is the source.
I don't want to be mapping duplicates.
easy enough to eyeball them when there are only 30 lines, but when it comes to Alaska there are 100+ lines per month to check
edit on
12-1-2013 by muzzy because: (no reason given)
edit on 12-1-2013 by muzzy because: (no reason given)
Originally posted by muzzy
reply to post by PuterMan
I see you use USGS 7 days for your data.
How do you find ANSS compares?
After the seven days - or now 30 days - the only source is ANSS and there are many small changes.
I'm thinking of changing to ANSS for my USA maps, its easier to get the data if its over 7 days old.
(QVS DataPro is broken)
Drop the database and it should start working again. You must have gone over the time limit on manual downloads. We can catch back up again later.
I was looking over the ANSS 2012 data file again and found the numbers of mag types
Mw= 594
mb= 1028
ML= 99, 3 above 6.0, Fiji Islands Region [2], and SW Of Sumatra
Unk= 10, 3 above 6.0, Queen Charlotte Islands [2] and Off W. Coast Of Baja California
Ms= 2
Total= 1733
Do you make allowances for those 6 ML and Unk mag 6's when you take your data off for the Mag 6.0-6.9 chart/graph?
The data is NOT converted at present as it is way too long before the ANSS (PDE) settles and the data would be way out of data however, running an exercise on data up to November of 2012 from the start of the year produces energy values which when converted back are
8.75028766 "as is"
8.740596934 "converted"
That difference is the equivalent of a single Mag 7.76
Converting mb to Mw and ML to Mw and leaving everything else as stated:
There are 1421 Mag 5-5.99 using "as is" and 6089 Mag 5-5.99 using "converted" - something I have already noted on the thread either this or last year. The reason for this staggering difference is the conversion of mb to Mw.
There are 118 Mag 6 using "as is" and 122 Mag 6 using "converted".
There are 13 Mag 7 using "as is" and 13 Mag 7 using "converted".
It is a major problem and I shall be looking at it but for the time being the figures are all "as is"
Often when converted to Mw or mb they might be less than 6.0
it could skew the data and the graph.
same with the 6.8-7.2 range, probably a lot of "floaters"
mb converts to a lower value in Mw after Mag 7 and since mag 7 in mb is above saturation it cannot be considered reliable.
on the same vein can we assume that say a 5.0Mw is going to be a 5.0mb as well?
Its something I haven't looked at yet.
A 5 Mw is about a 4.45 mb hence the huge difference above.
All goes back to that big quake we had in July S of Taranaki, Geonet said (and still does) 7.148ML, while the others were saying 6.3mb at the time. Now I see ANSS has it at 6.3Mw. At least they agreed on the depth.
A 7.1 ML is a ~6.7 Mw so the ANSS value is low. EMSC is even lower @6.2 Mw. There always seems to be this difference between GeoNet and the rest. One would need to know the formula for converting the NZ ML to Mw as it will not be the same as other regions.
Even attempting to convert all to Mw is fraught with problems but should level the playing field a little. Eventually I will get round to sorting this on the weekly reports.
reply to post by PuterMan
cheers for explaining that
how long does it take ANSS to "settle"?
probably they keep reviewing the data for years?
Its probably a long term plan to map right back to 1898, hense the interest in ANSS, not sure if the Centennial List goes as low as ANSS???
cheers for explaining that
how long does it take ANSS to "settle"?
probably they keep reviewing the data for years?
Its probably a long term plan to map right back to 1898, hense the interest in ANSS, not sure if the Centennial List goes as low as ANSS???
Originally posted by muzzy
reply to post by PuterMan
cheers for explaining that
how long does it take ANSS to "settle"?
probably they keep reviewing the data for years?
Its probably a long term plan to map right back to 1898, hense the interest in ANSS, not sure if the Centennial List goes as low as ANSS???
Officially I understand that ANSS can change anything up to 2 years from the event date but for out purposes I think 6 months is OK. I consider data after 6 months to be stable.
The Centennial goes nowhere near as low as ANSS but here you have a problem as the lower values are also not on ANSS. Basically before 1963 the Centennial and ANSS seem to be very similar and are good for M6.5 back to 1930s and M7 before that. There are some big differences however. In reality anything earlier than 1970 with a magnitude of less than M6.5 is not going to be the same in each catalogue.
A long time ago I did a chart showing how the number of stations greatly affected these values. The increase in stations has been massive but there are also many to which we do not have data access. Even Greek long dated lists are not going to be accurate since they are adding stations all the time and older records could be missing data.
It is an inaccurate science I am afraid and will be for a hundred years or so until a modern valued data set has been constructed - and even that will be missing data!
reply to post by PuterMan
thanks again, you saved me having to plug in my portable hard drive to go have a look at the Centennial.
Yes all the networks seem to struggle for data prior to the 1940's.
I might do ANSS instead of USGS despite the duplication issues, seems easier at this stage.
this is the polygon I set up for the Continental USA.
yep downgraded, or taken off
2.97rev, 3.0, 01/11/2012 03:24:19, 39.2445, -122.7155, 16.7, Northern California
2.95rev,3.0, 02/11/2012 20:23:42, 38.8082, -122.792, 2.3, Northern California
unk, 3.1, 26/11/2012 09:32:36, 40.4232, -126.762, 0.1, 212km W of Ferndale, California
2.97rev, 3.0, 27/11/2012 15:17:21, 35.7847, -117.2667, 6.6, 12km E of Searles Valley, California
not sure what happened to that 26/11 one, its not listed (down to 2.8) and is inside the US Cont. polygon
thanks again, you saved me having to plug in my portable hard drive to go have a look at the Centennial.
Yes all the networks seem to struggle for data prior to the 1940's.
I might do ANSS instead of USGS despite the duplication issues, seems easier at this stage.
this is the polygon I set up for the Continental USA.
edit on 12-1-2013 by muzzy because: (no reason given)
yep downgraded, or taken off
2.97rev, 3.0, 01/11/2012 03:24:19, 39.2445, -122.7155, 16.7, Northern California
2.95rev,3.0, 02/11/2012 20:23:42, 38.8082, -122.792, 2.3, Northern California
unk, 3.1, 26/11/2012 09:32:36, 40.4232, -126.762, 0.1, 212km W of Ferndale, California
2.97rev, 3.0, 27/11/2012 15:17:21, 35.7847, -117.2667, 6.6, 12km E of Searles Valley, California
not sure what happened to that 26/11 one, its not listed (down to 2.8) and is inside the US Cont. polygon
edit on 12-1-2013 by muzzy because: (no reason given)
edit on 12-1-2013 by muzzy because: (no reason given)
Looks like the Virgin Islands region have had a good swarm going the last couple days. Largest one was a 4.9 so far.
Earthquake List for Virgin Islands Region
two largest ones
4.5 2013/01/12 05:42:14 19.677 -64.442 33.0 VIRGIN ISLANDS REGION
4.9 2013/01/10 16:33:37 19.671 -64.346 24.0 VIRGIN ISLANDS REGION
Earthquake List for Virgin Islands Region
two largest ones
4.5 2013/01/12 05:42:14 19.677 -64.442 33.0 VIRGIN ISLANDS REGION
4.9 2013/01/10 16:33:37 19.671 -64.346 24.0 VIRGIN ISLANDS REGION
reply to post by lurksoften
Indeed it has. That's the most rattling I've seen around the Virgin Islands in a good while.
There was also one on the Caribbean side of Honduras I believe on the 11th, I think near Roatan. It makes me wonder if there is a good shaker due for the Caribbean. Only time will tell.
On a different note, I was looking over the LISS this morning. Does anyone know what causes the Raoul, Kermandec Islands station to go so haywire? Every now & then, it looks like an ink bomb went off on it. The best I can guess is high wind, but I'm not certain.
new topics
-
George Knapp AMA on DI
Area 51 and other Facilities: 2 hours ago -
Not Aliens but a Nazi Occult Inspired and then Science Rendered Design.
Aliens and UFOs: 3 hours ago -
Louisiana Lawmakers Seek to Limit Public Access to Government Records
Political Issues: 5 hours ago -
The Tories may be wiped out after the Election - Serves them Right
Regional Politics: 6 hours ago -
So I saw about 30 UFOs in formation last night.
Aliens and UFOs: 8 hours ago -
Do we live in a simulation similar to The Matrix 1999?
ATS Skunk Works: 9 hours ago -
BREAKING: O’Keefe Media Uncovers who is really running the White House
US Political Madness: 10 hours ago -
Biden--My Uncle Was Eaten By Cannibals
US Political Madness: 11 hours ago -
"We're All Hamas" Heard at Columbia University Protests
Social Issues and Civil Unrest: 11 hours ago
top topics
-
BREAKING: O’Keefe Media Uncovers who is really running the White House
US Political Madness: 10 hours ago, 23 flags -
Biden--My Uncle Was Eaten By Cannibals
US Political Madness: 11 hours ago, 18 flags -
George Knapp AMA on DI
Area 51 and other Facilities: 2 hours ago, 16 flags -
African "Newcomers" Tell NYC They Don't Like the Free Food or Shelter They've Been Given
Social Issues and Civil Unrest: 16 hours ago, 12 flags -
Russia Flooding
Fragile Earth: 17 hours ago, 7 flags -
"We're All Hamas" Heard at Columbia University Protests
Social Issues and Civil Unrest: 11 hours ago, 7 flags -
Russian intelligence officer: explosions at defense factories in the USA and Wales may be sabotage
Weaponry: 15 hours ago, 6 flags -
Louisiana Lawmakers Seek to Limit Public Access to Government Records
Political Issues: 5 hours ago, 6 flags -
So I saw about 30 UFOs in formation last night.
Aliens and UFOs: 8 hours ago, 5 flags -
The Tories may be wiped out after the Election - Serves them Right
Regional Politics: 6 hours ago, 3 flags
active topics
-
"We're All Hamas" Heard at Columbia University Protests
Social Issues and Civil Unrest • 124 • : DBCowboy -
Biden--My Uncle Was Eaten By Cannibals
US Political Madness • 40 • : Kaiju666 -
Candidate TRUMP Now Has Crazy Judge JUAN MERCHAN After Him - The Stormy Daniels Hush-Money Case.
Political Conspiracies • 364 • : RazorV66 -
MULTIPLE SKYMASTER MESSAGES GOING OUT
World War Three • 29 • : annonentity -
Alabama Man Detonated Explosive Device Outside of the State Attorney General’s Office
Social Issues and Civil Unrest • 57 • : watchitburn -
Not Aliens but a Nazi Occult Inspired and then Science Rendered Design.
Aliens and UFOs • 6 • : visitedbythem -
Russian intelligence officer: explosions at defense factories in the USA and Wales may be sabotage
Weaponry • 165 • : andy06shake -
The Tories may be wiped out after the Election - Serves them Right
Regional Politics • 18 • : alldaylong -
Silent Moments --In Memory of Beloved Member TDDA
Short Stories • 43 • : Naftalin -
What do you do to get to sleep and stay asleep ??
Health & Wellness • 108 • : TheGoondockSaint