It looks like you're using an Ad Blocker.
Please white-list or disable AboveTopSecret.com in your ad-blocking tool.
Thank you.
Some features of ATS will be disabled while you continue to use an ad-blocker.

Quake Watch 2013
page: 89share:
further to post by muzzy
sorry for the delay, came back after dinner and ran the GFZ data through GPSVisualiser using the ANSS template I had, with adjustments for headings and it wouldn't work.
I thought it was an issue with their server so left it.
Just tried again this morning and same.
Then I tried altering a NZ template and it worked.
Not sure why.
Anyway here it is
interactive map
While I'm awake at 4:30am [color=8BB381](rain woke me up, can't get back to sleep, its going to be a looooooooong day )
here is a couple of little animations to show the difference between USGS and GFZ for this series.
Like the Iran quake last week where I compared USGS to IIEES, again USGS plotting the whole group to the east. I've noticed that in the past to when USGS plotted NZ quakes, often waaaay off compared to plots from other networks.
@100km scale
@50km scale
Originally posted by muzzy
edit on 21-5-2013 by muzzy because: GFZ map after dinner
sorry for the delay, came back after dinner and ran the GFZ data through GPSVisualiser using the ANSS template I had, with adjustments for headings and it wouldn't work.
I thought it was an issue with their server so left it.
Just tried again this morning and same.
Then I tried altering a NZ template and it worked.
Not sure why.
Anyway here it is
interactive map
While I'm awake at 4:30am [color=8BB381](rain woke me up, can't get back to sleep, its going to be a looooooooong day )
here is a couple of little animations to show the difference between USGS and GFZ for this series.
Like the Iran quake last week where I compared USGS to IIEES, again USGS plotting the whole group to the east. I've noticed that in the past to when USGS plotted NZ quakes, often waaaay off compared to plots from other networks.
@100km scale
@50km scale
edit on 21-5-2013 by muzzy because: might do RAS data later and see what really happened
What's going on in Strawberry, AR?
Is this near fracking again?
folkworm.ceri.memphis.edu...
Muzzy...you are changing your avatar more often than I change my socks!!!
WOQ
Is this near fracking again?
folkworm.ceri.memphis.edu...
Muzzy...you are changing your avatar more often than I change my socks!!!
WOQ
edit on 21-5-2013 by wasobservingquietly because: (no reason given)
reply to post by wasobservingquietly
sorry about that, just messing about with it, wasn't happy with that last one it was too sharp.
Gone for the 60's look now
I'm not sure if everyone has the dark background, or if you can even change the ATS background at all, mine is very dark grey, the new avatar changes shade depending how far up or down on the page it is (lighter if at the top of the page)
I have a slightly different version on my blogs, which have a white backgrond
looks different again in the post reply box
edit on 21-5-2013 by muzzy because: disclaimer: no "drugs" were used in creating this new avatar
edit on 21-5-2013 by muzzy because: I actually put "L S D" in the reason for edit above, without the spaces between letters, but it
came out blanked ............ how silly is that
reply to post by muzzy
That's neat how it changes shades!
My background is black, but the posts are on dark gray.
Your avatar is darker at the top & gets lighter as it goes down!?
Is yours different 'cause you're down under???
To me it looks kind of like camouflage! Cool!
WOQ
That's neat how it changes shades!
My background is black, but the posts are on dark gray.
Your avatar is darker at the top & gets lighter as it goes down!?
Is yours different 'cause you're down under???
To me it looks kind of like camouflage! Cool!
WOQ
edit on 21-5-2013 by wasobservingquietly because: (no reason given)
reply to post by wasobservingquietly
yeah it does eh.
Re the Strawberry quakes, I can't see any fracking pads in the area on GE, but they may be old satellite images.
I'm not sure how often they upgrade the images of GE, I was looking at Christchurch on the weekend and was shocked at all the open spaces where buildings had been demolished after the 2011 quakes.
If anyone want's a look this link will take you right there on Google Maps.
Christchurch demolition
maybe it is GFZ that has got it wrong.
Just ran through the Russian Academy of Sciences, Geophysical Survey data for the same time period and they are also to the SE like USGS.
as expected more quakes and higher readings
mag4= 24
mag5= 39
mag6= 5
total= 68
TTNT= 192,677.596
interactive map RAS data
there have been another 15 since incl. another 6.2mb (noted elsewhere as 6.0/6.1)
edit on 21-5-2013 by muzzy because: I'll do the animation again to show all 3, might even do EMSC as well, too bad you can't just edit the
same post that was on, stupid time limit, don't see that on any other forums I have been to..
reply to post by muzzy
But that is the point and why that map is not interesting. No landforms are showing. That is population grids with earthquake density overlaid. No outlines of land at all. If we take South America for example the grid shows all the way up the coast and the earthquake densities spillover into the ocean where the is not grid.
Whilst I love the map my only comment would be that if this is density based on magnitude it is not truly representative of seismic activity.
I can feel an urge to craft some GL areas coming on.
PS. I am Taurus. I liked your old avatar better
edit on 21/5/2013 by PuterMan because: (no reason given)
reply to post by muzzy
I am wondering if there is any connection between this and Pavlof.
They both kicked off around the same time.
I am wondering if there is any connection between this and Pavlof.
They both kicked off around the same time.
reply to post by PuterMan
I was looking at some of the volcanoes on GE when I was there, didn't see anything in that Petropavlovsk area Smithsonian had that said anything was active, although I know there is some on the Kamchatka Pen. somewhere that are.
Just had a look on John Seach site, nothing there either.
FWIW EMSC
mag4= 47
mag5= 30
mag6= 1
mag7= 0
total= 78
TTNT= 85,849.879
simialr but a bit higher than USGS.
haven't plotted them yet, have to go to do some work, it has stopped raining
later
edit on 21-5-2013 by muzzy because: (no reason given)
Originally posted by PuterMan
reply to post by muzzy
PS. I am Taurus. I liked your old avatar better
Yeah I know
the whole World is going to hell in a handbasket
reply to post by muzzy
Nah, ignore me. Brain fart. Pavlof is way to far away at the the western end of the Aleutian arc.
I claim a senior moment.
Nah, ignore me. Brain fart. Pavlof is way to far away at the the western end of the Aleutian arc.
I claim a senior moment.
Kamchatka Swarm May 2013
As you all know a Swarm, or Series, of Moderate to Strong earthquakes has occurred off the SE coast of Kamchatka Peninsula, Russia.
Each Seismic Network often seems to get a different result on the magnitude and the location of each event and this gives a confusing overview of not only the location of the swarm but the shape and trend of the series as a whole.
I have taken the data from RAS, GFZ, EMSC and USGS and mapped out each Network’s data for the same time period period 14/05/2013 10:19 to 21/05/2013 04:59.
Lower down the page are two animations showing the differences in the locations estimated by each Network, at different scales 50km and 100km. ...................... page here
made more sense to put them all on one page, rather than scatter them across 2-3 pages here as I made them.
By the time I've got it all together, its time to do an update
There are two sites in Arkansas that are rumbling. Both areas have frack wells all around the
epicenter.
epicenter.
Originally posted by Olivine
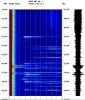
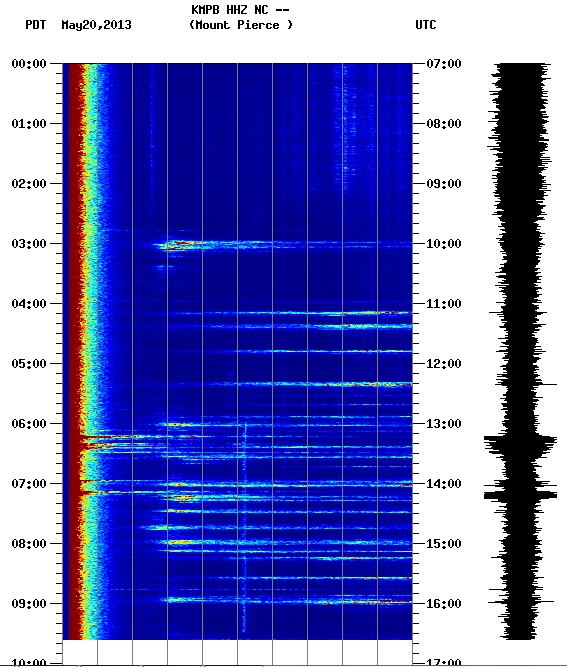
LDEO puts these quakes 100's of kms offshore. When I looked at the seismos, and especially the spectrograms, from the area, it looks like possibly 5 different events. Maybe these are volcanic eruptions at the spreading ridge?
Next is the spectrogram from the same station. It sure looks like more than 2 earthquakes.
Sorry to quote myself, but I thought it would make this list a bit more understandable.
USGS has 6 quakes listed for the events we were puzzling over: near northern California or Kamchatka. It turns out they were offshore NoCal:
4.4 234km WSW of Brookings, Oregon 2013-05-20 14:07:59 10.0 km deep
4.2 238km W of Crescent City, California 2013-05-20 13:56:30 10.0 km deep
4.3 250km W of Crescent City, California 2013-05-20 13:23:44 10.0 km deep
4.3 273km W of Crescent City, California 2013-05-20 13:20:53 10.0 km deep
4.1 248km W of Crescent City, California 2013-05-20 13:19:30 10.0 km deep
4.3 252km WSW of Brookings, Oregon 2013-05-20 13:12:4410.0 km deep
Interesting little hiccup of activity.
I HATE THE NEW USGS SITE......
I WANT THE OLD MAP BACK
O.k......I am through now
I WANT THE OLD MAP BACK
O.k......I am through now
reply to post by radpetey
Yes, YEs, YES!!! Me too!!!
No polar views! I used to watch for patterns of activity developing by quadrants.
Viewing from the north or south pole, I had a better angle on things!
No latitude & longitude grid either!
Can't click on an area for a quick, closer view.
Can't click on an area of a possible developing swarm,
& get a list of eqs for that map! Or maybe it's just me!
In which case it's not very user friendly! I have a whole list of 'no mores'!!!
One or two clicks trumps zoom, zoom, click, click, click, any day!!!
Especially since even after all that, I still don't have what I want!
And I used to be able to get in 1 or 2 clicks!!!
And I hate the vertical list!!!
The 6's + not in red type! (Wimpy pinkish highlights!!!)
Where's the time in other zones option? I used that a lot!!!
And the handy, fast 7 day list! Scroll, click...oops...click again!!! *@#$+&%$!!!
Everybody should fill up USGS's inbox with complaints until they say 'uncle'!!!
Hubby thought I was sick because I'm hardly on the computer any more!
They have taken all the fun out of it! (I don't ask for much from life!!!)
If there is a big, unusual event & I have to view it through USGS's cataracts,
they are going to be risking anger the likes of the wrath of Khan!!!
(Pssst...zip it WOQ! Everyone's tired of your whining & complaining already!!! )
edit on 22-5-2013 by wasobservingquietly because: 'Cause I make even more mistakes when I'm upset...okay???
Just doing NZ earthquakes for yesterday UTC and noticed this one. The red details are what caught my eye.
Not often you see that in the data.
location is right
here
those will be old satellite pics on GM, but there is already a pretty big older landslide on the east side of the valley, and some really weird rock formations on the SW side from the epi-center
 [color=8BB381](click for larger image, opens in new
tab/window)
[color=8BB381](click for larger image, opens in new
tab/window)
Not often you see that in the data.
Ref: 2013p382089
Lat/Long: -43.7179 169.8035
When: 22/05/2013 08:57:24 UTC
Depth: 0.0 km
Mag: 2.63 ML
No. of Phases used: 10
Status: reviewed (landslide)
Updated on: 22/05/2013 20:53:06
Location: Mt. Cook-Glaciers
Energy Released: 0.1312 tonnes of TNT
location is right
here
those will be old satellite pics on GM, but there is already a pretty big older landslide on the east side of the valley, and some really weird rock formations on the SW side from the epi-center

edit on 23-5-2013 by muzzy because: add GE image
On the seven day all mag count you can almost see a circle forming in the northwest.
Looks rather strange in my opinion.
Looks rather strange in my opinion.
reply to post by Olivine
Yup Useless strikes again. How the H are you supposed to know at a glance that is off shore.
"OFF THE COAST OF" says it much better than roses or chocolates
Note also Olivine that all of those are EARLIER than the 14:07that we could clearly identify as a quake from that area, but they do show and top marks to you for your observations.

I just wish we had better kit to enable identification of those ourselves.
/rant ON
May I remind you folks that Government, and thus government organisations, are in place to do the bidding of the people and not exactly as they please. Unless a body of people get up on their hind legs to complain about what Government does they WILL do exactly as they please. This applies to all Governments all over the world that are 'democratically' elected and the members of which forget the minute they get a politicians salary what they were elected to do.
Carry on complaining WOQ - and complain to Useless directly. I do, The web manager is Lisa A Wald. That is the person you need to direct your emails to. She is of the opinion that everyone LOVES the new look, or so she told me. I did point out to her that her web team had failed to test it in IE, in which it does not work, but that did not elicit any response at all. It would be wrong for me to post the email address here so the best course is to use the web contact us form. She will get to see that especially if you mention her in the text.
/rant OFF
234km WSW of Brookings
Yup Useless strikes again. How the H are you supposed to know at a glance that is off shore.
"OFF THE COAST OF" says it much better than roses or chocolates
Prov,Date/Time UTC,Latitude,Longitude,Magnitude,Depth(Km),Location
gfzp,2013-05-20 14:07:57, 41.430, -127.500, 4.1, 10.0, Off Coast Of N. California
emsc,2013-05-20 14:07:58, 41.457, -127.121, 4.4, 10.0, Off Coast Of Northern California
usgs,2013-05-20 14:07:59, 41.512, -127.013, 4.4, 10.0, 234Km Wsw Of Brookings. Oregon
Note also Olivine that all of those are EARLIER than the 14:07that we could clearly identify as a quake from that area, but they do show and top marks to you for your observations.
I just wish we had better kit to enable identification of those ourselves.
/rant ON
May I remind you folks that Government, and thus government organisations, are in place to do the bidding of the people and not exactly as they please. Unless a body of people get up on their hind legs to complain about what Government does they WILL do exactly as they please. This applies to all Governments all over the world that are 'democratically' elected and the members of which forget the minute they get a politicians salary what they were elected to do.
Carry on complaining WOQ - and complain to Useless directly. I do, The web manager is Lisa A Wald. That is the person you need to direct your emails to. She is of the opinion that everyone LOVES the new look, or so she told me. I did point out to her that her web team had failed to test it in IE, in which it does not work, but that did not elicit any response at all. It would be wrong for me to post the email address here so the best course is to use the web contact us form. She will get to see that especially if you mention her in the text.
/rant OFF
edit on 23/5/2013 by PuterMan because: Ah, the inevitable speeling erra
new topics
-
Pentagon acknowledges secret UFO project, the Kona Blue program | Vargas Reports
Aliens and UFOs: 49 minutes ago -
Boston Dynamics say Farewell to Atlas
Science & Technology: 57 minutes ago -
I hate dreaming
Rant: 1 hours ago -
Is the origin for the Eye of Horus the pineal gland?
Philosophy and Metaphysics: 3 hours ago -
Man sets himself on fire outside Donald Trump trial
Mainstream News: 3 hours ago -
Biden says little kids flip him the bird all the time.
2024 Elections: 3 hours ago -
The Democrats Take Control the House - Look what happened while you were sleeping
US Political Madness: 4 hours ago -
Sheetz facing racial discrimination lawsuit for considering criminal history in hiring
Social Issues and Civil Unrest: 4 hours ago -
In an Historic First, In N Out Burger Permanently Closes a Location
Mainstream News: 6 hours ago -
MH370 Again....
Disaster Conspiracies: 6 hours ago
top topics
-
In an Historic First, In N Out Burger Permanently Closes a Location
Mainstream News: 6 hours ago, 14 flags -
The Democrats Take Control the House - Look what happened while you were sleeping
US Political Madness: 4 hours ago, 10 flags -
Thousands Of Young Ukrainian Men Trying To Flee The Country To Avoid Conscription And The War
Other Current Events: 16 hours ago, 8 flags -
A man of the people
Medical Issues & Conspiracies: 11 hours ago, 8 flags -
Man sets himself on fire outside Donald Trump trial
Mainstream News: 3 hours ago, 7 flags -
Biden says little kids flip him the bird all the time.
2024 Elections: 3 hours ago, 6 flags -
4 plans of US elites to defeat Russia
New World Order: 13 hours ago, 4 flags -
Is the origin for the Eye of Horus the pineal gland?
Philosophy and Metaphysics: 3 hours ago, 4 flags -
Sheetz facing racial discrimination lawsuit for considering criminal history in hiring
Social Issues and Civil Unrest: 4 hours ago, 3 flags -
Are you ready for the return of Jesus Christ? Have you been cleansed by His blood?
Religion, Faith, And Theology: 9 hours ago, 3 flags
active topics
-
Mood Music Part VI
Music • 3063 • : lilzazz -
12 jurors selected in Trump criminal trial
US Political Madness • 106 • : ImagoDei -
The defamation of Mary Magdalene
Religion, Faith, And Theology • 13 • : Solvedit -
The Democrats Take Control the House - Look what happened while you were sleeping
US Political Madness • 35 • : ImagoDei -
Russian intelligence officer: explosions at defense factories in the USA and Wales may be sabotage
Weaponry • 176 • : BernnieJGato -
-@TH3WH17ERABB17- -Q- ---TIME TO SHOW THE WORLD--- -Part- --44--
Dissecting Disinformation • 543 • : SideEyeEverything1 -
Elites disapearing
Political Conspiracies • 33 • : 0bserver1 -
Man sets himself on fire outside Donald Trump trial
Mainstream News • 29 • : ByeByeAmericanPie -
Fossils in Greece Suggest Human Ancestors Evolved in Europe, Not Africa
Origins and Creationism • 78 • : strongfp -
Pentagon acknowledges secret UFO project, the Kona Blue program | Vargas Reports
Aliens and UFOs • 2 • : Macenroe1982