It looks like you're using an Ad Blocker.
Please white-list or disable AboveTopSecret.com in your ad-blocking tool.
Thank you.
Some features of ATS will be disabled while you continue to use an ad-blocker.

Quake Watch 2013
page: 80share:
reply to post by whatnext21
and
reply to post by Vasa Croe
I have reconfigured that text results page into columns and added addresses and separated into GA and SC states
Here is the map of the results
 [color=8BB381](click image for interactive map, opens in new tab/window)
Re. that quake that caught your attention (location fingered on the map image)
26/04/2013 05:13:41 33.7733 -82.3728 11.73 2.8 Md 4322 Highway 220, Lincolnton, GA 30817
is right beside the J. Strom Thurmond Reservoir (Clarks Hill Lake)
yes there have been a few in that area this month
could be settlement of the lake, has there been a drought (or floods) lately maybe?
Having a look over the overall results and map;
Georgia
earliest event on ANSS in GA
18/02/1964 09:31:11 34.8 -85.5 15 4.4 Mb 393 Haven Road, Rising Fawn, GA 30738
largest quake on ANSS in GA
02/08/1974 08:52:10 33.872 -82.488 1 4.9 Unk Unnamed Road, Lincolnton, GA 30817
there are 3 other mag 4's recorded in GA
18/02/1964 09:31:11 34.8 -85.5 15 4.4 Mb 393 Haven Road, Rising Fawn, GA 30738
13/03/1964 01:20:18 33.2 -83.4 40 4.4 Mb Putnam Beach Road Southwest, Oconee National Forest, Eatonton, GA 31024
09/10/1984 11:54:26 34.775 -85.193 14.9 4.0 ML 1424 Colbert Hollow Road, Rock Springs, GA 30739
Looking at the addresses I can't see anything else that stands out except;
37 events 05/12/1982 to 25/12/1982 at Marion Road, Dry Branch, GA 31020
It looks like a Mine of some sort, may be Clay as there is a road nearby called Huber Clay County Rd, so there is a good chance these events were mine blasts perhaps when the mining was started. I talked with a guy from GA at an Art Show here in NZ about 5 years ago who was making pots with white clay, which was unusual, maybe this is where it came from.
of course all those events in the NW corner of the state are on the New Madrid Fault
South Carolina
earliest event on ANSS in SC
23/10/1967 09:04:10 33.4 -80.7 33 3.8 Mb 1850 Winter Creek Road, Bowman, SC 29018
largest quake on ANSS in SC
22/11/1974 05:25:56 32.9 -80.145 18 4.7 Mb 4300-4398 Ashley River Road, Summerville, SC 29485
there are 3 othe mag 4's recorded in SC
03/02/1972 23:11:08 33.476 -80.434 5 4.5 Mb 1 Ragtime Trail, Vance, SC 29163
21/08/1992 16:31:56 32.985 -80.163 6.5 4.1 ML 108 Nancy Lane, Summerville, SC 29485
11/11/2002 23:39:30 32.404 -79.936 2.4 4.4 ML offshore Edisto Beach
most of the quakes in SC are NW of Charleston, just looking at the map there is obviously a Fault running NW/SE between Pomaria (NW) and offshore Edisto Beach (SE) that runs right through Summerville
What is going on in Georgia today? Frack related?
and
reply to post by Vasa Croe
Don't know much about quakes but can say that I can't remember the last time I heard of one in GA or SC. Is this an odd quake or just normal as usual?
I have reconfigured that text results page into columns and added addresses and separated into GA and SC states
Here is the map of the results
Re. that quake that caught your attention (location fingered on the map image)
26/04/2013 05:13:41 33.7733 -82.3728 11.73 2.8 Md 4322 Highway 220, Lincolnton, GA 30817
is right beside the J. Strom Thurmond Reservoir (Clarks Hill Lake)
yes there have been a few in that area this month
could be settlement of the lake, has there been a drought (or floods) lately maybe?
Having a look over the overall results and map;
Georgia
earliest event on ANSS in GA
18/02/1964 09:31:11 34.8 -85.5 15 4.4 Mb 393 Haven Road, Rising Fawn, GA 30738
largest quake on ANSS in GA
02/08/1974 08:52:10 33.872 -82.488 1 4.9 Unk Unnamed Road, Lincolnton, GA 30817
there are 3 other mag 4's recorded in GA
18/02/1964 09:31:11 34.8 -85.5 15 4.4 Mb 393 Haven Road, Rising Fawn, GA 30738
13/03/1964 01:20:18 33.2 -83.4 40 4.4 Mb Putnam Beach Road Southwest, Oconee National Forest, Eatonton, GA 31024
09/10/1984 11:54:26 34.775 -85.193 14.9 4.0 ML 1424 Colbert Hollow Road, Rock Springs, GA 30739
Looking at the addresses I can't see anything else that stands out except;
37 events 05/12/1982 to 25/12/1982 at Marion Road, Dry Branch, GA 31020
It looks like a Mine of some sort, may be Clay as there is a road nearby called Huber Clay County Rd, so there is a good chance these events were mine blasts perhaps when the mining was started. I talked with a guy from GA at an Art Show here in NZ about 5 years ago who was making pots with white clay, which was unusual, maybe this is where it came from.
of course all those events in the NW corner of the state are on the New Madrid Fault
South Carolina
earliest event on ANSS in SC
23/10/1967 09:04:10 33.4 -80.7 33 3.8 Mb 1850 Winter Creek Road, Bowman, SC 29018
largest quake on ANSS in SC
22/11/1974 05:25:56 32.9 -80.145 18 4.7 Mb 4300-4398 Ashley River Road, Summerville, SC 29485
there are 3 othe mag 4's recorded in SC
03/02/1972 23:11:08 33.476 -80.434 5 4.5 Mb 1 Ragtime Trail, Vance, SC 29163
21/08/1992 16:31:56 32.985 -80.163 6.5 4.1 ML 108 Nancy Lane, Summerville, SC 29485
11/11/2002 23:39:30 32.404 -79.936 2.4 4.4 ML offshore Edisto Beach
most of the quakes in SC are NW of Charleston, just looking at the map there is obviously a Fault running NW/SE between Pomaria (NW) and offshore Edisto Beach (SE) that runs right through Summerville
edit on 27-4-2013 by muzzy because: my normal consultancy fee for this work would be $200per hour, so 3 hours makes it $600 all up. Will you
two be paying seperately or individually? Ha! just kidding, it would have taken me less time if I hadn't spent an hour searching Google and Wiki to
find out what that mine was about near Macon, which really had nothing to do with your enquiry. (I never did find out for sure.) So lets call it $400
then. Ha! just kidding again. I don't mind doing these searches and maps etc, eventually I will get all the US states earthquake history mapped, so
thats Nevada, Georgia and South Carolina out of the way now. I had some bad indigestion from a spagetti dinner last night and couldn't sleep, so
needed something quiet to do while the rest of the house snored away the early morning. Lucky its Sunday, No Charge!
reply to post by muzzy
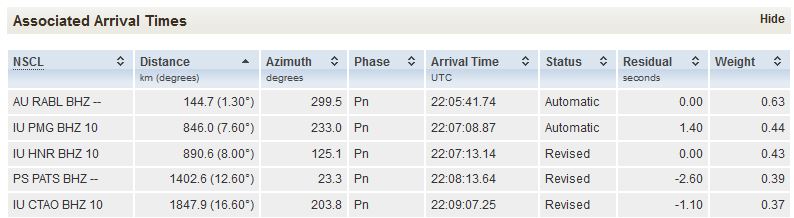
Relocated to "Associated Arrival Times" in technical_contributed-solutions
earthquake.usgs.gov/earthquakes/eventpage/usb000ggvj#technical_contributed-solutions
Relocated to "Associated Arrival Times" in technical_contributed-solutions
earthquake.usgs.gov/earthquakes/eventpage/usb000ggvj#technical_contributed-solutions
reply to post by wujotvowujotvowujotvo
Thanks, thats something at least, how long has that been there? I didn't see it there before.
I had a quick look back to something older than 7 days eg this one and it says
SNZO doesn't show on all Associated Arrival Times lists, on a few they had other NZ stations instead, but that no use to me as I can only get SNZO on LISS.
The old page with the map always had SNZO on the list.
Its only to help find where a trace was from when looking at LISS and there are a couple of candidates on the same hour line, often an earlier quake will arrive after a later one because of the distance.
I was looking at Geo Australia yesterday and see that they have Arrival Times, just the P and S wave, but at least they have something. I would have to switch to an Aussie station like CTAO at Charters Towers, but whats the use of that, I live in Wellington, NZ. And they miss a lot of Pacific quakes too.
Just when you get some kind of system going, they change things. My SNZO captures go back to the Van Turkey quake in 2011. I bet there are no other records like it.
I want my Arrival Time Calculator back
Thanks, thats something at least, how long has that been there? I didn't see it there before.
I had a quick look back to something older than 7 days eg this one and it says
No data available from selected seismic network
SNZO doesn't show on all Associated Arrival Times lists, on a few they had other NZ stations instead, but that no use to me as I can only get SNZO on LISS.
The old page with the map always had SNZO on the list.
Its only to help find where a trace was from when looking at LISS and there are a couple of candidates on the same hour line, often an earlier quake will arrive after a later one because of the distance.
I was looking at Geo Australia yesterday and see that they have Arrival Times, just the P and S wave, but at least they have something. I would have to switch to an Aussie station like CTAO at Charters Towers, but whats the use of that, I live in Wellington, NZ. And they miss a lot of Pacific quakes too.
Just when you get some kind of system going, they change things. My SNZO captures go back to the Van Turkey quake in 2011. I bet there are no other records like it.
I want my Arrival Time Calculator back
edit on 27-4-2013 by muzzy because: (no reason given)
I wonder whats with LDEO? they took out the Kerm 6.2, I'm sure
it was there yesterday I think they had 6.0 from memory.
FWIW Geonet had it at 5.6ML and on the east side of the Kermadec Ridge on the Pacific Plate, not to the west over by the Coleville Ridge, on the Australian Plate.
I'm on the verge of giving up and reverting back to where I started, tracking earthquakes around my back yard (Cook Strait), everything is becoming too unreliable out there past the 900km radius radar screen
and its all because of those stupid i-phone things. How on earth can people afford to connect to the internet on those, its really expensive here.
edit on 27-4-2013 by muzzy because: (no reason given)
For previous page, what the news articles referenced, not the Nature study - Roland Burgmann's presentation of Pollitz.
Abstract also on a paywalled link
srl.geoscienceworld.org/content/84/2/258.full.pdf
SSA 2013 Annual Meeting Announcement
Seismological Research Letters March/April 2013 v. 84 no. 2 p. 258-397
doi: 10.1785/0220130011
www2.seismosoc.org/FMPro?-db=Abstract_Submission_13&-sortfield=PresDay&-sortorder=ascending&-sortfield=Special+Session+Name+Calc&-sortorder=ascen ding&-sortfield=PresTimeSort&-sortorder=ascending&-op=cn&Abstract+Title=&-op=cn&Abstract+Authors+|+Affiliations=Pollitz&-op=gt&PresStatus=0&-lop=and&- token.1=ShowSession&-recid=1076&-format=%2Fmeetings%2F2013%2Fabstracts%2Fsessionabstractdetail.html&-lay=MtgList&-find
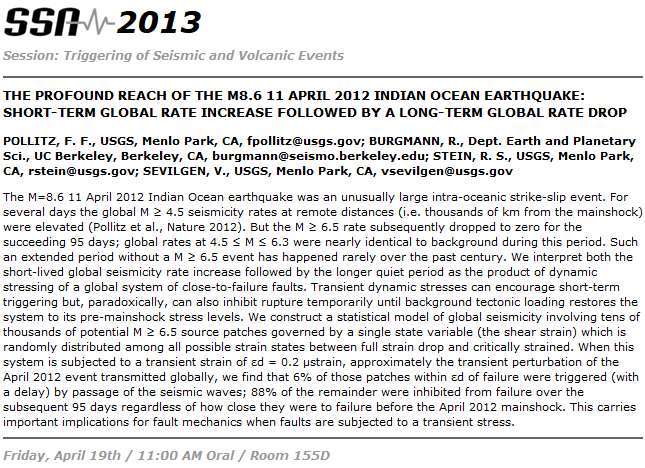
SSA 2013
Session: Triggering of Seismic and Volcanic Events
The Profound Reach of the M8.6 11 April 2012 Indian Ocean Earthquake: Short-term Global Rate Increase Followed by a Long-term Global Rate Drop
POLLITZ, F. F., USGS, Menlo Park, CA, [email protected]; BURGMANN, R., Dept. Earth and Planetary Sci., UC Berkeley, Berkeley, CA, [email protected]; STEIN, R. S., USGS, Menlo Park, CA, [email protected]; SEVILGEN, V., USGS, Menlo Park, CA, [email protected]
The M=8.6 11 April 2012 Indian Ocean earthquake was an unusually large intra-oceanic strike-slip event. For several days the global M ≥ 4.5 seismicity rates at remote distances (i.e. thousands of km from the mainshock) were elevated (Pollitz et al., Nature 2012). But the M ≥ 6.5 rate subsequently dropped to zero for the succeeding 95 days; global rates at 4.5 ≤ M ≤ 6.3 were nearly identical to background during this period. Such an extended period without a M ≥ 6.5 event has happened rarely over the past century. We interpret both the short-lived global seismicity rate increase followed by the longer quiet period as the product of dynamic stressing of a global system of close-to-failure faults. Transient dynamic stresses can encourage short-term triggering but, paradoxically, can also inhibit rupture temporarily until background tectonic loading restores the system to its pre-mainshock stress levels. We construct a statistical model of global seismicity involving tens of thousands of potential M ≥ 6.5 source patches governed by a single state variable (the shear strain) which is randomly distributed among all possible strain states between full strain drop and critically strained. When this system is subjected to a transient strain of εd = 0.2 μstrain, approximately the transient perturbation of the April 2012 event transmitted globally, we find that 6% of those patches within εd of failure were triggered (with a delay) by passage of the seismic waves; 88% of the remainder were inhibited from failure over the subsequent 95 days regardless of how close they were to failure before the April 2012 mainshock. This carries important implications for fault mechanics when faults are subjected to a transient stress.
Friday, April 19th / 11:00 AM Oral / Room 155D
another version eh.
a lot gets lost in editing doesn't it
however Pollitz was still wrong
according to ANSS data
that wasn't in the Nature version
a lot gets lost in editing doesn't it
however Pollitz was still wrong
But the M ≥ 6.5 rate subsequently dropped to zero for the succeeding 95 days;
according to ANSS data
2012/04/11 08:38:36.72 2.3270 93.0630 20.00 8.60 Mw 499 1.33 NEI 201204112018
start_time=2012/04/11, end_time=2012/07/15, 95_days, minimum_magnitude=6.5 ----------5 events
2012/04/17 03:50:15.61 -32.6250 -71.3650 29.00 6.70 Mw 518 0.96 NEI 201204172011
2012/04/17 07:13:49.00 -5.4620 147.1170 198.00 6.80 Mw 597 0.95 NEI 201204172018
2012/04/21 01:16:52.74 -1.6170 134.2760 16.00 6.70 Mw 370 1.12 NEI 201204212003
2012/04/28 10:08:08.09 -18.6850 -174.7050 134.70 6.70 Mw 529 1.00 NEI 201204282021
2012/05/28 05:07:23.45 -28.0430 -63.0940 586.90 6.80 Mw 548 0.82 NEI 201205282007
global rates at 4.5 ≤ M ≤ 6.3 were nearly identical to background during this period
that wasn't in the Nature version
Heads up ........Quake danger is high at Cocos Keeling Islands near Singapore.
maps.google.com...
Ionospheric Map is showing it at 16 mhz the same as the Iran quake.
www.ips.gov.au...
Secondary area is North of Myanmar at 15 mhz.
also second source map iono.jpl.nasa.gov...
Nothing might come out of this but its always good to be prepared.[
maps.google.com...
Ionospheric Map is showing it at 16 mhz the same as the Iran quake.
www.ips.gov.au...
Secondary area is North of Myanmar at 15 mhz.
also second source map iono.jpl.nasa.gov...
edit on 7/30/2012 by dreamfox1 because: 80 TECU
Nothing might come out of this but its always good to be prepared.[
edit on 7/30/2012 by dreamfox1 because:
geo-seismic-labs.org...
edit on 7/30/2012 by dreamfox1 because: GeoSeismic Labs: Earthquake Research
reply to post by muzzy
Many months actually as that is from the phases.xml available in the downloads which is what I use to create the phase table on my pages for mag 6+
There is/will be a menu item in QVSData Pro to go directly to USGS phases from within the program.
how long has that been there?
Many months actually as that is from the phases.xml available in the downloads which is what I use to create the phase table on my pages for mag 6+
There is/will be a menu item in QVSData Pro to go directly to USGS phases from within the program.
reply to post by dreamfox1
No it is over India right now, but that is as I have said before because the Sun is over India right now,
If you did not read my replies about this data perhaps you should go back and look at them. This version of TEC cannot give any indications. Proven.
By the way that NASA map is the one that I collected every 5 minutes for over a year, and could correlate absolutely nothing in the end.
edit on 28/4/2013 by PuterMan because: (no reason given)
Originally posted by PuterMan
reply to post by dreamfox1
No it is over India right now, but that is as I have said before because the Sun is over India right now,
If you did not read my replies about this data perhaps you should go back and look at them. This version of TEC cannot give any indications. Proven.
The area looks larger over India at the moment.
No activity in those areas too so you may be right.
edit on 7/30/2012 by dreamfox1 because: (no reason given)
This is a frackquake earthquake in Oklahoma.
earthquake.usgs.gov...
The area is surrounded by frack wells and injection sites.
earthquake.usgs.gov...
The area is surrounded by frack wells and injection sites.
www.upi.com...
www.scientificamerican.com...
www.livescience.com...
www.huffingtonpost.com...
news.yahoo.com...
and after the last week of larger quakes, now, there's a lull.
www.scientificamerican.com...
www.livescience.com...
www.huffingtonpost.com...
news.yahoo.com...
edit on 28-4-2013 by ericblair4891 because: (no reason
given)
edit on 28-4-2013 by ericblair4891 because: (no reason given)
and after the last week of larger quakes, now, there's a lull.
edit on 28-4-2013 by ericblair4891 because: (no reason given)
reply to post by ericblair4891
Wot lull LOL
www.emsc-csem.org...
Some really big ones out there tonight. ETA looks like some sort of quarry.
My theory is that it is actually a Mag 10 but they only have a placeholder for one digit so all we got was the 0.0 instead of 10.0
It has just been updated. It is now a10.6 3.4
and another 27km away from the last one
www.emsc-csem.org...
The first one moved 21km and is now 11km from the smaller one.
Wot lull LOL
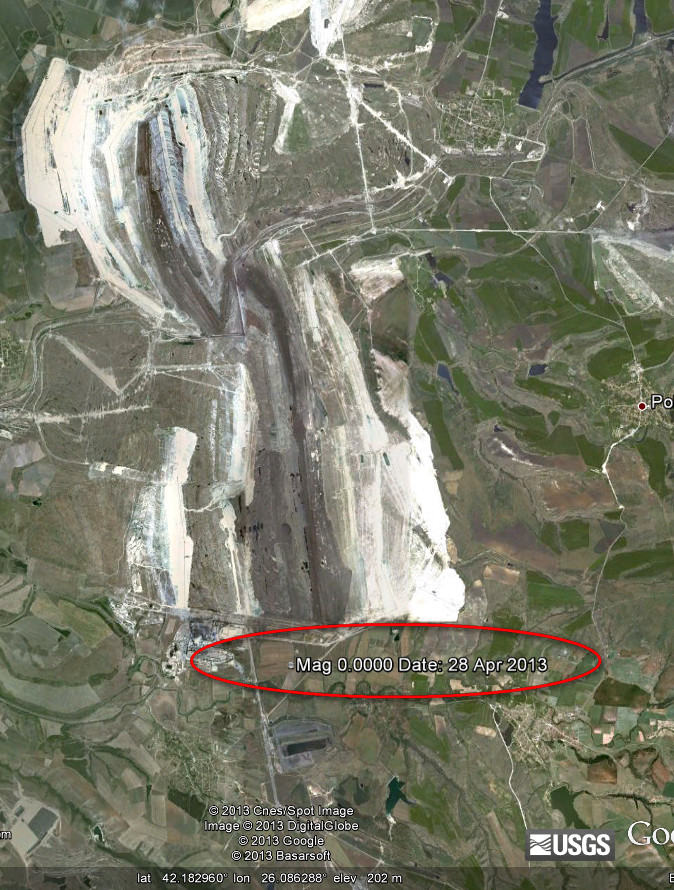
Magnitude NA 0.0
Region BULGARIA
Date time 2013-04-28 22:18:36.6 UTC
Location 42.14 N ; 26.02 E
Depth 2 km
Distances 230 km E of Sofia, Bulgaria / pop: 1,152,556 / local time: 01:18:36.6 2013-04-29
43 km NE of Khaskovo, Bulgaria / pop: 79,699 / local time: 01:18:36.6 2013-04-29
19 km S of Radnevo, Bulgaria / pop: 14,667 / local time: 01:18:36.6 2013-04-29
Global view
Source parameters not yet reviewed by a seismologist
www.emsc-csem.org...
Some really big ones out there tonight. ETA looks like some sort of quarry.
My theory is that it is actually a Mag 10 but they only have a placeholder for one digit so all we got was the 0.0 instead of 10.0
It has just been updated. It is now a
and another 27km away from the last one
www.emsc-csem.org...
The first one moved 21km and is now 11km from the smaller one.
edit on 28/4/2013 by PuterMan because: (no reason given)
Sunday April 28 2013, 22:18:34 UTC 18 minutes ago Bulgaria 3.4 1.0 CSEM-EMSC Feed
www.emsc-csem.org/Earthquake/alert/?id=hd869;SC3&date=2013-04-28
at [dynamic] 2 GMT/UTC LDEO update
www.ldeo.columbia.edu/~ekstrom/Research/SWD/current/RADB_SWD_grd.html
at [dynamic] 3 GMT/UTC LDEO update
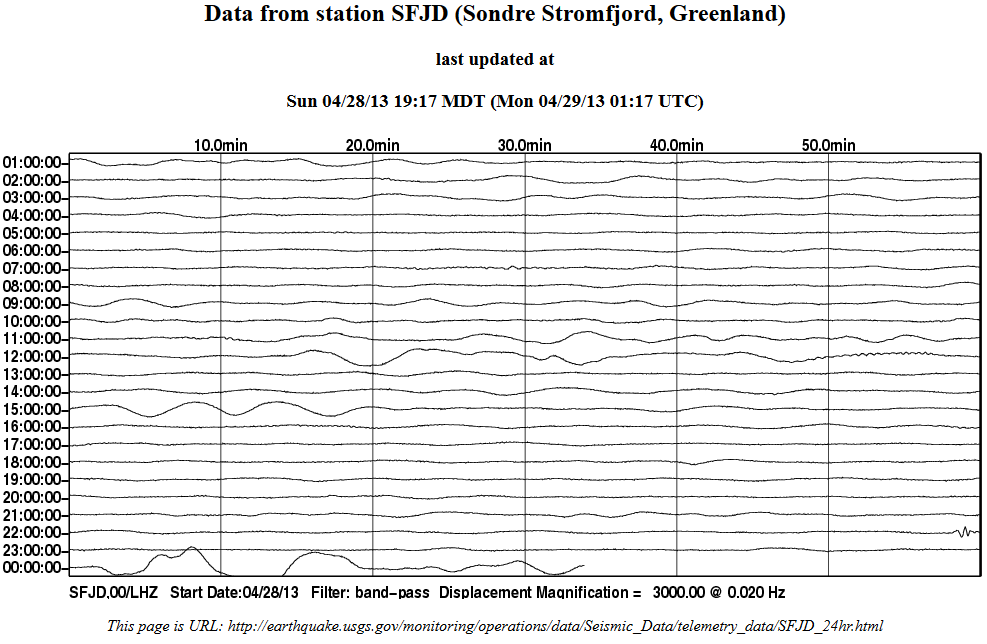
earthquake.usgs.gov/monitoring/operations/data/Seismic_Data/telemetry_data/SFJD_24hr.html
2013-04-28 22:52:20.9 56.67 N 32.07 W 10 mb 4.4 A REYKJANES RIDGE SC3
at [dynamic] 2 GMT/UTC LDEO update
www.ldeo.columbia.edu/~ekstrom/Research/SWD/current/RADB_SWD_grd.html
2013 4 28 22 52 16.0 57.25 -33.25 33.0 4.9 REYKJANES RIDGE
at [dynamic] 3 GMT/UTC LDEO update
2013 4 28 22 52 8.0 56.75 -33.75 33.0 4.9 REYKJANES RIDGE
earthquake.usgs.gov/monitoring/operations/data/Seismic_Data/telemetry_data/SFJD_24hr.html

edit on 28-4-2013 by wujotvowujotvowujotvo
because: (no reason given)
reply to post by ericblair4891
geez that area is littered with sites. How can you tell if they are active or at what stage each site is at? I see the storage tanks at some, some have vehicles and what looks like a derrick in the middle, some are just squares on light coloured ( gravel?)who knows how old these satelitte images are?
No respect for the dead either, one site is right beside a cemetary
oh well thats the price you pay for cheap gas.
We are paying just over $2/litre here, what you pay in the USA? 10$ a gallon? I doubt it and fracking makes that possible.
edit on 29-4-2013 by
muzzy because: (no reason given)
Since the activity in the M5 range went down the last few days, I am expecting a wave of bigger ones the next days
got 3.72 seconds?
1 -27 April, New Zealand earthquakes on 3.72 seconds (animation)
slower version here
I'm not sure if it is actually 3.72 seconds, I used my phones stopwatch. It doesn't actually say on the file properties.
Quite handy if you focus on one spot while it runs. Cook Strait has been quite active the last week. Auckland had 4 quakes
edit on
29-4-2013 by muzzy because: (no reason given)
South pacific area at 16 mhz and the sun is not there at the moment. Ionospheric Map www.ips.gov.au...
Im not going to say anything this time
Im not going to say anything this time
edit on 7/30/2012 by dreamfox1 because:
reply to post by dreamfox1
back
Just a small point here. If possible if you want us to look at the map at a specific time could you post an image rather than a link?
The image in the link moves on and it is not possible after an hour or so to see exactly what you are referring to.
Up to you. It would make things easier for us.
Your post is timed at 07:18 IST so that is 06:18 UTC. Unfortunately I don't have a copy of the image for 06:00 today, but I do have one for 06:00 on the 27th - and the Sun should be in the same position pretty much after only 2 days difference.
With reference to that map (if it is any use) can you point out where the 16 mHz was? (Especially since 16 mHz is not mentioned on the scale)
edit on 29/4/2013 by PuterMan because: This post received green decoration becuase someone stole the text I had written. Stealing text really
is not very nice and I would ask the perpetrator to kindly desist.
new topics
-
4 plans of US elites to defeat Russia
New World Order: 1 hours ago -
Thousands Of Young Ukrainian Men Trying To Flee The Country To Avoid Conscription And The War
Other Current Events: 4 hours ago -
12 jurors selected in Trump criminal trial
US Political Madness: 7 hours ago -
Iran launches Retalliation Strike 4.18.24
World War Three: 7 hours ago -
Israeli Missile Strikes in Iran, Explosions in Syria + Iraq
World War Three: 8 hours ago
top topics
-
George Knapp AMA on DI
Area 51 and other Facilities: 13 hours ago, 25 flags -
Israeli Missile Strikes in Iran, Explosions in Syria + Iraq
World War Three: 8 hours ago, 16 flags -
Louisiana Lawmakers Seek to Limit Public Access to Government Records
Political Issues: 16 hours ago, 7 flags -
Iran launches Retalliation Strike 4.18.24
World War Three: 7 hours ago, 6 flags -
Not Aliens but a Nazi Occult Inspired and then Science Rendered Design.
Aliens and UFOs: 13 hours ago, 5 flags -
12 jurors selected in Trump criminal trial
US Political Madness: 7 hours ago, 4 flags -
Thousands Of Young Ukrainian Men Trying To Flee The Country To Avoid Conscription And The War
Other Current Events: 4 hours ago, 4 flags -
The Tories may be wiped out after the Election - Serves them Right
Regional Politics: 17 hours ago, 3 flags -
4 plans of US elites to defeat Russia
New World Order: 1 hours ago, 2 flags
active topics
-
-@TH3WH17ERABB17- -Q- ---TIME TO SHOW THE WORLD--- -Part- --44--
Dissecting Disinformation • 538 • : cherokeetroy -
4 plans of US elites to defeat Russia
New World Order • 6 • : andy06shake -
So I saw about 30 UFOs in formation last night.
Aliens and UFOs • 24 • : TheMisguidedAngel -
Silent Moments --In Memory of Beloved Member TDDA
Short Stories • 44 • : Encia22 -
Mandela Effect - It Happened to Me!
The Gray Area • 110 • : BeTheGoddess2 -
Vogt and the twelve thousand year cycle
Fragile Earth • 27 • : Lanogaxeh -
12 jurors selected in Trump criminal trial
US Political Madness • 22 • : Disgusted123 -
British TV Presenter Refuses To Use Guest's Preferred Pronouns
Education and Media • 65 • : nugget1 -
Fossils in Greece Suggest Human Ancestors Evolved in Europe, Not Africa
Origins and Creationism • 61 • : strongfp -
Running Through Idiot Protestors Who Block The Road
Rant • 110 • : FlyersFan