It looks like you're using an Ad Blocker.
Please white-list or disable AboveTopSecret.com in your ad-blocking tool.
Thank you.
Some features of ATS will be disabled while you continue to use an ad-blocker.

Quake Watch 2013
page: 71share:
Getting bigger in that area......6.7ish in Paupa area.
earthquake.usgs.gov...
Look at the TEC maps for today....a buzzin' up a storm down under
There was a lot more grey in that area early this morning.
www.ips.gov.au...
earthquake.usgs.gov...
Look at the TEC maps for today....a buzzin' up a storm down under
edit on 13-4-2013 by radpetey because: (no reason given)
There was a lot more grey in that area early this morning.
www.ips.gov.au...
edit on 13-4-2013 by radpetey because: (no reason given)
edit on 13-4-2013 by radpetey
because: (no reason given)
edit on 13-4-2013 by radpetey because: (no reason given)
another bigger better World map for 12/04/2013.
[color=lime](click image for interactive map, opens in new tab/window)
Now also showing events from
CENC-China
CNIG-Spain
CWB-Taiwan
DDA-Turkey
GSRAS-Russia
GUC-Chile
IIEES-Iran
INETER-Central America
INGV-Italy
LDEO-
NIED-Japan
NORSAR-Scandanavia/Europe
PHIVOLCS -Philippines
RSNC-Colombia
RSPR-Puerto Rica
SSN-Mexico
TMD-Thailand/Burma
vedur-Iceland
I didn't get all of Japan NIED, I only saved from the 6.3ML onwards, it has moved to the 13-14th now.
Interesting Google maps won't show the Arctic Gakkel Ridge above Franz Josef Land
the quakes off the static map are the one Puterman posted here
and this one from NORSAR
That NORSAR is hard work, I picked out the text file for what I thought was the 12th (day102) and edited all phase data lines out of it (many 100's of them) to get the single lines with the info I needed, put it onto Excel, 119 events, then I noticed the date ........... 12/04/2010 ................... arrrrrghhhhh
In the end I used the "last week" page with only 8 lines
Not something I could do on a daily basis, too much variance on the formats, I'll wait until Puterman gets those others in the loop
[color=lime](click image for interactive map, opens in new tab/window)
Now also showing events from
CENC-China
CNIG-Spain
CWB-Taiwan
DDA-Turkey
GSRAS-Russia
GUC-Chile
IIEES-Iran
INETER-Central America
INGV-Italy
LDEO-
NIED-Japan
NORSAR-Scandanavia/Europe
PHIVOLCS -Philippines
RSNC-Colombia
RSPR-Puerto Rica
SSN-Mexico
TMD-Thailand/Burma
vedur-Iceland
I didn't get all of Japan NIED, I only saved from the 6.3ML onwards, it has moved to the 13-14th now.
Interesting Google maps won't show the Arctic Gakkel Ridge above Franz Josef Land
the quakes off the static map are the one Puterman posted here
Date/Time: 12/04/2013 10:15:09 UTC
Lat: 86.9867 Long: 57.2069
Magnitude: 4.4M/4.6 mb
Depth: 2 km
Location: NORTH OF FRANZ JOSEF LAND
Catalog Source: emsc, gfz and usgs
TTNT energy released: 119.7866
and this one from NORSAR
Date/Time: 12/04/2013 10:27:46 UTC
Lat: 86.02 Long: 67.83
Magnitude: 2.45 ML
No. of Stations:
Depth: 13.8 km
Location: NORTH OF FRANZ JOSEF LAND
Catalog Source: NORSAR
ID:
TTNT energy released: 0.0714
That NORSAR is hard work, I picked out the text file for what I thought was the 12th (day102) and edited all phase data lines out of it (many 100's of them) to get the single lines with the info I needed, put it onto Excel, 119 events, then I noticed the date ........... 12/04/2010 ................... arrrrrghhhhh
In the end I used the "last week" page with only 8 lines
Not something I could do on a daily basis, too much variance on the formats, I'll wait until Puterman gets those others in the loop
edit on 13-4-2013 by muzzy because: Philippines data is all mesed up, has 0 for all the Lat's, will go back and fix that
edit on 13-4-2013 by muzzy because: fixed it, still had the space tabs each side of the number. That PHIVOLCs is hard work too,
2-Apr-hour local time, why can' they do it like everyone else and have UTC and in dd/mm/yyyy hh:mm:ss
6.3ML,(5.7Mw), Awaji Island, Osaka Bay, Near S. Coast Of Western Honshu, Japan aftershocks at 27hrs
mag1= 154
mag2= 35
mag3= 10
mag4= 1
mag5= 0
mag6= 1
mag7= 0
total= 201
TTNT= 42,535.065
the map looks pretty much the same as it was at 5:11 hours afterwards, just denser, so rather than doing that again, here is something a bit different, this is the text file of the aftershocks up to 27hrs time elapsed.
edit on 14-4-2013 by muzzy because: (no reason given)
New danger zone for large quake is now between the Sichuan and Yunnan zone in China .
Yesterday it was in the Banda sea area .
www.abovetopsecret.com...
Ionospheric Map
www.ips.gov.au...
Seems to be very close to guessing were a large quake may happen.
The 14 Mhz area in light grey is the danger zone.
Idea came from this video
www.youtube.com...
www.nat-hazards-earth-syst-sci.net...
Nat. Hazards Earth Syst. Sci., 11, 2173-2180, 2011
www.nat-hazards-earth-syst-sci.net/11/2173/2011/
doi:10.5194/nhess-11-2173-2011
© Author(s) 2011. This work is distributed
under the Creative Commons Attribution 3.0 License.
Response of the ionospheric electron density to different types of seismic events
Y. He1, D. Yang1, J. Qian2, and M. Parrot3
1Institute of Geophysics, China Earthquake Administration, Beijing, China
2Institute of Earthquake Science, China Earthquake Administration, Beijing, China
3Laboratoire de Physique et Chimie de l'Environnement et de l'Espace, Centre National de la Recherche Scientifique, Orléans, France
Abstract. The electron density data recorded by the Langmuir Probe Instrument (ISL, Instrument Sonde de Langmuir) onboard the DEMETER satellite have been collected for nearly 4 yr (during 2006–2009) to perform a statistical analysis. During this time, more than 7000 earthquakes with a magnitude larger than or equal to 5.0 occurred all over the world. For the statistical studies, all these events have been divided into various categories on the basis of the seismic information, including Southern or Northern Hemisphere earthquakes, inland or sea earthquakes, earthquakes at different magnitude levels, earthquakes at different depth levels, isolated events and all events. To distinguish the pre-earthquake anomalies from the possible ionospheric anomalies related to the geomagnetic activity, the data were filtered with the Kp index. The statistical results obviously show that the electron density increases close to the epicentres both in the Northern and the Southern Hemisphere, but the position of the anomaly is slightly shifted to the north in the Northern Hemisphere and to the south in the Southern Hemisphere. The electron density related to both inland and sea earthquakes presents an anomaly approximately close to the epicentres, but the anomaly for sea earthquakes is more significant than for inland earthquakes. The intensity of the anomalies is enhanced when the magnitude increases and is reduced when the depth increases. A similar anomaly can also be seen in the statistical results concerning the isolated earthquakes. All these statistical results can help to better understand the preparation process of the earthquakes and their influence up to the ionospheric levels.
Yesterday it was in the Banda sea area .
www.abovetopsecret.com...
Ionospheric Map
www.ips.gov.au...
Seems to be very close to guessing were a large quake may happen.
The 14 Mhz area in light grey is the danger zone.
edit on 7/30/2012 by dreamfox1 because: www.ips.gov.au...
Idea came from this video
www.youtube.com...
www.nat-hazards-earth-syst-sci.net...
Nat. Hazards Earth Syst. Sci., 11, 2173-2180, 2011
www.nat-hazards-earth-syst-sci.net/11/2173/2011/
doi:10.5194/nhess-11-2173-2011
© Author(s) 2011. This work is distributed
under the Creative Commons Attribution 3.0 License.
Response of the ionospheric electron density to different types of seismic events
Y. He1, D. Yang1, J. Qian2, and M. Parrot3
1Institute of Geophysics, China Earthquake Administration, Beijing, China
2Institute of Earthquake Science, China Earthquake Administration, Beijing, China
3Laboratoire de Physique et Chimie de l'Environnement et de l'Espace, Centre National de la Recherche Scientifique, Orléans, France
Abstract. The electron density data recorded by the Langmuir Probe Instrument (ISL, Instrument Sonde de Langmuir) onboard the DEMETER satellite have been collected for nearly 4 yr (during 2006–2009) to perform a statistical analysis. During this time, more than 7000 earthquakes with a magnitude larger than or equal to 5.0 occurred all over the world. For the statistical studies, all these events have been divided into various categories on the basis of the seismic information, including Southern or Northern Hemisphere earthquakes, inland or sea earthquakes, earthquakes at different magnitude levels, earthquakes at different depth levels, isolated events and all events. To distinguish the pre-earthquake anomalies from the possible ionospheric anomalies related to the geomagnetic activity, the data were filtered with the Kp index. The statistical results obviously show that the electron density increases close to the epicentres both in the Northern and the Southern Hemisphere, but the position of the anomaly is slightly shifted to the north in the Northern Hemisphere and to the south in the Southern Hemisphere. The electron density related to both inland and sea earthquakes presents an anomaly approximately close to the epicentres, but the anomaly for sea earthquakes is more significant than for inland earthquakes. The intensity of the anomalies is enhanced when the magnitude increases and is reduced when the depth increases. A similar anomaly can also be seen in the statistical results concerning the isolated earthquakes. All these statistical results can help to better understand the preparation process of the earthquakes and their influence up to the ionospheric levels.
edit on 7/30/2012 by dreamfox1 because: (no reason
given)
edit on 7/30/2012 by dreamfox1 because: updates
edit on 7/30/2012 by dreamfox1 because:
iono.jpl.nasa.gov...
reply to post by radpetey
Just to remind you that the area of TEC disturbance basically follows the area of maximum insolation and therefore rotates around the world in a 24 hour period.
Believe me I have downloaded the NASA/JPL TEC maps every 5 minutes 24/7 for over a year (I have stopped now with over 150,000 images under my belt cluttering up disk) and I can find absolutely no correlation at all between the maps and the incidence of earthquakes.
These maps are actually theoretical being the predicted TEC affecting communications and are just simply NOT sophisticated enough to detail what the scientists look at for TEC changes before an earthquake.
The details on these maps are actually taken from ground based GPS stations - you can find lots of details on how it works - however the ones the scientists use are satellite based. Not the same thing at all. (See the post above this about the Demeter satellite)
Don't mean to burst anyone's bubble but in my honest opinion these particular TEC maps are of no use to us in pre-determining earthquakes.
I still put a version of the TEC map in with my earthquake reports, but it is probably a waste of time.
ETA:
I note that the Australian site refers to HF radar so maybe my comment that they use GPS stations is out of date? Don't really know and haven't the time to find out.
Basically what is does show is that these maps are based on GROUND BASED systems and not the same sa the satellites at all.
There was a lot more grey in that area early this morning.
Just to remind you that the area of TEC disturbance basically follows the area of maximum insolation and therefore rotates around the world in a 24 hour period.
Believe me I have downloaded the NASA/JPL TEC maps every 5 minutes 24/7 for over a year (I have stopped now with over 150,000 images under my belt cluttering up disk) and I can find absolutely no correlation at all between the maps and the incidence of earthquakes.
These maps are actually theoretical being the predicted TEC affecting communications and are just simply NOT sophisticated enough to detail what the scientists look at for TEC changes before an earthquake.
The details on these maps are actually taken from ground based GPS stations - you can find lots of details on how it works - however the ones the scientists use are satellite based. Not the same thing at all. (See the post above this about the Demeter satellite)
Don't mean to burst anyone's bubble but in my honest opinion these particular TEC maps are of no use to us in pre-determining earthquakes.
I still put a version of the TEC map in with my earthquake reports, but it is probably a waste of time.
edit on 14/4/2013 by PuterMan because: (no reason given)
ETA:
The most widely used instrument for ionospheric measurement is the ionosonde. The ionosonde is essentially a high frequency radar which sends short pulses of radio energy into the ionosphere. If the radio frequency is not too high, the pulses are reflected back to earth.
The ionosonde records the time delay between transmission and reception of the pulses. By varying the frequency of the pulses (typically 1-22MHz), a record is obtained of the time delay at different frequencies. This record is referred to as an ionogram.
I note that the Australian site refers to HF radar so maybe my comment that they use GPS stations is out of date? Don't really know and haven't the time to find out.
Basically what is does show is that these maps are based on GROUND BASED systems and not the same sa the satellites at all.
edit on 14/4/2013 by PuterMan because: (no reason given)
Originally posted by PuterMan
reply to post by radpetey
There was a lot more grey in that area early this morning.
Just to remind you that the area of TEC disturbance basically follows the area of maximum insolation and therefore rotates around the world in a 24 hour period.
Believe me I have downloaded the NASA/JPL TEC maps every 5 minutes 24/7 for over a year (I have stopped now with over 150,000 images under my belt cluttering up disk) and I can find absolutely no correlation at all between the maps and the incidence of earthquakes.
These maps are actually theoretical being the predicted TEC affecting communications and are just simply NOT sophisticated enough to detail what the scientists look at for TEC changes before an earthquake.
The details on these maps are actually taken from ground based GPS stations - you can find lots of details on how it works - however the ones the scientists use are satellite based. Not the same thing at all. (See the post above this about the Demeter satellite)
Don't mean to burst anyone's bubble but in my honest opinion these particular TEC maps are of no use to us in pre-determining earthquakes.
I still put a version of the TEC map in with my earthquake reports, but it is probably a waste of time.
edit on 14/4/2013 by PuterMan because: (no reason given)
ETA:
The most widely used instrument for ionospheric measurement is the ionosonde. The ionosonde is essentially a high frequency radar which sends short pulses of radio energy into the ionosphere. If the radio frequency is not too high, the pulses are reflected back to earth.
The ionosonde records the time delay between transmission and reception of the pulses. By varying the frequency of the pulses (typically 1-22MHz), a record is obtained of the time delay at different frequencies. This record is referred to as an ionogram.
I note that the Australian site refers to HF radar so maybe my comment that they use GPS stations is out of date? Don't really know and haven't the time to find out.
Basically what is does show is that these maps are based on GROUND BASED systems and not the same sa the satellites at all.
edit on 14/4/2013 by PuterMan because: (no reason given)
Thanks for that info!!
I haven't been able to access USGS IRIS maps since yesterday . It tells me FORBIDDEN. Not sure what that's about.
reply to post by ujustneverknow
What link are you using. Can you give an example?
I have had only intermittent Internet all day - some one burnt the cable in the bog I think. Wonderful!
Mm. Looks like an IRIS problem
Error:
error while generating plot java.io.FileNotFoundException: /budnas/bud/AK/BAL/BAL.AK..BHE.2013.104 (No such file or directory)
Can't get any seismograms in my program either so I am pretty sure that IRIS is broken.
edit on 14/4/2013 by PuterMan because: (no reason given)
Lamont-Doherty Earth Observatory (LDEO) is offline too
I see a pending gap in my records again, last download I did was 11th April
Hopefully they are shut down so they can install a searchable database
Oh, while I'm here, my China page for 2012 to 2013 has been reconfigured to include E. Russia-N.E Border Region
here
Good news is Chile search page is accessible again, I e-mailed them when it was broken down, but they never replied.
ha its back on now
I see a pending gap in my records again, last download I did was 11th April
Hopefully they are shut down so they can install a searchable database
Oh, while I'm here, my China page for 2012 to 2013 has been reconfigured to include E. Russia-N.E Border Region
here
edit on 14-4-2013 by muzzy because: (no reason given)
Good news is Chile search page is accessible again, I e-mailed them when it was broken down, but they never replied.
edit on 14-4-2013 by muzzy because: (no reason given)
ha its back on now
edit on 14-4-2013 by muzzy because: (no reason given)
From the Iris homepage, it looks like they had a power outage, and are doing a major system upgrade this
morning.IRIS
It seems a few networks are not available in GEE right now, too. I can't get CI (California), or the PB (plate boundary) stations to load. Bummer...
ETA:
The Earthscope Transportable Array is currently moving to the U.S. east coast. So, there are new stations available on the TA network for folks to follow the shaking in the Southeast, and in a few weeks, the Northeast. They are currently installing in Virginia and working north.
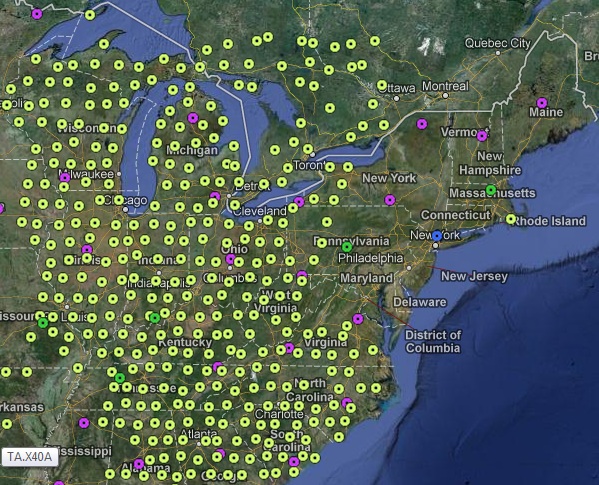
map of station deployments
You can load stations in GEE, access station data here, or see a snapshot of the past 2 and 24 hours on these pages. (click around on the tabs at the top for different areas and amount of data shown)
Warning!
Do not be tempted to use the "earthquakes" tab from the last 2 links I gave above...it is preliminary data & has many false alarms and inaccurate quake locations listed.
Repeat---not reliable info. (the snapshot pages of TA stations at that link are fine)
It seems a few networks are not available in GEE right now, too. I can't get CI (California), or the PB (plate boundary) stations to load. Bummer...
ETA:
The Earthscope Transportable Array is currently moving to the U.S. east coast. So, there are new stations available on the TA network for folks to follow the shaking in the Southeast, and in a few weeks, the Northeast. They are currently installing in Virginia and working north.
map of station deployments
You can load stations in GEE, access station data here, or see a snapshot of the past 2 and 24 hours on these pages. (click around on the tabs at the top for different areas and amount of data shown)
edit on 4/15/2013 by Olivine because: add info
Warning!
Do not be tempted to use the "earthquakes" tab from the last 2 links I gave above...it is preliminary data & has many false alarms and inaccurate quake locations listed.
Repeat---not reliable info. (the snapshot pages of TA stations at that link are fine)
edit on 4/15/2013 by Olivine
because: add disclaimer before folks start posting about 6.2 eq's in the gulf of mexico
edit on 4/15/2013 by Olivine because: (no
reason given)
reply to post by Olivine
Yeah! More toys, er, I mean tools!!!
Lots of info to wilf in!
Thanks, Olivine!
There will be a station only about 15 miles from me! (As the crow flies!)
The closest one I had found so far, I found a few months ago.
It's at a college about 35-40 miles from here.
Not that I'm expecting to see anything on it, I'm in PA!
Maybe some seismic testing/fracking traces!
I did see an archive link back to 2005, I think it was.
When I have more time, I want to look up the 5.8 in VA in Aug 2011.
That was my first real eq!
When I lived in Hawaii I thought I felt something, but it was just a very small,
short vibration, that I thought I felt when I was sitting with my back againt the wall!
Never found out if it really was something!
We have heard the Seneca Guns a few times here in the last 3 years,
so this will come in handy to see if anything ever shows up!!!
WOQ
reply to post by Olivine
Ah well, what the hell. I only just got back on line myself after being off most of the day. Seems the ISP has various problems still turning up as the result of people setting fire to the bog and burning/melting the cable from/to the main mast.
His words to them on Facebook were full of invective and completely out of character!!
I have to sat it: Is it me or is it quiet? I expected a barrage of quakes when I got back on and it hardly increased the list (M3.5+) at all.
It is nearly ready BTW Olivine. Will be in touch. (That was a secret message that should be ignored by everyone else )
reply to post by PuterMan
Sorry, just getting caught up!
Yes, the Great Salt Lake is really a lake.
www.utah.com...
Did the slide show up on the mine lists?
I was wondering...since there was a 5.1 & a 4.9, an hour & a half apart...
Looking at the picture, could the slide have gone half way down to the midlevel.
Then when that was finished & enough weight /pressure built up,
it let loose again & finished sliding all the way to the bottom of the pit?
www.deseretnews.com...
It was funny that they only mentioned one slide!
WOQ
No one worried too about the series of recent Oklahoma shakers???
Felt by anyone?
Leading up to anything I wonder...
Felt by anyone?
Leading up to anything I wonder...
Apologies if anyone has posted this already - don't have time to look back
Earthquake activity east of Grímsey has decreased
This and other images in the article
Link to PDF of the above articles
Go to the bottom of the page.
Earthquake activity east of Grímsey has decreased
This and other images in the article

Link to PDF of the above articles
Go to the bottom of the page.
edit on 16/4/2013 by PuterMan because: (no reason given)
reply to post by wasobservingquietly
Not yet. Seems to be stuck on 11th March. The list are ROUTINE mining seismicity so it may not get on the list as it could hardly be called routine!
There were three slides if you look at the seismogram.
Did the slide show up on the mine lists?
Not yet. Seems to be stuck on 11th March. The list are ROUTINE mining seismicity so it may not get on the list as it could hardly be called routine!
There were three slides if you look at the seismogram.
earthquake.usgs.gov...
Oklahoma
Oklahoma
4.2 ; M
8km ENE of Luther, Oklahoma ; Location
2013-04-16 10:16:53: Time
35.687°N : Lat.
97.109°W : Lon.
5.0: D
3.3: M
7km E of Luther, Oklahoma: Location
2013-04-16 07:16:43 Time
35.650°N: Lat
97.117°W : Lon.
5.0: D
2.8: m
14km NNW of Boley, Oklahoma: Location
2013-04-16 07:15:36: Time
35.608°N: Lat
96.558°W: Lon
5.0: D
4.3: M
12km ENE of Luther, Oklahoma: Location
2013-04-16 06:56:30: Time
35.685°N: Lat
97.066°W: Lon
5.0: D
3.0: M
5km WSW of Chandler, Oklahoma: Location
2013-04-16 06:45:27: Time
35.677°N: Lat
96.940°W: Lon
4.9: D
edit on 16-4-2013 by azureskys because: corrections
edit on 16-4-2013 by azureskys because: added
info
edit on 16-4-2013 by azureskys because: added info
edit on 16-4-2013 by azureskys because: Improved visual
info
edit on 16-4-2013 by azureskys because: add on
edit on 16-4-2013 by azureskys because: removed old data
earthquake.usgs.gov...
Wyoming
Wyoming
3.0: M
18km SE of Old Faithful Geyser, Wyoming: Location
2013-04-16 09:46:48: Time
44.329°N: Lat
110.686°W: lon
8.3: D
edit on 16-4-2013 by azureskys because: added info
edit on 16-4-2013 by azureskys because: add on
earthquake.usgs.gov...
Iran-Pakistan border region
Iran-Pakistan border region
7.8: M
86km ESE of Khash, Iran: Location
2013-04-16 10:44:13: Time
28.056°N: Lat
62.080°E: Lon
15.2: D
edit on 16-4-2013 by azureskys because: add on
7.8 magnitude earthquake strikes Iran – Pakistan border region. No word on injuries or damage. - USGS
M7.8 - 86km ESE of Khash, Iran
2013-04-16 10:44:13 UTC
2013-04-16 10:44:13 UTC
2013-04-16 15:14:13 UTC+04:30 at epicenter
2013-04-16 06:44:13 UTC-04:00 system time
Location
28.056°N 62.080°E depth=15.2km (9.4mi)
Nearby Cities
86km (53mi) ESE of Khash, Iran
167km (104mi) NE of Iranshahr, Iran
199km (124mi) SE of Zahedan, Iran
237km (147mi) SSW of Rudbar, Afghanistan
603km (375mi) NE of Muscat, Oman
edit on 16-4-2013 by kennvideo because: more info
edit on 16-4-2013 by kennvideo because: more
info
new topics
-
God's Righteousness is Greater than Our Wrath
Religion, Faith, And Theology: 40 minutes ago -
Electrical tricks for saving money
Education and Media: 3 hours ago -
VP's Secret Service agent brawls with other agents at Andrews
Mainstream News: 5 hours ago -
Sunak spinning the sickness figures
Other Current Events: 5 hours ago -
Nearly 70% Of Americans Want Talks To End War In Ukraine
Political Issues: 5 hours ago -
Late Night with the Devil - a really good unusual modern horror film.
Movies: 7 hours ago -
Cats Used as Live Bait to Train Ferocious Pitbulls in Illegal NYC Dogfighting
Social Issues and Civil Unrest: 9 hours ago -
The Good News According to Jesus - Episode 1
Religion, Faith, And Theology: 11 hours ago
top topics
-
Florida man's trip overseas ends in shock over $143,000 T-Mobile phone bill
Social Issues and Civil Unrest: 16 hours ago, 8 flags -
Cats Used as Live Bait to Train Ferocious Pitbulls in Illegal NYC Dogfighting
Social Issues and Civil Unrest: 9 hours ago, 8 flags -
VP's Secret Service agent brawls with other agents at Andrews
Mainstream News: 5 hours ago, 8 flags -
Bobiverse
Fantasy & Science Fiction: 16 hours ago, 3 flags -
HORRIBLE !! Russian Soldier Drinking Own Urine To Survive In Battle
World War Three: 13 hours ago, 3 flags -
Electrical tricks for saving money
Education and Media: 3 hours ago, 3 flags -
Nearly 70% Of Americans Want Talks To End War In Ukraine
Political Issues: 5 hours ago, 3 flags -
Sunak spinning the sickness figures
Other Current Events: 5 hours ago, 3 flags -
Late Night with the Devil - a really good unusual modern horror film.
Movies: 7 hours ago, 2 flags -
The Good News According to Jesus - Episode 1
Religion, Faith, And Theology: 11 hours ago, 1 flags
active topics
-
VP's Secret Service agent brawls with other agents at Andrews
Mainstream News • 34 • : WeMustCare -
New whistleblower Jason Sands speaks on Twitter Spaces last night.
Aliens and UFOs • 53 • : pianopraze -
Sunak spinning the sickness figures
Other Current Events • 5 • : glen200376 -
SETI chief says US has no evidence for alien technology. 'And we never have'
Aliens and UFOs • 44 • : MikeDeGrasseTyson -
HORRIBLE !! Russian Soldier Drinking Own Urine To Survive In Battle
World War Three • 31 • : budzprime69 -
How ageing is" immune deficiency"
Medical Issues & Conspiracies • 33 • : rickymouse -
The Reality of the Laser
Military Projects • 46 • : Zaphod58 -
God's Righteousness is Greater than Our Wrath
Religion, Faith, And Theology • 0 • : randomuser2034 -
President BIDEN Vows to Make Americans Pay More Federal Taxes in 2025 - Political Suicide.
2024 Elections • 136 • : ImagoDei -
Electrical tricks for saving money
Education and Media • 3 • : Mike72