It looks like you're using an Ad Blocker.
Please white-list or disable AboveTopSecret.com in your ad-blocking tool.
Thank you.
Some features of ATS will be disabled while you continue to use an ad-blocker.

Quake Watch 2013
page: 65share:
reply to post by muzzy
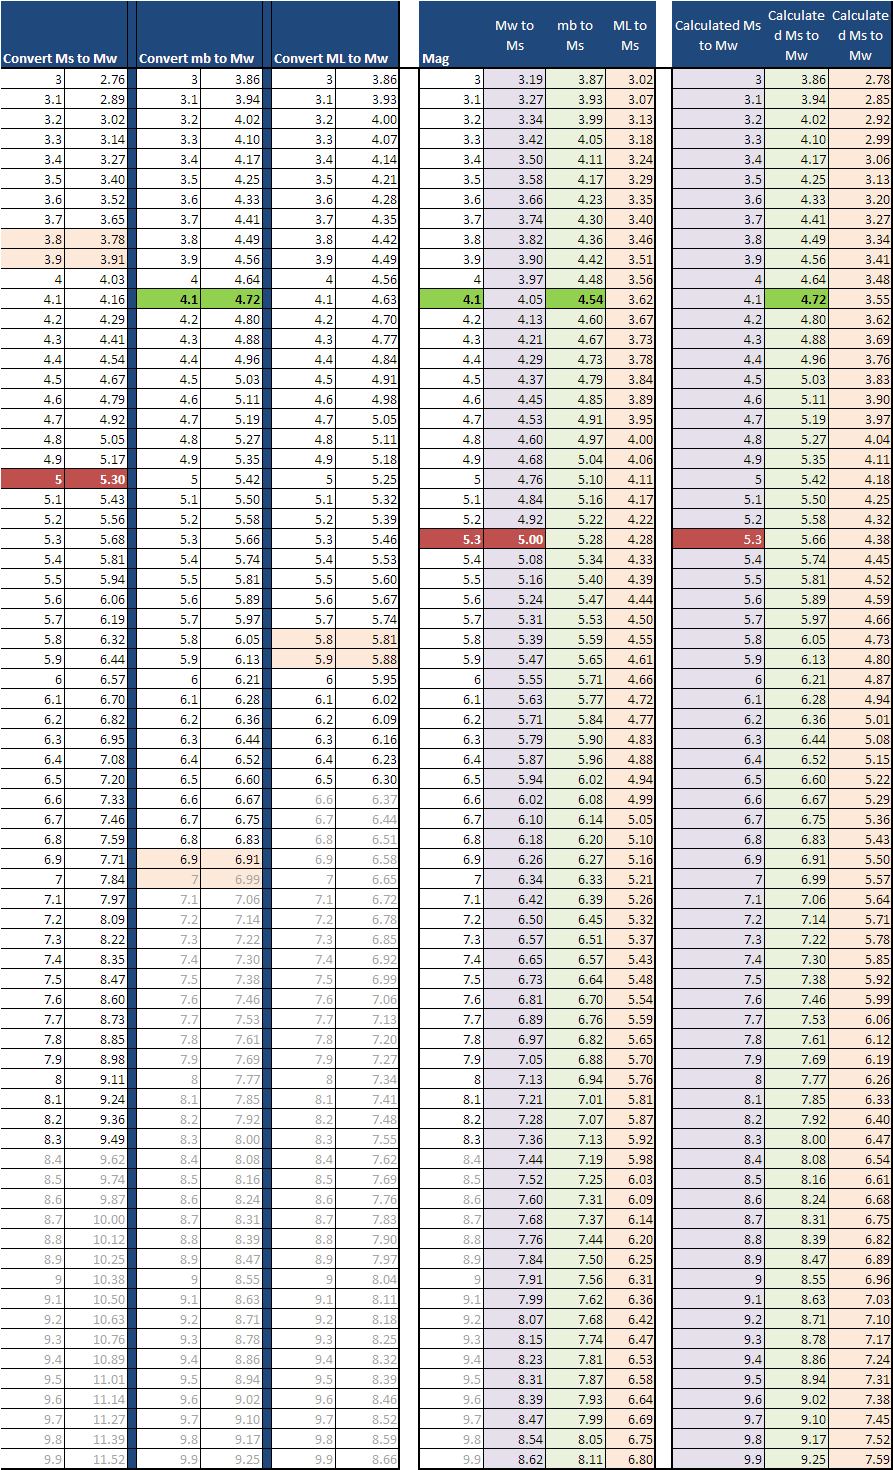
You found and gave us the conversion from Ms to Mw
=(magnitude Ms*1.269)-1.0436
Therefore Mw to Ms should be
=(magnitude Mw+1.0436)/1.269
Based on the value you found for mb to Mw then mb to Ms should be
=((magnitude mb*0.7813)+2.5611)/1.269
And I think ML to Ms should be
=((magnitude ML*0.696)+1.7396)/1.269
As you say however these are probably regional but it should give some idea.
Extended my magnitudes converter. Seems to work. I have highlighted a couple (green and red) as checks
Click for the bigger picture
I have emailed you the spreadsheet page
That is why I need the formula to convert to Ms, otherwise their data is useless for this project.
You found and gave us the conversion from Ms to Mw
=(magnitude Ms*1.269)-1.0436
Therefore Mw to Ms should be
=(magnitude Mw+1.0436)/1.269
Based on the value you found for mb to Mw then mb to Ms should be
=((magnitude mb*0.7813)+2.5611)/1.269
And I think ML to Ms should be
=((magnitude ML*0.696)+1.7396)/1.269
As you say however these are probably regional but it should give some idea.
Extended my magnitudes converter. Seems to work. I have highlighted a couple (green and red) as checks
Click for the bigger picture

I have emailed you the spreadsheet page
edit on 1/4/2013 by PuterMan because: (no reason given)
reply to post by PuterMan
Thanks
I looked everywhere on my computer for that formula but couldn't find it or even the pdf file I found on GFZ.
Now I can match them all to Ms.
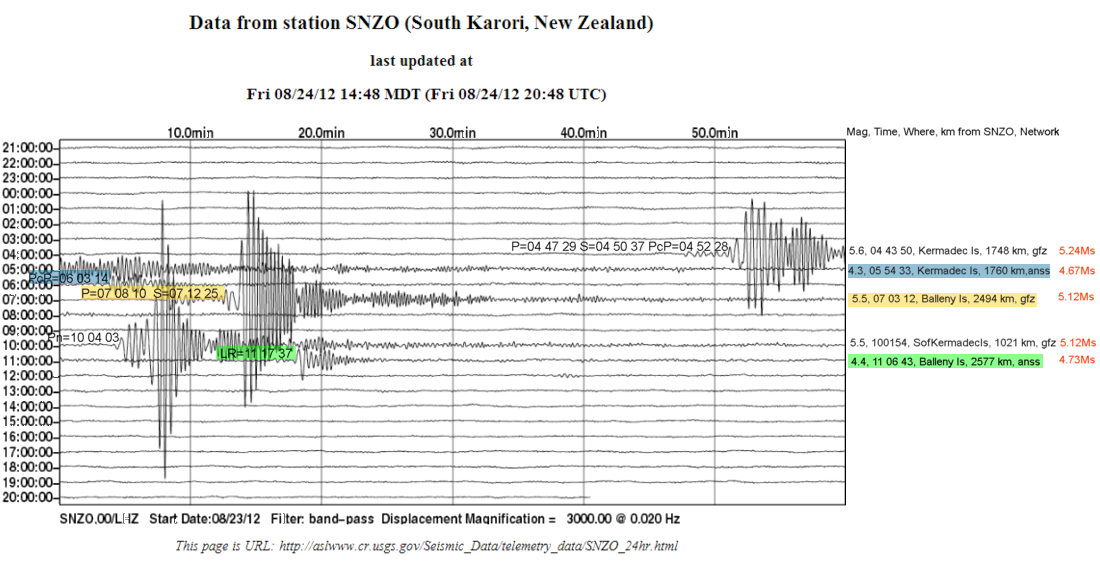
I converted that one I mentioned all to Ms, yes it is making sense now, on this one the GFZ mags are Mw but the ANSS are mb.

Its starting to look right, those small 4's should have only been a tiny wiggle, but if you convert them to Ms they are up getting near mag 4.7ish mark which do show on SNZO.
Makes sense witht he distance from SNZO in there now, the Kerm, 5.6 being smaller than the 5.5 had me scratching my head, now it makes sense, it was 727km further away.
The descriptions on the side are getting a bit messy now, will try and make a table layout that will fit alongside the graph to tidy it up.
there thats better, table in excel, copy and paste into graph image, made it into a GIF as well, that cut the size down from 329k to 88k.
that leaves 181 graphs to do ................ yeah right
Thanks
I looked everywhere on my computer for that formula but couldn't find it or even the pdf file I found on GFZ.
Now I can match them all to Ms.
I converted that one I mentioned all to Ms, yes it is making sense now, on this one the GFZ mags are Mw but the ANSS are mb.
Its starting to look right, those small 4's should have only been a tiny wiggle, but if you convert them to Ms they are up getting near mag 4.7ish mark which do show on SNZO.
Makes sense witht he distance from SNZO in there now, the Kerm, 5.6 being smaller than the 5.5 had me scratching my head, now it makes sense, it was 727km further away.
The descriptions on the side are getting a bit messy now, will try and make a table layout that will fit alongside the graph to tidy it up.
edit on 1-4-2013 by muzzy because: (no reason given)
there thats better, table in excel, copy and paste into graph image, made it into a GIF as well, that cut the size down from 329k to 88k.
that leaves 181 graphs to do ................ yeah right
edit on 1-4-2013 by muzzy because: (no reason given)
reply to post by PuterMan
Clearly, it was two. lol
I guess technically it would be more than two since the 3.2
And this loner right before...
Is it safe to use www.seis.utah.edu... for confirming Yellowstone quakes?
Yes, just one - that is unless you count the small one about 2 minutes afterwards
Clearly, it was two. lol
I guess technically it would be more than two since the 3.2
-0.2 2013/04/01 12:33:57 44.733N 110.933W 5.7 16 km (10 mi) ENE of West Yellowstone,
MT 0.4 2013/04/01 07:18:45 44.805N 110.995W 5.1 18 km (11 mi) NNE of West Yellowstone,
MT -0.3 2013/04/01 07:05:50 44.803N 110.998W 5.0 18 km (11 mi) NNE of West Yellowstone,
MT 0.4 2013/04/01 06:38:19 44.813N 110.997W 8.0 19 km (12 mi) NNE of West Yellowstone,
MT 0.6 2013/04/01 00:47:25 44.651N 111.117W 9.3 2 km ( 1 mi) SW of West Yellowstone,
MT 0.5 2013/03/31 23:22:24 44.810N 110.995W 5.1 19 km (12 mi) NNE of West Yellowstone,
MT 0.9 2013/03/31 22:10:42 44.806N 110.995W 9.1 18 km (11 mi) NNE of West Yellowstone,
MT 1.3 2013/03/31 21:49:17 44.822N 110.996W 13.1 20 km (12 mi) NNE of West Yellowstone,
MT 0.3 2013/03/31 18:47:55 44.812N 110.990W 9.7 19 km (12 mi) NNE of West Yellowstone,
MT 0.7 2013/03/31 15:24:41 44.804N 110.992W 8.6 18 km (11 mi) NNE of West Yellowstone,
MT -0.2 2013/03/31 15:15:41 44.805N 110.990W 8.0 18 km (11 mi) NNE of West Yellowstone,
MT 1.4 2013/03/31 13:05:42 44.814N 110.993W 10.6 19 km (12 mi) NNE of West Yellowstone,
MT 0.1 2013/03/31 11:58:37 44.806N 110.993W 5.9 18 km (11 mi) NNE of West Yellowstone,
MT 3.2 2013/03/31 11:41:08 44.806N 110.999W 11.3 18 km (11 mi) NNE of West Yellowstone,
And this loner right before...
1.9 2013/03/31 08:28:29 44.798N 110.995W 10.2 17 km (11 mi) NNE of West Yellowstone, MT
Is it safe to use www.seis.utah.edu... for confirming Yellowstone quakes?
Something is happening in Tjörnes Fracture Zone at Iceland. Quake swarm has been continuing 3 days already, and its getting stronger and stronger.
The quakes are on wide area, so I don't think its a volcano. Most of them happen on slightly east from Grimsey volcanic island. The island lies
directly above the Mid-Atlantic Ridge where Eurasian and North American plate are separating, forming new land between them. That region is getting a
lot pressure and quake swarms are not rare.

The green stars are quakes stronger than M3
Here is detailed map of area:

From: www.sciencedirect.com...
The green stars are quakes stronger than M3
Here is detailed map of area:
From: www.sciencedirect.com...
edit on 2-4-2013 by Thebel because: (no reason given)
reply to post by Thebel
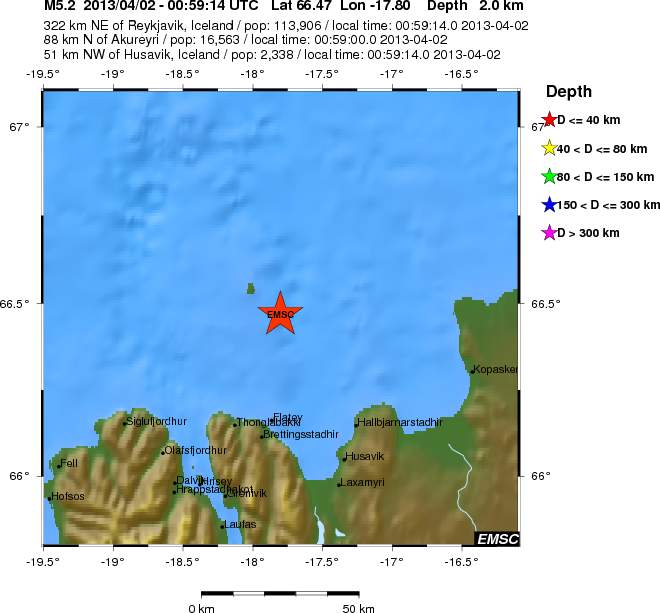
Building up to this one perhaps?
ETA: Did a page for this one
www.emsc-csem.org...
Agreed. It is an area where there are frequently many earthquakes, as you said, and I would say this is definitely tectonic. I don't think it is anything out the ordinary for the area,
Building up to this one perhaps?
ETA: Did a page for this one
Magnitude mb 5.2
Region ICELAND REGION
Date time 2013-04-02 00:59:14.0 UTC
Location 66.47 N ; 17.80 W
Depth 2 km
Distances 322 km NE of Reykjavík, Iceland / pop: 113,906 / local time: 00:59:14.0 2013-04-02
88 km N of Akureyri / pop: 16,563 / local time: 00:59:00.0 2013-04-02
51 km NW of Húsavík, Iceland / pop: 2,338 / local time: 00:59:14.0 2013-04-02
www.emsc-csem.org...
The quakes are on wide area, so I don't think its a volcano.
Agreed. It is an area where there are frequently many earthquakes, as you said, and I would say this is definitely tectonic. I don't think it is anything out the ordinary for the area,
edit on 2/4/2013 by PuterMan because: (no reason given)
Can please someone remind me what that outlining all around all those little quakes mean on this map from Icelandic met?
en.vedur.is...=map
The tremor graphs are giving us an increase in activity on the 2-4 Hz, blue line for Today related to all the tectonic activity around there that we are seeing.
hraun.vedur.is...
hraun.vedur.is...
hraun.vedur.is...
hraun.vedur.is...
Earthquake swarms are quite normal there. What has me puzzled is that the activity started way before the 5.4 and 5.3 (this one still needs to be fully checked it seems) so we can't really speak about aftershocks from one single moderate event here. To me it seems like a buillding up with small release before the moderate event, followed by aftershocks after the 5.4/5.3 events.
I know this should probably go in a thread of its own, or even in one of eric's threads...but I have elected to put it here because of the increase
in magnitude of quakes due to frakking. This is a joint study between the US army and US Geological Survey. I thought it might throw new light on eq
mags in places like Arkansas and a line perhaps cannot be drawn between which is a frakking eq and a 'normal' eq.
New Study Suggests Disturbing Link Between Fracking and Large Earthquakes
Full article here....
www.activistpost.com...
Rainbows
Jane
New Study Suggests Disturbing Link Between Fracking and Large Earthquakes
Subsurface data indicate that fluid was injected into effectively sealed compartments, and we interpret that a net fluid volume increase after 18 yr of injection lowered effective stress on reservoir-bounding faults. Significantly, this case indicates that decades-long lags between the commencement of fluid injection and the onset of induced earthquakes are possible, and modifies our common criteria for fluid-induced events. The progressive rupture of three fault planes in this sequence suggests that stress changes from the initial rupture triggered the successive earthquakes, including one larger than the first [emphasis added]. (Source)
This is a worrisome conclusion which seems to indicate that even if fracking is halted, earthquake activity can continue as a result of previous activity, and earthquake magnitude can increase over time.
Full article here....
www.activistpost.com...
Rainbows
Jane
Seems like the swarm at TFZ is getting stronger all the time. So many green stars at place. Intensity rocketed after 5.4 during the night. This swarm
is rare in that case that quakes are stronger than M5. Its just too strong earthquake for this area. There has been 381 quakes in last 48 hours, 29 of
them are stronger than M3, highest being 5.4. They all originate from different depths, from 23km to surface level.
I have monitored activity of this area and never seen so strong quake swarms. I don't have any idea could this cause even stronger quakes.
Definitely not volcanic activity, this comes from Grimsey lineament. Last great swarm there was during December 2012 and it has been relatively quiet since then.
This earthquake, back in January, which always was rated 6.0 by both EMSC and
GFZ
was originally 5.9 Mw according to USGS. This did not change during the 30 days or I would have picked it up so some time AFTER the 30 days it has changed to Mag 6.1 (In the ANSS Catalogue) and is no longer visible on the USGS site. Question is, will it be included in the USGS figures at the end of the year?????
ETA: This was the line as originally posted by USGS
2013-01-21 22:22:54, 4.961, 96.082, 5.9, 16.6, Northern Sumatra. Ind. [Map]
Magnitude Mw 6.0
Region NORTHERN SUMATRA, INDONESIA
Date time 2013-01-21 22:22:51.0 UTC
Location 4.98 N ; 95.97 E
Depth 2 km
Distances 337 km NW Medan (pop 1,750,971 ; local time 05:22:51.5 2013-01-22)
96 km SE Banda aceh (pop 250,757 ; local time 05:22:51.5 2013-01-22)
43 km SW Dewantara (pop 40,393 ; local time 05:22:51.5 2013-01-22)
was originally 5.9 Mw according to USGS. This did not change during the 30 days or I would have picked it up so some time AFTER the 30 days it has changed to Mag 6.1 (In the ANSS Catalogue) and is no longer visible on the USGS site. Question is, will it be included in the USGS figures at the end of the year?????
2013/01/21 22:22:52.90,4.9660,95.8560,11.60,6.10,Mw,479,18,1,1.16,NEI,2013012120
ETA: This was the line as originally posted by USGS
2013-01-21 22:22:54, 4.961, 96.082, 5.9, 16.6, Northern Sumatra. Ind. [Map]
edit on 2/4/2013 by PuterMan because: (no reason given)
reply to post by PuterMan
Hey there Puterman, how long have you been listing the celestial data with your quake posts?
I hadn't noticed it before today, but that isn't surprising, lol.
With your data all in one place, we should be able to catch any pattern present, or put the celestial-influence-on-larger-earthquakes hypothesis on the shelf.
Nice work
edit on 4/2/2013 by Olivine because: (no reason given)
Sudden uptick in Iceland Region happening today.
Maybe a sign that something big is on its way.
CSEM-EMSC Feed
April 3 2013, 00:36:28 UTC Iceland Region 3.6 April 3 2013, 00:29:49 UTC Iceland Region 3.9
April 3 2013, 00:29:46 UTC Iceland Region 4.2
April 3 2013, 00:25:58 UTC Iceland Region 3.6
April 3 2013, 00:22:59 UTC Iceland Region 3.5
April 3 2013, 00:22:54 UTC Iceland Region 4.3
April 3 2013, 00:19:08 UTC Iceland Region 3.4
April 2 2013, 23:26:59 UTC Iceland Region 3.7
April 2 2013, 23:13:40 UTC Iceland Region 3.9
April 2 2013, 23:05:10 UTC Iceland Region 4.5
April 2 2013, 22:52:13 UTC Iceland Region 4.3
April 2 2013, 22:28:21 UTC Iceland Region 3.3
April 2 2013, 22:09:55 UTC Iceland Region 4.2
April 2 2013, 22:07:37 UTC Iceland Region 4.3
April 2 2013, 21:59:44 UTC Iceland Region 3.3
April 2 2013, 21:44:00 UTC Iceland Region 3.4
April 2 2013, 20:27:54 UTC Iceland Region 3.7
April 2 2013, 13:38:18 UTC Iceland Region 3.3
edit on 7/30/2012 by dreamfox1 because: quakes.globalincidentmap.com...
reply to post by dreamfox1
Tjörnes Fracture Zone is not capable of producing any larger earthquakes, or shouldn't be. But we never know. Its a "Zig zag" fault where 2 plates are pulling away from each other. They grind each other same time. One thing is certain, some day there is new island on this exact spot, east of Grimsey. Maybe we are experiencing birth of new volcano. This is very rare event, it has been 2 days since the M5,4 earthquake, and the swarm isn't weakening at all. There has been swarms like these before too, last one being in 2002.
Someone should go check the area with submarine, there might be underwater fireworks there.
There is some GPS stations nearby, but seems like every GPS station in Iceland is offline. They don't draw the graph.
edit on 3-4-2013 by
Thebel because: (no reason given)
Found some recent news
Update to my last post: Tjörnes Fracture Zone can cause M7.0 quakes, but its impossible to know when or does that happen. Its also impossible to know, does this swarm continue for days or months. Energy that is released from this swarm should be enormous, but quakes not necessarily lower the tension. They could build up the tension even higher. It comes more dangerous when quake epicenter is moving towards land, to the southeast along the fault line.
03.04.2013 | 10:06 North Iceland Quakes Move Closer to Land A new earthquake swarm formed 15-20 kilometers southeast of the epicenter of the 5.5 earthquake by Grímsey island off North Iceland last night. The strongest quakes of last night had a magnitude of 4.6 and 4.7.
The Civil Protection Department declared a level of uncertainty yesterday due to the seismic activity, visir.is reports.
The new epicenter lies closer to the mainland and the earthquakes could be felt widely in North Iceland, including Akureyri. Early this morning one quake hit in Öxarfjörður fjord in Northeast Iceland.
The seismic activity does not seem to be subsiding. The Civil Protection Department pointed out in a statement that six series of earthquakes which have occurred in the region since 1969 have lasted days or weeks.
IcelandReview
Update to my last post: Tjörnes Fracture Zone can cause M7.0 quakes, but its impossible to know when or does that happen. Its also impossible to know, does this swarm continue for days or months. Energy that is released from this swarm should be enormous, but quakes not necessarily lower the tension. They could build up the tension even higher. It comes more dangerous when quake epicenter is moving towards land, to the southeast along the fault line.
wat is the connection between the canari islands and Iceland???
they seemes to go in tandem all the time over the years...
i notist it the last time the canari had an swarm and icland followed ...now again....
they seemes to go in tandem all the time over the years...
i notist it the last time the canari had an swarm and icland followed ...now again....
reply to post by Olivine
Not long - only about 2 years (Might be a little less and it took a while for the format to settle)
I also now list the celestial data in the weekly geophysical in terms of AP and SFU at least.
This week's geo is a bit delayed as I am writing it into a program because it takes so long to do. The program, which is nearly running now, should save me several hours each week.
Just me being alarmist I'm sure. But the U.S. eastern quakes seem to be in a line. I don't have google earth on this computer. I'm sure if you draw a
line from the West Virginia quake over to Oklahoma, you'll see they're kinda lining up. I'd call the area a bit of a cluster muck right now, being
that this activity bucks the long term lull that's been in place. There's been quakes, but not like we've seen over the last few years. Oklahoma and
Texas have made it seem like there's been a constant drum beat. Sorry, I didn't even mean to write- I'll dump some links on here that relate to
everything and my own cluster muck thinking.
First I want to start with things I didn't know.
I did know some of these following facts, but definitely not all.
www.youtube.com...
Earthquakes can cause avalanches. And if you watch carefully during the rock avalanche, it looks just like fluid. That's my theory. It's all about water. And fluids. Because as we keep learning, even rocks and solid ground can turn into a fluid state.
Here's some stuff I didn't know as well. I think this video was made before Banda Aceh and Japan. Because he doesn't mention them when he describes mega thrusts. I knew about Cascadia. Don't we all????
oops, forgot second video link..
www.youtube.com...
edit on 4-4-2013 by ericblair4891 because: (no reason given)
edit on 4-4-2013 by ericblair4891 because: (no reason
given)
Originally posted by ericblair4891
Just me being alarmist I'm sure. But the U.S. eastern quakes seem to be in a line. I don't have google earth on this computer. I'm sure if you draw a line from the West Virginia quake over to Oklahoma, you'll see they're kinda lining up. I'd call the area a bit of a cluster muck right now, being that this activity bucks the long term lull that's been in place. There's been quakes, but not like we've seen over the last few years. Oklahoma and Texas have made it seem like there's been a constant drum beat. Sorry, I didn't even mean to write- I'll dump some links on here that relate to everything and my own cluster muck thinking.
First I want to start with things I didn't know.
I did know some of these following facts, but definitely not all.
www.youtube.com...
Earthquakes can cause avalanches. And if you watch carefully during the rock avalanche, it looks just like fluid. That's my theory. It's all about water. And fluids. Because as we keep learning, even rocks and solid ground can turn into a fluid state.
Here's some stuff I didn't know as well. I think this video was made before Banda Aceh and Japan. Because he doesn't mention them when he describes mega thrusts. I knew about Cascadia. Don't we all????
oops, forgot second video link..
www.youtube.com...
I have have noticed that in the past.
And there does seem to be a little extra action on or near the 37th parallel.
And not just in the U.S.
edit on 4-4-2013 by ericblair4891 because: (no reason given)edit on 4-4-2013 by ericblair4891 because: (no reason given)
edit on 4-4-2013 by radpetey because: (no reason given)
Where ya'all been?, both Puterman and I have been unable to get the ATS site up on any browsers for 2 days
the route stops in Washington
at ae-2-70-edge3.Washington4.Level3.net, TTL Exceeded in Transit
obviously I just got it to work
the route stops in Washington
at ae-2-70-edge3.Washington4.Level3.net, TTL Exceeded in Transit
obviously I just got it to work
edit on 4-4-2013 by muzzy because: (no reason given)
new topics
-
The functionality of boldening and italics is clunky and no post char limit warning?
ATS Freshman's Forum: 48 minutes ago -
Meadows, Giuliani Among 11 Indicted in Arizona in Latest 2020 Election Subversion Case
Mainstream News: 1 hours ago -
Massachusetts Drag Queen Leads Young Kids in Free Palestine Chant
Social Issues and Civil Unrest: 1 hours ago -
Weinstein's conviction overturned
Mainstream News: 2 hours ago -
Supreme Court Oral Arguments 4.25.2024 - Are PRESIDENTS IMMUNE From Later Being Prosecuted.
Above Politics: 4 hours ago -
Krystalnacht on today's most elite Universities?
Social Issues and Civil Unrest: 4 hours ago -
Chris Christie Wishes Death Upon Trump and Ramaswamy
Politicians & People: 5 hours ago -
University of Texas Instantly Shuts Down Anti Israel Protests
Education and Media: 7 hours ago -
Any one suspicious of fever promotions events, major investor Goldman Sachs card only.
The Gray Area: 9 hours ago
top topics
-
Krystalnacht on today's most elite Universities?
Social Issues and Civil Unrest: 4 hours ago, 8 flags -
Weinstein's conviction overturned
Mainstream News: 2 hours ago, 6 flags -
Supreme Court Oral Arguments 4.25.2024 - Are PRESIDENTS IMMUNE From Later Being Prosecuted.
Above Politics: 4 hours ago, 5 flags -
Electrical tricks for saving money
Education and Media: 16 hours ago, 5 flags -
University of Texas Instantly Shuts Down Anti Israel Protests
Education and Media: 7 hours ago, 5 flags -
Meadows, Giuliani Among 11 Indicted in Arizona in Latest 2020 Election Subversion Case
Mainstream News: 1 hours ago, 3 flags -
Chris Christie Wishes Death Upon Trump and Ramaswamy
Politicians & People: 5 hours ago, 2 flags -
Any one suspicious of fever promotions events, major investor Goldman Sachs card only.
The Gray Area: 9 hours ago, 2 flags -
Massachusetts Drag Queen Leads Young Kids in Free Palestine Chant
Social Issues and Civil Unrest: 1 hours ago, 2 flags -
God's Righteousness is Greater than Our Wrath
Religion, Faith, And Theology: 13 hours ago, 1 flags
active topics
-
Massachusetts Drag Queen Leads Young Kids in Free Palestine Chant
Social Issues and Civil Unrest • 8 • : 5thHead -
Chris Christie Wishes Death Upon Trump and Ramaswamy
Politicians & People • 17 • : network dude -
SETI chief says US has no evidence for alien technology. 'And we never have'
Aliens and UFOs • 67 • : YourFaceAgain -
University of Texas Instantly Shuts Down Anti Israel Protests
Education and Media • 164 • : CriticalStinker -
University student disciplined after saying veganism is wrong and gender fluidity is stupid
Education and Media • 49 • : BrotherKinsMan -
God's Righteousness is Greater than Our Wrath
Religion, Faith, And Theology • 27 • : confuzedcitizen -
Candidate TRUMP Now Has Crazy Judge JUAN MERCHAN After Him - The Stormy Daniels Hush-Money Case.
Political Conspiracies • 763 • : matafuchs -
Supreme Court Oral Arguments 4.25.2024 - Are PRESIDENTS IMMUNE From Later Being Prosecuted.
Above Politics • 54 • : network dude -
The functionality of boldening and italics is clunky and no post char limit warning?
ATS Freshman's Forum • 5 • : CarlLaFong -
Weinstein's conviction overturned
Mainstream News • 19 • : Vermilion