It looks like you're using an Ad Blocker.
Please white-list or disable AboveTopSecret.com in your ad-blocking tool.
Thank you.
Some features of ATS will be disabled while you continue to use an ad-blocker.

Quake Watch 2013
page: 64share:
This below is worth a watch!!
earthquake.usgs.gov...
Upgraded now????
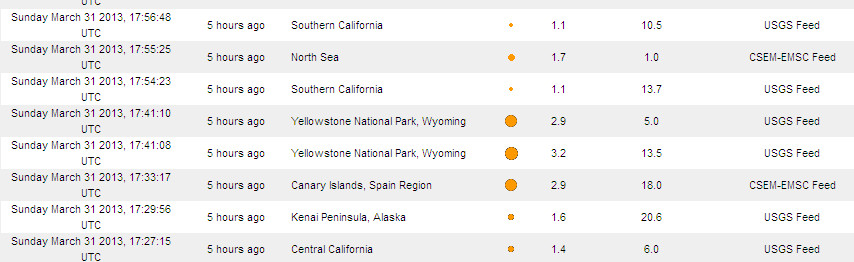
MAP 2.9 2013/03/31 17:41:10 44.800 -111.006 5.0 YELLOWSTONE NATIONAL PARK, WYOMING
MAP 2.7 2013/03/31 14:01:24 38.642 -80.836 9.2 WEST VIRGINIA
earthquake.usgs.gov...
edit on 31-3-2013 by MamaJ because: (no reason given)
Upgraded now????
MAP 3.2 2013/03/31 17:41:08 44.812 -111.010 13.5 YELLOWSTONE NATIONAL PARK, WYOMING
edit on 31-3-2013 by MamaJ because: (no reason
given)
The one in West Virginia is due to possible fracking in the area. UGH!
www.wowktv.com...
Several Braxton County residents called 911 after feeling what they thought was an earthquake. According to the United States Geological Survey, a magnitude 2.7 quake hit 9 miles from Sutton, W.Va. "I was standing in my bedroom close to 10am this morning and the house started shaking and rocking it scared me thought my house was gonna collapse," said Genelda Brown, of Frametown, W.Va. Tracey Taylor, of Gassaway, said: "I was sitting on my bed reading the Sunday newspaper when my whole house shook the bed shook and it scared me and my dog... My neighbors even came out of their houses to see what it was. Some reported a loud boom. I didn't hear a loud boom I just felt the tremor." While at this point there is no certainty about what caused this quake, underground wastewater injection has been previously linked to tremors in Braxton County. In fact, according to a January 2012 article written by Pam Kasey of The State Journal, earthquakes caused by injection have been registered as high as magnitude 5.0.
reply to post by crappiekat
Looks like 2 seconds to me.
Its how long it took for them to change it as i observed it within seconds as well.
Its my understanding though it is one quake. They upgraded it rather quickly.
Below they are still showing one with the upgraded 3.2
earthquake.usgs.gov...
Looks like 2 seconds to me.
Its how long it took for them to change it as i observed it within seconds as well.
Its my understanding though it is one quake. They upgraded it rather quickly.
Below they are still showing one with the upgraded 3.2
earthquake.usgs.gov...
reply to post by MamaJ
Ok, Yes you are correct. Thank you for correcting me.
Just done eating a huge dinner. Must have affected my eyes.
I don't really look at that site much. Except for the little ones that USGS won't list.
Ok, Yes you are correct. Thank you for correcting me.
Just done eating a huge dinner. Must have affected my eyes.
I don't really look at that site much. Except for the little ones that USGS won't list.
reply to post by crappiekat
Oh, no problem. Had I not viewed it, refreshed to make sure my eyes were not fooling me I would have missed it as well and mistaken it for two. Others on here did as well. Thats what we are all here for.... to keep each other up to date on all the happenings. lol
I was surprised to see WV on the map as well.
reply to post by muzzy
Hardly shows at all on the normal SNZO and nor do any of the others: SNZO.IU.00.BHZ.2013.089
You can see some of the others if you look at VHZ but not the Kermedec Islands one: SNZO.IU.00.VHZ.2013.089
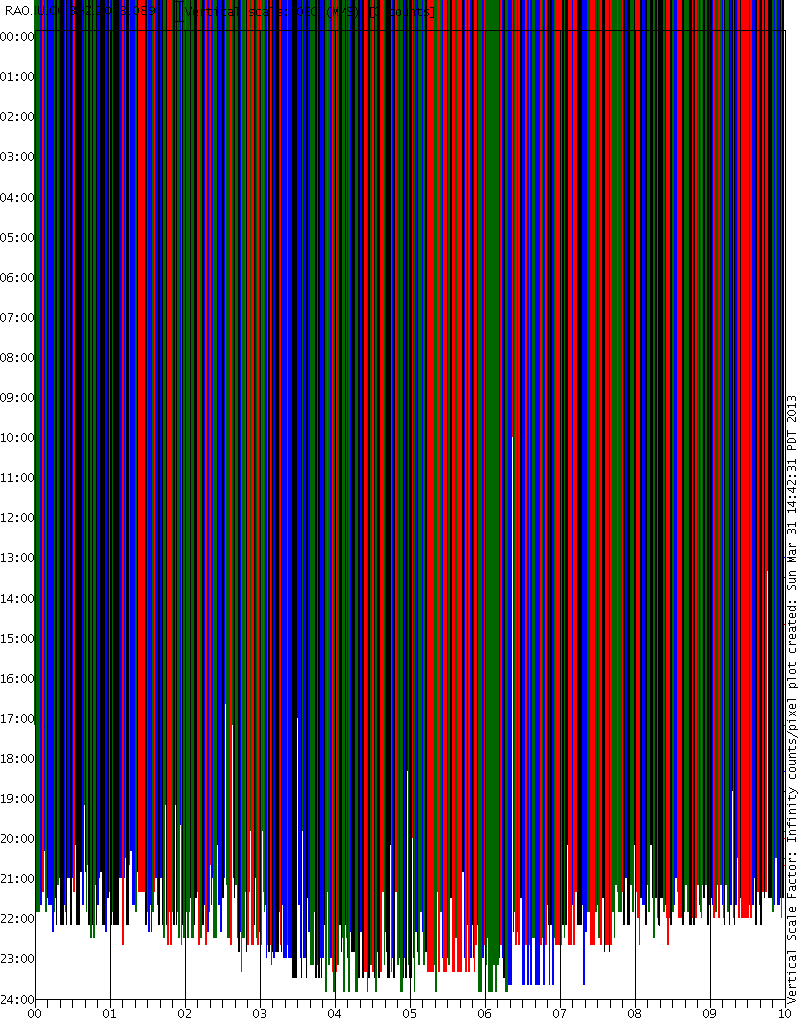
RAO is broken - scale infinity!!!!
Hardly shows at all on the normal SNZO and nor do any of the others: SNZO.IU.00.BHZ.2013.089
You can see some of the others if you look at VHZ but not the Kermedec Islands one: SNZO.IU.00.VHZ.2013.089
RAO is broken - scale infinity!!!!
edit on 31/3/2013 by PuterMan because: Oeps! Forgotted the VHZ link.
reply to post by crappiekat
?? USGS lists down to -1.0 (yes minus 1.0) so which ones is it that they won't list?
You need to change the feed to 7 days all to get those by the way.
Except for the little ones that USGS won't list.
?? USGS lists down to -1.0 (yes minus 1.0) so which ones is it that they won't list?
You need to change the feed to 7 days all to get those by the way.
reply to post by MamaJ
Clearly it is 2 on the global incident site. Another good reason not to use them.
Click for larger image
missed it as well and mistaken it for two
Clearly it is 2 on the global incident site. Another good reason not to use them.
Click for larger image

edit on 31/3/2013 by PuterMan because: (no reason given)
reply to post by PuterMan
www.iris.washington.edu/servlet/quackquery/plotcache/webicorder_fRAO.IU.00.BHZ.2013.089.png
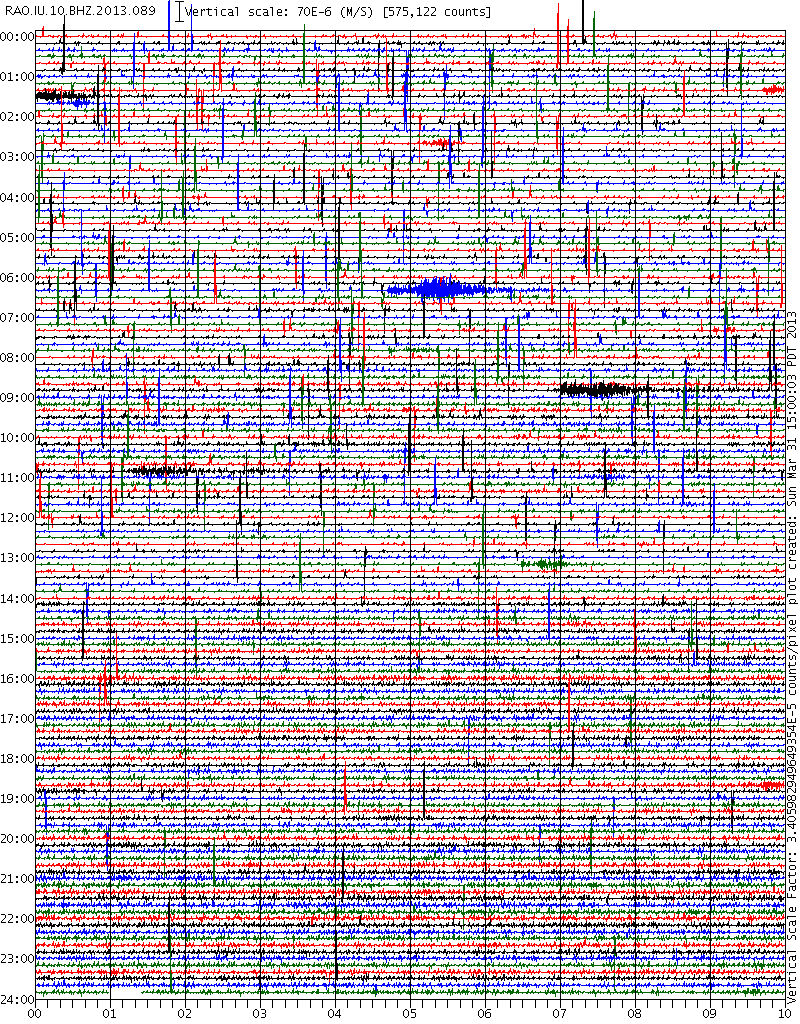
www.iris.washington.edu/servlet/quackquery/plotcache/webicorder_fRAO.IU.10.BHZ.2013.089.png
Location 10 BHZ (40 Hz)
and
Location 00 BHZ (20 Hz)
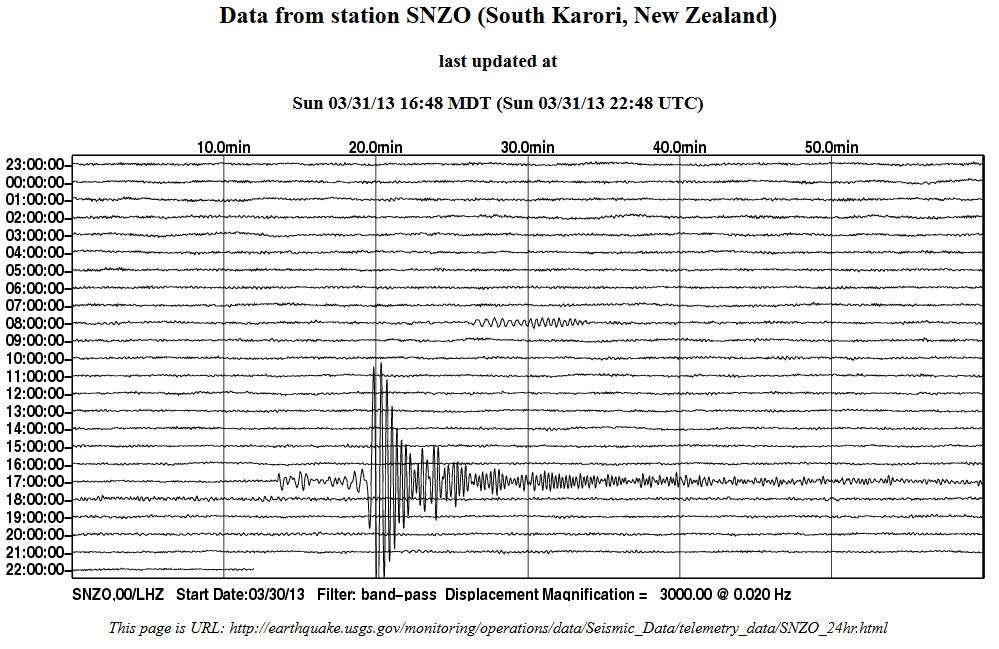
USGS missed a spreading quake
geofon.gfz-potsdam.de/eqinfo/event.php?id=gfz2013ghxr
earthquake.usgs.gov/monitoring/operations/data/Seismic_Data/telemetry_data/SNZO_24hr.html
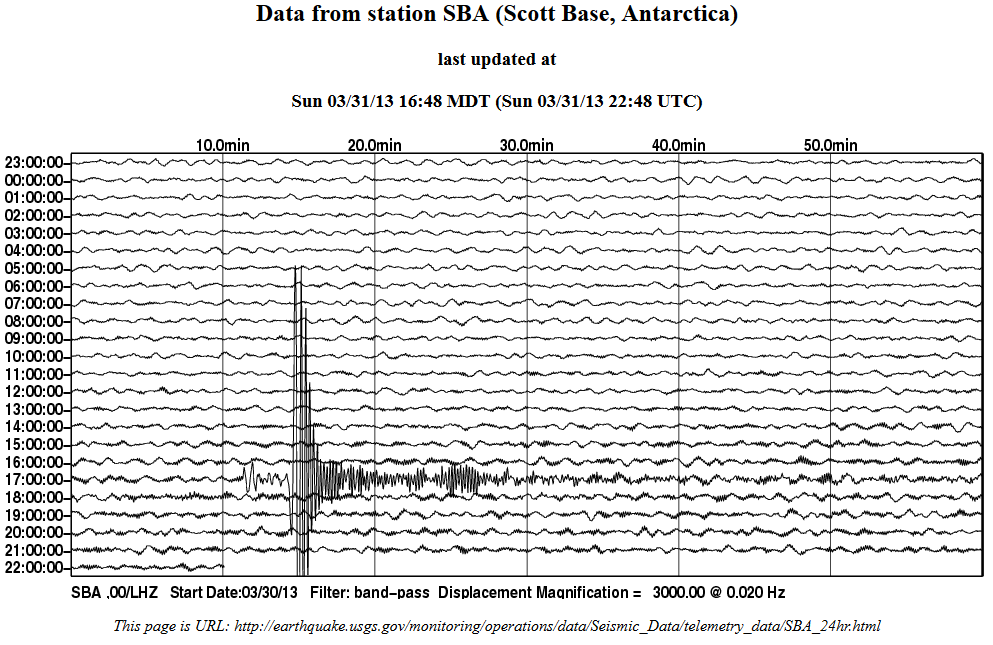
earthquake.usgs.gov/monitoring/operations/data/Seismic_Data/telemetry_data/SBA_24hr.html
www.iris.washington.edu/servlet/quackquery/plotcache/webicorder_fRAO.IU.00.BHZ.2013.089.png
www.iris.washington.edu/servlet/quackquery/plotcache/webicorder_fRAO.IU.10.BHZ.2013.089.png
Location 10 BHZ (40 Hz)
and
Location 00 BHZ (20 Hz)
USGS missed a spreading quake
geofon.gfz-potsdam.de/eqinfo/event.php?id=gfz2013ghxr
F-E Region: Pacific Antarctic Ridge
Time: 2013-03-31 17:08:09.5 UTC
Magnitude: 5.7 (Mw)
Epicenter: 177.76°W 65.71°S
Depth: 10 km
Status: M - manually revised
earthquake.usgs.gov/monitoring/operations/data/Seismic_Data/telemetry_data/SNZO_24hr.html
earthquake.usgs.gov/monitoring/operations/data/Seismic_Data/telemetry_data/SBA_24hr.html
reply to post by PuterMan
Yeah, on that site they still have it as two.
On Earthquake Report they still have it listed as two. In the description though, they just speak of the 3.2.
USGS is still showing one.
www.seis.utah.edu... is showing just one on the map...
So... I am still thinking there was just one??
Yeah, on that site they still have it as two.
On Earthquake Report they still have it listed as two. In the description though, they just speak of the 3.2.
USGS Yellowstone National Park, Wyoming Mar 31 17:41 PM 2.9 5 MAP I Felt It USGS Yellowstone National Park, Wyoming Mar 31 17:41 PM 3.2 13 MAP I Felt It INFO
USGS is still showing one.
www.seis.utah.edu... is showing just one on the map...
So... I am still thinking there was just one??
reply to post by MamaJ
Yes, just one - that is unless you count the small one about 2 minutes afterwards
BTW just for a matter of record (very silly this as I don't predict earthquakes)
I was talking to SWMBO tonight - I find it aids the relationship to speak occasionally - and saying that it is often quiet in Feb/Mar as far a Mag 7s go and then they pick up again in April. She said "OK, well I want a date, and preferably a time."
So here is my prediction - completely baseless - and if this comes about it will be because of magic and other stuff.
VANUATU 21st April
06:30 to 07:00 approx. Mag 7.2 followed ~2 hours later by a 6.1 and ~4 hours after that by another, a Mag 7.1
bet it is wrong!
So... I am still thinking there was just one?
Yes, just one - that is unless you count the small one about 2 minutes afterwards

BTW just for a matter of record (very silly this as I don't predict earthquakes)
I was talking to SWMBO tonight - I find it aids the relationship to speak occasionally - and saying that it is often quiet in Feb/Mar as far a Mag 7s go and then they pick up again in April. She said "OK, well I want a date, and preferably a time."
So here is my prediction - completely baseless - and if this comes about it will be because of magic and other stuff.
VANUATU 21st April
06:30 to 07:00 approx. Mag 7.2 followed ~2 hours later by a 6.1 and ~4 hours after that by another, a Mag 7.1
bet it is wrong!
Originally posted by wujotvowujotvowujotvo
reply to post by PuterMan
Location 10 BHZ (40 Hz)
and
Location 00 BHZ (20 Hz)
Yup infinity scale but thanks for the Location 10 info. That is showing the same spikes as location 00 if you put the scaling factor to 0.001
USGS missed a spreading quake
geofon.gfz-potsdam.de/eqinfo/event.php?id=gfz2013ghxr
F-E Region: Pacific Antarctic Ridge
Time: 2013-03-31 17:08:09.5 UTC
Magnitude: 5.7 (Mw)
Epicenter: 177.76°W 65.71°S
Depth: 10 km
Status: M - manually revised
Maybe they thought it was too small as EMSC have it as 5.0
www.emsc-csem.org...
Forgot to add: note that the EMSC info comes from
GeoForschungsZentrum (GEOFON) -- Potsdam, Germany (GFZ)
Geophysical Survey of the Russian Academy of Sciences -- Obninsk, Russia (GSRC)
Yet GFZ have 5.7
edit on 31/3/2013 by PuterMan because: (no reason given)
Originally posted by wujotvowujotvowujotvo
USGS missed a spreading quake
geofon.gfz-potsdam.de/eqinfo/event.php?id=gfz2013ghxr
F-E Region: Pacific Antarctic Ridge
Time: 2013-03-31 17:08:09.5 UTC
Magnitude: 5.7 (Mw)
Epicenter: 177.76°W 65.71°S
Depth: 10 km
Status: M - manually revised
earthquake.usgs.gov/monitoring/operations/data/Seismic_Data/telemetry_data/SNZO_24hr.html
earthquake.usgs.gov/monitoring/operations/data/Seismic_Data/telemetry_data/SBA_24hr.html
and
Originally posted by PuterMan
Maybe they thought it was too small as EMSC have it as 5.0
www.emsc-csem.org...
Forgot to add: note that the EMSC info comes from
GeoForschungsZentrum (GEOFON) -- Potsdam, Germany (GFZ)
Geophysical Survey of the Russian Academy of Sciences -- Obninsk, Russia (GSRC)
Yet GFZ have 5.7
edit on 31/3/2013 by PuterMan because: (no reason given)
yeah how do they get it so wrong?
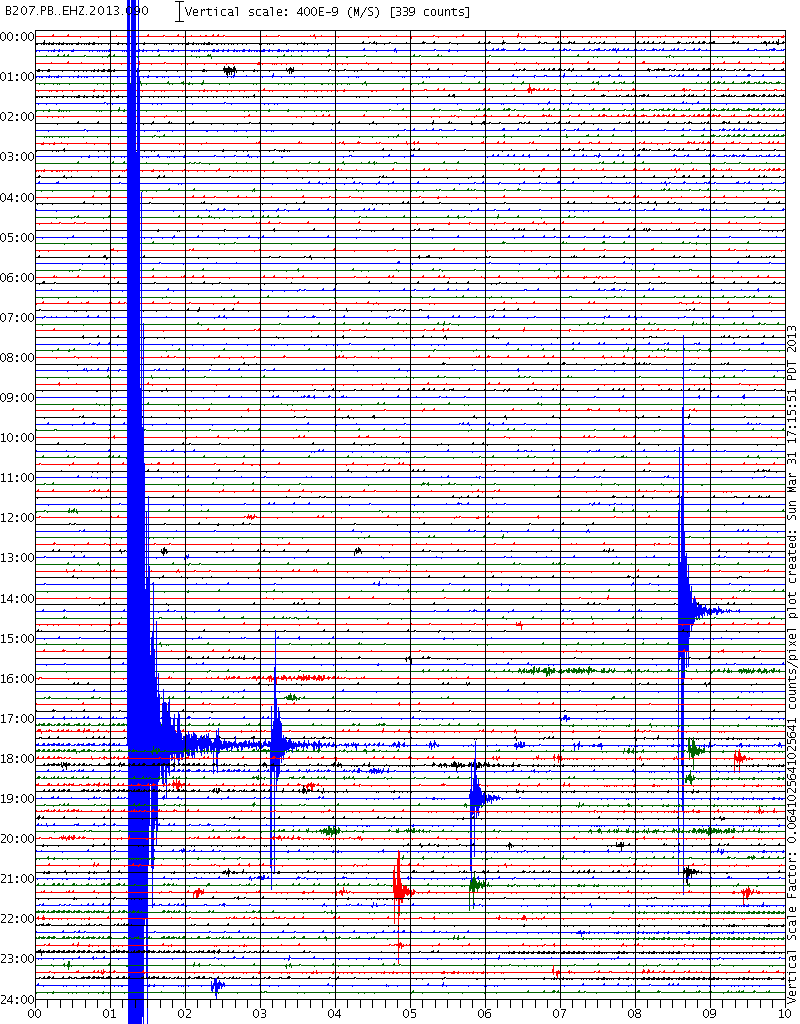
RAS have 4.8mb page here
all you need to do is look at the LISS graph eh.
LDEO showing;
2013 3 31 17 8 8.0 -65.75 -177.25 33.0 5.6Ms PACIFIC-ANTARCTIC RIDGE
I know those LISS graphs mostly show S waves or LR waves, but even so, 4.8mb = 5.7Mw? huh?
May have to rethink the conversion formula, thats as bad as the Burma 4.8-5.8 the other day I mentioned.
bottom line ........... a "light-moderate-strong" quake on the Pacific Antarctic Ridge. Depends where you draw the line that separates the light/moderate/strong categories.
heres a few LISS SNZO graphs showing Pac Ant Ridge quakes for comparison
28/12/2011 mag 4.7 and 29/12/2011 5.5 (not much between the two on there, but way smaller than yesterdays)
28/03/2012 mag 5.5 (looks smaller than yesterdays 4.8-5.7)
25/03/2012 amg 5.7 (about the same as yesterdays)
04/08/2012 mag 4.9 ( tiny, even for an LDEO reading)
of course the Pac Ant Ridge is thousands of km long, and the distance of an event from NZ would make a big difference.
There are probably a few other PacAnt traces on those graph at SNZO Archives but I only put the text below each graph for the ones over 5.6 or ones that stand out, you would have to click each one to see.
I started putting the time of the event on the side as well as the magnitude, maybe I need to put the distance from SNZO as well.
edit on 31-3-2013 by muzzy because: (no reason given)
reply to post by muzzy
That would be useful if you have the time as it can make a big difference to the trace.
I want to try and work out how to apply the filter they use to a dataset in Audacity as they get much bigger traces than appear on the normal IRIS seismograms. Band pass I understand, but it does not say what the band is, displacement magnification 3000 is OK but 0.02 Hz? Are they saying they filter on 0.02 Hz? I don't think Audacity can filter any less than 1 Hz. Need some of that special stuff TA gets to play with - grr
Edit to add: Thought not......
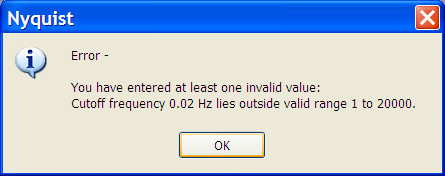
Alternatively I am going to have to build my own band pass filter if I can get my head round how they work (not the description - the mathematics)
maybe I need to put the distance from SNZO as well.
That would be useful if you have the time as it can make a big difference to the trace.
I want to try and work out how to apply the filter they use to a dataset in Audacity as they get much bigger traces than appear on the normal IRIS seismograms. Band pass I understand, but it does not say what the band is, displacement magnification 3000 is OK but 0.02 Hz? Are they saying they filter on 0.02 Hz? I don't think Audacity can filter any less than 1 Hz. Need some of that special stuff TA gets to play with - grr
Edit to add: Thought not......
Alternatively I am going to have to build my own band pass filter if I can get my head round how they work (not the description - the mathematics)
edit on 1/4/2013 by PuterMan because: (no reason given)
reply to post by PuterMan
I'll do it from now on.
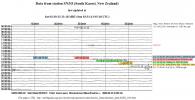
Did 3 days worth yesterday, I wait till I have 3 so that I can load a whole line at once in the table html otherwise it gets messy.
Takes a bit of time to go through the lists and match the traces sometimes, especially the smaller traces.
here is an example
for those who are not sure what the LISS graphs mean;
the majority of the traces appear on LISS graphs as Love-Rayleigh waves which are both surface waves and that is probably why LDEO manage to get more results as their results are in Ms.
LR arrival time is almost always shown in the arrival times results on the Travel Time Calculator, the exception when analyzing LISS SNZO being Kermadec Islands quakes which usually show on the graph as PcP waves, I have no idea what PcP stands for, but it seems from this graph they are a branch of the S wave as well.
I had no idea about all this when I started looking at the graphs, it was someone here on ATS QW that gave me the heads up about LR waves.
What I need is a formula to convert ML, mb or Mw (what the majority of networks post up) to Ms ( or vs-versa) , then I can tell who is the most accurate by looking at the LISS graphs myself. USGS and RAS only seem to put Ms in their phase data if the quakes is above mag 6, so its really only GCMT, LDEO and the Chinese who supply this information.
If there isn't a formula I'll have to figure one out by going through the lists. My experience over the years is that the conversions vary from region to region anyway regardless of what type they may be.
Readers may note that I rarely use USGS for the description on the side any more, although they are good at giving the lat/long co-ordinates and eq time to 3 decimal places, they always seem to have the lowest magnitude of all the networks, and often miss some pretty big quakes down here in the Southern Ocean.
That is why I need the formula to convert to Ms, otherwise their data is useless for this project.
I'll do it from now on.
Did 3 days worth yesterday, I wait till I have 3 so that I can load a whole line at once in the table html otherwise it gets messy.
Takes a bit of time to go through the lists and match the traces sometimes, especially the smaller traces.
here is an example
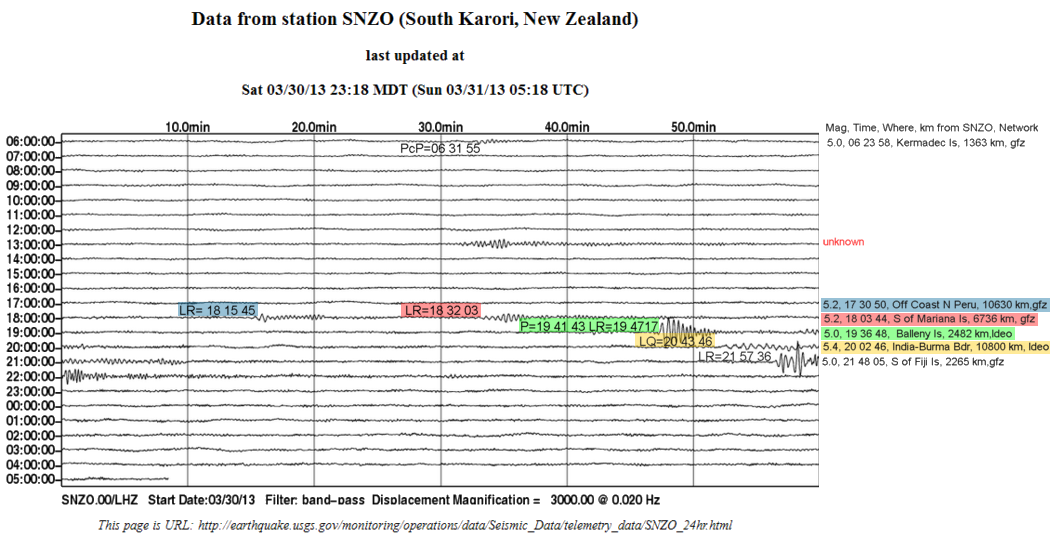
for those who are not sure what the LISS graphs mean;
the majority of the traces appear on LISS graphs as Love-Rayleigh waves which are both surface waves and that is probably why LDEO manage to get more results as their results are in Ms.
LR arrival time is almost always shown in the arrival times results on the Travel Time Calculator, the exception when analyzing LISS SNZO being Kermadec Islands quakes which usually show on the graph as PcP waves, I have no idea what PcP stands for, but it seems from this graph they are a branch of the S wave as well.
I had no idea about all this when I started looking at the graphs, it was someone here on ATS QW that gave me the heads up about LR waves.
What I need is a formula to convert ML, mb or Mw (what the majority of networks post up) to Ms ( or vs-versa) , then I can tell who is the most accurate by looking at the LISS graphs myself. USGS and RAS only seem to put Ms in their phase data if the quakes is above mag 6, so its really only GCMT, LDEO and the Chinese who supply this information.
If there isn't a formula I'll have to figure one out by going through the lists. My experience over the years is that the conversions vary from region to region anyway regardless of what type they may be.
edit on 1-4-2013 by muzzy because: (no reason given)
Readers may note that I rarely use USGS for the description on the side any more, although they are good at giving the lat/long co-ordinates and eq time to 3 decimal places, they always seem to have the lowest magnitude of all the networks, and often miss some pretty big quakes down here in the Southern Ocean.
That is why I need the formula to convert to Ms, otherwise their data is useless for this project.
edit on 1-4-2013 by muzzy because: (no
reason given)
5's and 6's off Honshu Japan.
6.1 and 5.9, 18:53:18 UTC
6.1 and 5.9, 18:53:18 UTC
edit on 1-4-2013 by Eedjee because: #
reply to post by Eedjee
both Auto status and likely mb values, so may change
your USGS ones are 6.0Mw and 5.1mb respectively
the 6.0 was mb = 5.6 (384 stations) according to the phase data
see the problem!
thats like 6.0 apples and 5.1 bananas, not comparable
but if you compare them as mb values, then we have 5.6 bananas from Germany and 5.5 bananas from the USA and the monkey is happy
why do the even bother putting up the Mw? it just makes things seem worse than it actually is
FWIW JMA have 6.1ML
www.jma.go.jp...
and China gave it a 6.2Ms
data.earthquake.cn...
and the Russians ms= 6.1/24stat mb= 6.0/21stat
www.ceme.gsras.ru...
looks like a high 5 on LISS SNZO, not a 6
earthquake.usgs.gov...
2013-04-01 20:04:33 5.3 39.61°N 142.94°E 10 A Near East Coast of Honshu, Japan
2013-04-01 18:53:18 5.8 39.57°N 143.05°E 10 A Off East Coast of Honshu, Japan
geofon.gfz-potsdam.de...
both Auto status and likely mb values, so may change
your USGS ones are 6.0Mw and 5.1mb respectively
the 6.0 was mb = 5.6 (384 stations) according to the phase data
see the problem!
thats like 6.0 apples and 5.1 bananas, not comparable
but if you compare them as mb values, then we have 5.6 bananas from Germany and 5.5 bananas from the USA and the monkey is happy
why do the even bother putting up the Mw? it just makes things seem worse than it actually is
FWIW JMA have 6.1ML
www.jma.go.jp...
and China gave it a 6.2Ms
data.earthquake.cn...
and the Russians ms= 6.1/24stat mb= 6.0/21stat
www.ceme.gsras.ru...
looks like a high 5 on LISS SNZO, not a 6
earthquake.usgs.gov...
edit on 1-4-2013 by muzzy because: (no reason
given)
further to post by muzzy
another option would be to just use ANSS for this, I have found that when I'm back doing older graphs that I saved at the time but didn't ID the traces ANSS seems to have most of them there, eg just did the graph for 23-24/08/2012 and there was a trace that turned out to be a 4.4 that GFZ didn't have listed, but it was shown on ANSS results. Had looked like a Kermadec 5.0 to me, but hey 4.4mb is better than putting in "unknown"
That would work, but again even ANSS have both Mw and mb mixed together.
new topics
-
Late Night with the Devil - a really good unusual modern horror film.
Movies: 53 minutes ago -
Cats Used as Live Bait to Train Ferocious Pitbulls in Illegal NYC Dogfighting
Social Issues and Civil Unrest: 2 hours ago -
The Good News According to Jesus - Episode 1
Religion, Faith, And Theology: 4 hours ago -
HORRIBLE !! Russian Soldier Drinking Own Urine To Survive In Battle
World War Three: 6 hours ago -
Bobiverse
Fantasy & Science Fiction: 9 hours ago -
Florida man's trip overseas ends in shock over $143,000 T-Mobile phone bill
Social Issues and Civil Unrest: 9 hours ago -
Former Labour minister Frank Field dies aged 81
People: 11 hours ago
top topics
-
Florida man's trip overseas ends in shock over $143,000 T-Mobile phone bill
Social Issues and Civil Unrest: 9 hours ago, 8 flags -
SETI chief says US has no evidence for alien technology. 'And we never have'
Aliens and UFOs: 13 hours ago, 7 flags -
Cats Used as Live Bait to Train Ferocious Pitbulls in Illegal NYC Dogfighting
Social Issues and Civil Unrest: 2 hours ago, 6 flags -
This is our Story
General Entertainment: 15 hours ago, 4 flags -
Former Labour minister Frank Field dies aged 81
People: 11 hours ago, 4 flags -
Bobiverse
Fantasy & Science Fiction: 9 hours ago, 3 flags -
HORRIBLE !! Russian Soldier Drinking Own Urine To Survive In Battle
World War Three: 6 hours ago, 2 flags -
Late Night with the Devil - a really good unusual modern horror film.
Movies: 53 minutes ago, 2 flags -
The Good News According to Jesus - Episode 1
Religion, Faith, And Theology: 4 hours ago, 0 flags
active topics
-
HORRIBLE !! Russian Soldier Drinking Own Urine To Survive In Battle
World War Three • 22 • : RickyD -
British TV Presenter Refuses To Use Guest's Preferred Pronouns
Education and Media • 139 • : Annee -
President BIDEN Vows to Make Americans Pay More Federal Taxes in 2025 - Political Suicide.
2024 Elections • 92 • : SchrodingersRat -
Florida man's trip overseas ends in shock over $143,000 T-Mobile phone bill
Social Issues and Civil Unrest • 15 • : mysterioustranger -
SETI chief says US has no evidence for alien technology. 'And we never have'
Aliens and UFOs • 35 • : Consvoli -
Late Night with the Devil - a really good unusual modern horror film.
Movies • 1 • : DAVID64 -
Cats Used as Live Bait to Train Ferocious Pitbulls in Illegal NYC Dogfighting
Social Issues and Civil Unrest • 6 • : ColeYounger2 -
Ditching physical money
History • 18 • : annonentity -
Lawsuit Seeks to ‘Ban the Jab’ in Florida
Diseases and Pandemics • 32 • : SchrodingersRat -
"We're All Hamas" Heard at Columbia University Protests
Social Issues and Civil Unrest • 279 • : KrustyKrab