It looks like you're using an Ad Blocker.
Please white-list or disable AboveTopSecret.com in your ad-blocking tool.
Thank you.
Some features of ATS will be disabled while you continue to use an ad-blocker.

Quake Watch 2013
page: 21share:
Another earthquake in Eastern Texas at 6:30 am Tuesday, Jan. 29. Was a 2.8, not too far from Timpson again. Have been up all nite and pooped so if
this has already been posted...sorry. Am awaiting the bad storm predicted for this area. Thanx.
Originally posted by MamaJ
reply to post by PuterMan
Also, they seem to postulate that with the uptick in volcanic activity will bring about an uptick in earthquakes.
The only problem is that there is no uptick in volcanoes erupting. As you can see from my geophysical report the rate is fairly steady at 6 over and above the 17 always erupting, and as far as I can tell the numbers erupting in any given year have not shown a marked increase. There is also no uptick in earthquakes (ok in large earthquakes if you wish) which would seem to match what they are saying but not the direction they are saying.
edit on 29/1/2013 by PuterMan because: (no reason given)
reply to post by happykat39
And now for your delectation and enjoyment the Nevada figures bunched up into months and tied up with blue and red ribbons.
First a brief explanation. As with the daily chart counts and energy are aggregated, this time monthly. On the chart where energy is high and counts low the red bar will be taller. Where counts are higher and energy lower the inner blue bar will be higher.
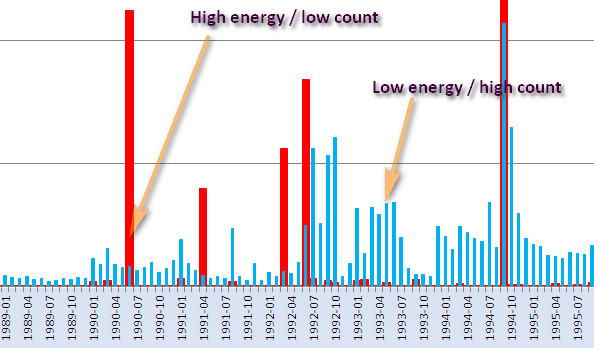
And so to the chart. It is very big and very long so that you can see all the little marks on it
You definitely need to click on the image to expand it.
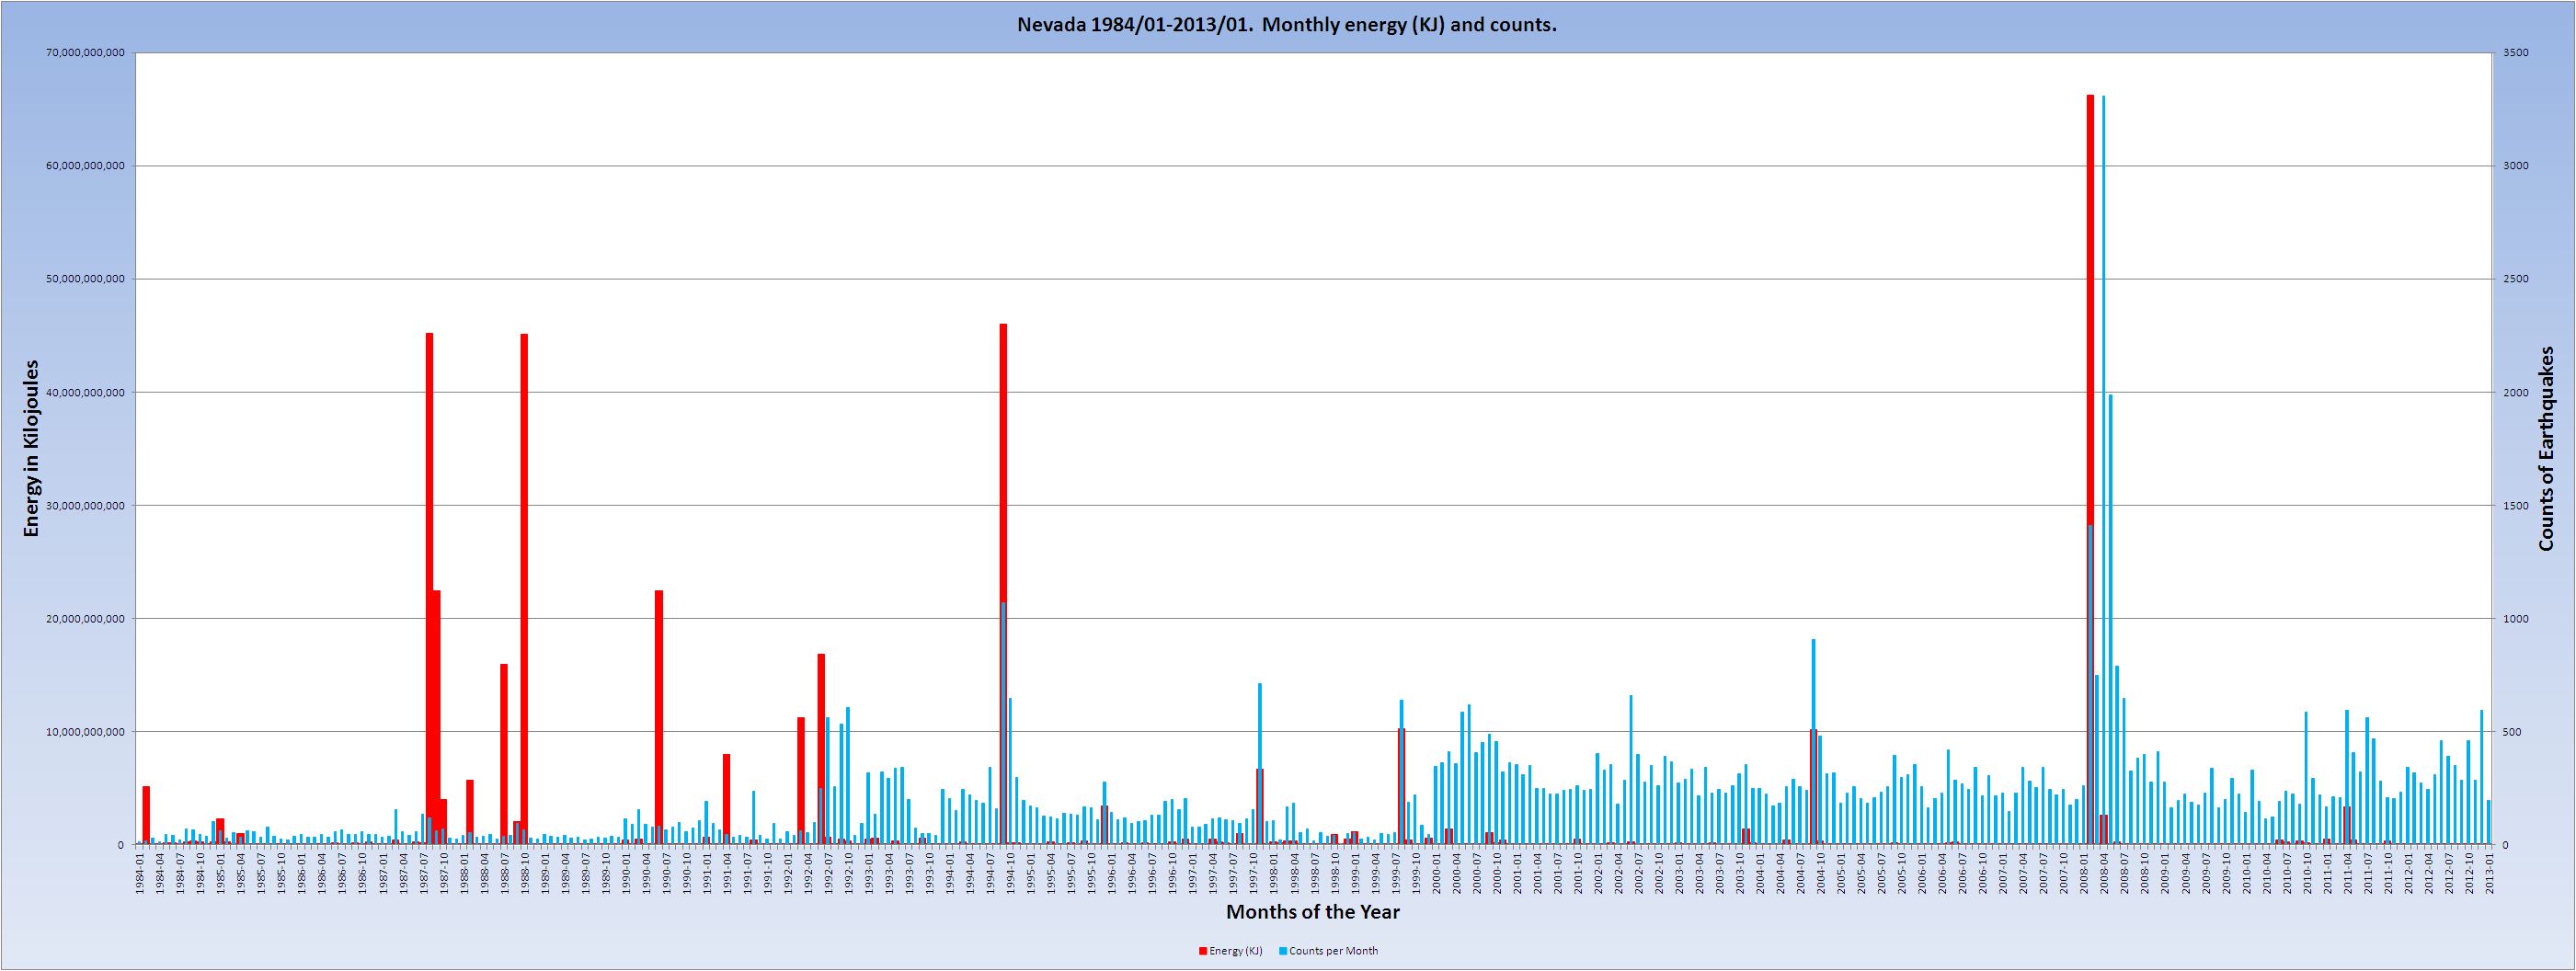
Points of interest. The latter years counts are higher but energy total is lower. Counts appear to be increasing but it seems stepped thus I am thinking that around 1980 and 1990 more instruments were added to the system giving a wider coverage for smaller quakes.
Zipped data file (5 kb)
And now for your delectation and enjoyment the Nevada figures bunched up into months and tied up with blue and red ribbons.
First a brief explanation. As with the daily chart counts and energy are aggregated, this time monthly. On the chart where energy is high and counts low the red bar will be taller. Where counts are higher and energy lower the inner blue bar will be higher.
And so to the chart. It is very big and very long so that you can see all the little marks on it
You definitely need to click on the image to expand it.

Points of interest. The latter years counts are higher but energy total is lower. Counts appear to be increasing but it seems stepped thus I am thinking that around 1980 and 1990 more instruments were added to the system giving a wider coverage for smaller quakes.
Zipped data file (5 kb)
When discussing precursors of any kind, this is a little known evidence.
Fulltext - 218 KB
jjjtir.files.wordpress.com/2013/01/203508b0.pdf
www.nature.com/nature/journal/v203/n4944/abs/203508b0.html
Fulltext - 218 KB
jjjtir.files.wordpress.com/2013/01/203508b0.pdf
www.nature.com/nature/journal/v203/n4944/abs/203508b0.html
Letters to Nature
Nature 203, 508 - 509 (01 August 1964); doi:10.1038/203508b0
Magnetic Disturbances preceding the 1964 Alaska Earthquake
GEORGE W. MOORE
U.S. Geological Survey, Menlo Park, California.
THROUGH a fortunate circumstance, a recording magnetometer was operating in the city of Kodiak, 30 km north-west of the surface trace of a fault zone along which movement occurred at the time when the earthquake occurred in Alaska on March 27, 1964. Fortunately, too, the instrument was on such high ground that it was not reached by the subsequent seismic sea wave which virtually destroyed the city. The magnetometer recorded the fact that the largest of several magnetic disturbances briefly increased the intensity of the Earth's magnetic field by 100γ at Kodiak, 1 h 6 min before the earthquake (Fig. 1).
Alexander, H. , Kodiak Electric Assoc. (personal communication, 1964).
Ashby, W. O. , Fairchild Aerial Surveys (personal communication, 1964).
Stacey, F. D. , Nature, 200, 1083 (1963). | ISI |
Breiner, S. , Nature, 202, 790 (1964). | Article | ISI |
See also Grantz, A. , Plafker, G. , and Kachadoorian, R. , Alaska's Good Friday Earthquake, March 27, 1964; a Preliminary Geologic Evaluation (U.S. Geol. Survey, Circ. 491, Washington, 1964).
edit on 29-1-2013 by wujotvowujotvowujotvo because: (no reason given)
reply to post by wujotvowujotvowujotvo
Very interesting indeed. A link to the PDF would be very useful if you have it.
Very interesting indeed. A link to the PDF would be very useful if you have it.
reply to post by PuterMan
Here is a link to the animated Nevada quakes - fast version - where I have split the data into 5 year blocks and plotted the quakes on a scatter chart.
Warning this is a 6+Mb file so dial-up users may prefer to skip this. I shall produce some screen versions shortly.
Animated scatter chart - Fast
ETA: And a slower version - also 6+Mb
Animated scatter chart - Slow
edit on 29/1/2013 by PuterMan because: To add another image link.
reply to post by PuterMan
Edited in the post, still had 30 minutes left.
_______
20:21 28 January
Panel says fault under Tsuruga plant likely active: draft report
TOKYO, Jan. 28, Kyodo
english.kyodonews.jp/news/2013/01/206428.html
19:41 29 January
New safety standards to clearly ban reactors above active faults
TOKYO, Jan. 29, Kyodo
english.kyodonews.jp/news/2013/01/206621.html
20:49 29 January
Idemitsu Kosan to form joint venture for Canadian LNG project
TOKYO, Jan. 29, Kyodo
english.kyodonews.jp/news/2013/01/206631.html
Edited in the post, still had 30 minutes left.
_______
20:21 28 January
Panel says fault under Tsuruga plant likely active: draft report
TOKYO, Jan. 28, Kyodo
english.kyodonews.jp/news/2013/01/206428.html
A panel of experts under Japan's nuclear regulatory authority reaffirmed Monday that a geologic fault running directly underneath a reactor in western Japan is likely to be active.
The fault, known as D-1 and existing below the No. 2 reactor of Japan Atomic Power Co.'s Tsuruga plant in Fukui Prefecture, is feared to possibly affect key facilities located above, the experts say in a draft report summarizing their discussions.
The report is to be submitted to the Nuclear Regulation Authority after the contents are finalized so the NRA can decide its stance on the plant's resumption.
It is unclear, though, when the report will be submitted to a meeting of five NRA members, because Kunihiko Shimazaki, the panel head and an NRA member, says he wants other outside experts to check the report "to improve" the contents.
An official of the NRA secretariat told reporters later that details of the so-called "peer review" have yet to be decided and the timing of when the report will be finalized may depend on how the process will be implemented.
"We're not expecting to spend much time, but I can't tell at this moment by when (the review will finish)," the official said.
A conclusion that the plant's No. 2 reactor is sitting above an active fault may force Japan Atomic Power to scrap the unit.
The plant operator acknowledged in 2008 that a major active fault called Urazoko is located only about 250 meters from both the No. 1 and No. 2 reactor buildings, but it has denied that the two reactors sit above faults that could move in the future.
The report, however, said the D-1 fault could move in conjunction with the Urazoko fault.
As for the activity of other faults that run beneath the plant's No. 1 reactor, the draft report says the outcome of the investigation conducted by Japan Atomic Power should be waited for before assessments are made.
Most of Japan's reactors are currently offline, including Japan Atomic Power's reactors, amid safety concerns over the use of nuclear power in the wake of the 2011 Fukushima Daiichi complex disaster.
Plant operators in quake-prone Japan are not allowed to build reactors or related facilities important for safe reactor operation directly above active faults.
Copyright 2013 Kyodo News
19:41 29 January
New safety standards to clearly ban reactors above active faults
TOKYO, Jan. 29, Kyodo
english.kyodonews.jp/news/2013/01/206621.html
Japan's Nuclear Regulation Authority decided Tuesday to stipulate more clearly as a safety requirement that reactors must not be built directly above geologic faults that could move in the future.
The current guidelines, crafted before the 2011 Fukushima Daiichi complex disaster, employ indirect wording to rule out the placing of important facilities above active faults, saying regulators do "not expect" such a situation.
The NRA is in the process of compiling new safety standards, set to come into force in July, which will replace the current guidelines that proved insufficient in the wake of the Fukushima disaster, triggered by the March 2011 earthquake and tsunami in northeastern Japan.
The new regulatory requirements are drawing attention because they could affect the reactivation of the country's reactors. Only two reactors in Japan are currently operating amid safety concerns over the use of nuclear power.
On Tuesday, a panel of experts appointed by the NRA drew up the outline of the safety measures to address the risk posed by earthquakes and tsunami. A separate panel is crafting measures to address severe accidents.
As for the location of important facilities, utilities should not only take heed of active faults but faults that could cause deformation of the ground surface as well as earthquake-triggered landslide displacement.
The new safety standards will also call on utilities to assess the activity of faults under a plant's premises as far back as around 400,000 years ago if they cannot rule out that the faults have moved in the last 120,000-130,000 years -- the current benchmark for deciding whether faults are active.
To address the risk of tsunami, utilities will be asked to come up with estimates of the largest tsunami that could hit nuclear plants, reflecting the latest scientific knowledge, and to ensure important facilities are designed to withstand them, according to the outline of the new safety standards.
Copyright 2013 Kyodo News
20:49 29 January
Idemitsu Kosan to form joint venture for Canadian LNG project
TOKYO, Jan. 29, Kyodo
english.kyodonews.jp/news/2013/01/206631.html
Idemitsu Kosan Co. and AltaGas Ltd. of Canada said Tuesday they will form a joint venture to develop liquefied natural gas in Canada for export to Japan and other Asian countries.
AltaGas Idemitsu Joint Venture Limited Partnership will be established in February with plans to build facilities to liquefy natural gas on the Pacific coast of Canada.
The two companies are aiming to produce 2 million tons of LNG per year and begin exports of LNG as early as 2017.
It is the first time for Idemitsu Kosan to embark on an LNG project.
LNG demand has surged in Japan since the March 2011 earthquake and tsunami in the northeast that triggered a nuclear crisis at the Fukushima Daiichi power plant.
Copyright 2013 Kyodo News
edit on 29-1-2013 by wujotvowujotvowujotvo because: (no reason given)
reply to post by PuterMan
That should have been 1990 and 2000 but the 2hour 4 hour editing period has passed so I can't change it.
from 1990 to 1999 ~37 stations were added. From 2000 to 2012 ~119 stations were added but ~77 were taken off but operated for mainly 2 years and 1 month between 2006 and 2008 but some were longer. That is just from what I can find on the publicly available networks so I have absolutely no doubt that there have been many more.
@wujotvowujotvowujotvo:
thus I am thinking that around 1980 and 1990 more instruments were added to the system giving a wider coverage for smaller quakes.
That should have been 1990 and 2000 but the 2hour 4 hour editing period has passed so I can't change it.
from 1990 to 1999 ~37 stations were added. From 2000 to 2012 ~119 stations were added but ~77 were taken off but operated for mainly 2 years and 1 month between 2006 and 2008 but some were longer. That is just from what I can find on the publicly available networks so I have absolutely no doubt that there have been many more.
@wujotvowujotvowujotvo:
edit on 29/1/2013 by PuterMan because: (no reason given)
LDEO Ms plots for last 9 days
[color=lime](click image for interactive map, opens in new tab/window)
note Magnitude: 4.7 Ms for LOUISIANA-TEXAS BORDER REGION 25/01/2013 07:01:28
My LDEO maps

[color=lime](click image for interactive map, opens in new tab/window)
note Magnitude: 4.7 Ms for LOUISIANA-TEXAS BORDER REGION 25/01/2013 07:01:28
My LDEO maps
edit on 29-1-2013 by muzzy because: spacing
reply to post by PuterMan
Well done
I'd like to know how you did that,
did you plot those on Excel?
This one looks interesting
Well done
I'd like to know how you did that,
did you plot those on Excel?
This one looks interesting
edit on 29-1-2013 by muzzy because: (no reason given)
reply to post by muzzy
Hi Muzzy. Thanks. Yes they are just a scatter chart in Excel.
I have not compared it to a map but I believe the 'blob' that appears in 2003-2008 and has some minor activity thereafter, is the Wells sequence
Not quite sure where the other 2008 sequence is in relation but I think it may be hidden in the other events.
A composite of all the 5 year periods. (Click for the bigger picture)
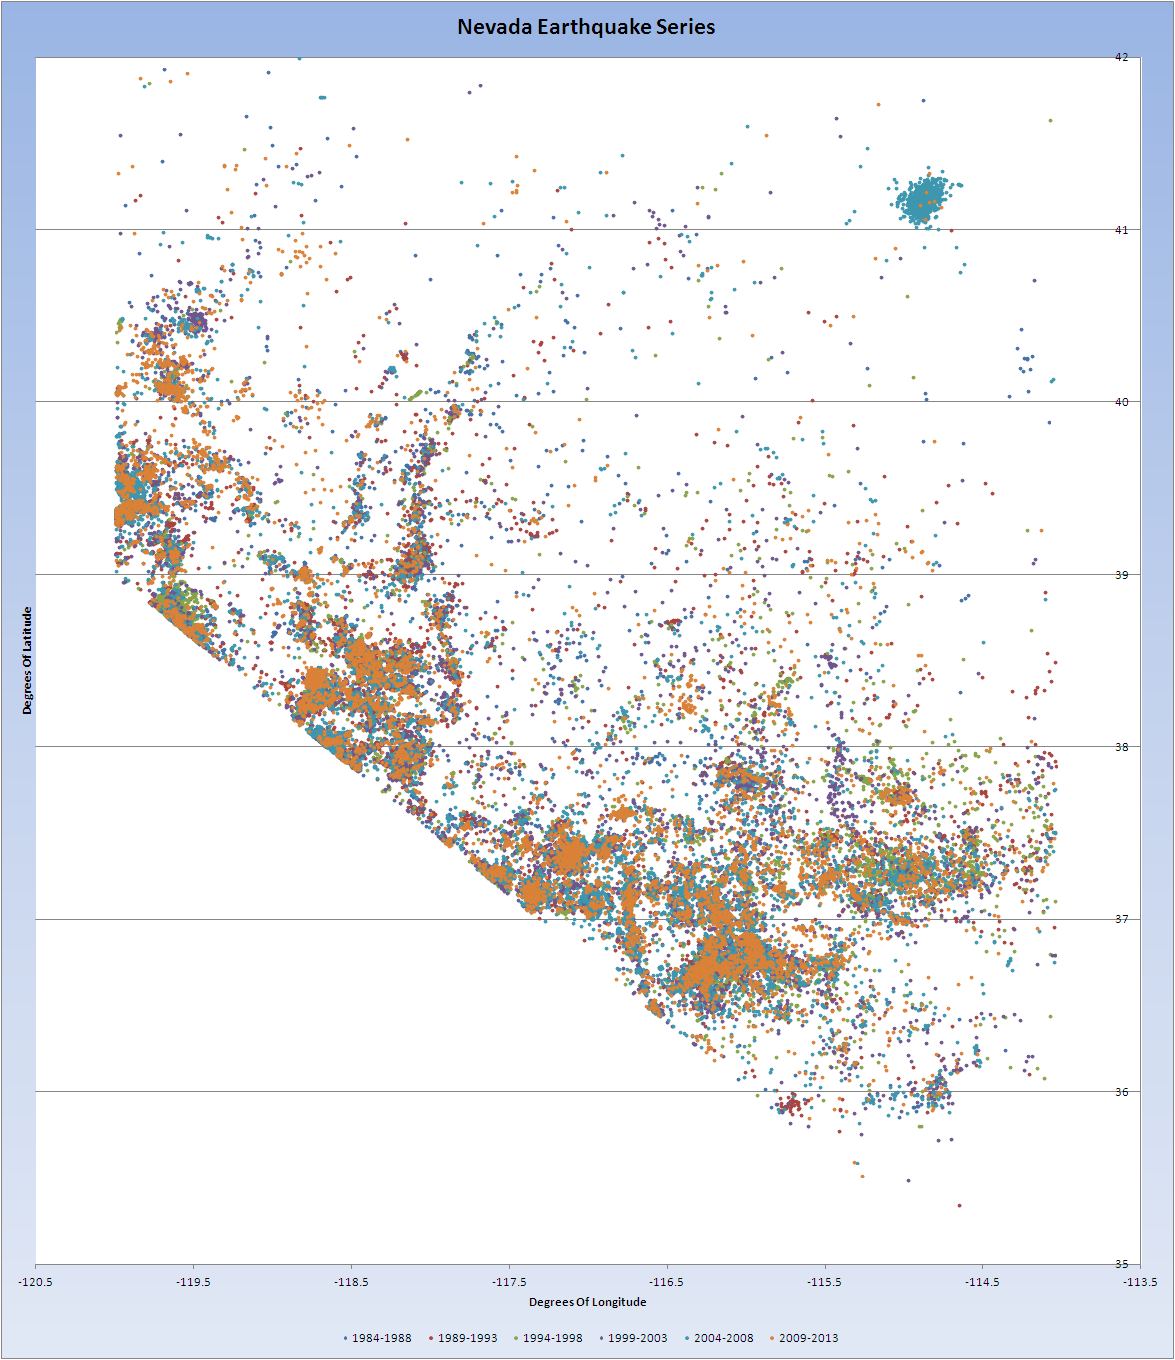
PS. Apologies for the incorrect naming on the animation where it says decade. It started off as decades but Excel could not handle that much data in one series so I cut it to 5 years and forgot to change the names.
edit on 29/1/2013 by PuterMan because: (no reason given)
further update to post by PuterMan the animation wizard
OK, for those of you with a good broadband only - seriously this animation is 70.6 megabytes - here is a coloured version in 5 year slices with fade.
A very large file but so pretty.
ETA: By the way, be patient. It can take some time to download and assemble before it starts working properly.
OK, for those of you with a good broadband only - seriously this animation is 70.6 megabytes - here is a coloured version in 5 year slices with fade.
A very large file but so pretty.
ETA: By the way, be patient. It can take some time to download and assemble before it starts working properly.
edit on 29/1/2013 by PuterMan because: (no reason given)
Originally posted by PuterMan
update to post by PuterMan
No change to the mining blasts list as yet. Has not been updated.
That earthquake has not appeared in the lists either. I will give them 48 hours and then will start asking questions if nothing has appear in either place.
Hi PM, it is interesting that it has not appeared in the mining blasts list. I'm about 126 miles from Gillette, the mines in the area are all part of what we call 'Thunder Basin' and yep, they do like to make things go BANG!
Any quakes in that area are almost certainly from blasting, although an actual quake in the area would not be unheard of.
I pulled-up some quick historical data and over the last 36 years I am only seeing 2 - 4+ ones in the area.
The last time that an abnormally large blast was mistakenly triggered in May of 2012, it generated a 4.3 quake. They got in a bit 'o trouble over that one, they did...
Mine faces State, Federal fines for massive blast
edit on 29-1-2013 by sageturkey because: (no reason given)
reply to post by sageturkey
Very interesting, and thanks. It appears that this might be carbon copy of the May incident.
Maybe that is why there is a delay in posting anything.
Mm. The mining list has been updated and the blast is not on it. It has also not turned up on the quake lists. Butt kicking time I think.
Very interesting, and thanks. It appears that this might be carbon copy of the May incident.
Maybe that is why there is a delay in posting anything.
Mm. The mining list has been updated and the blast is not on it. It has also not turned up on the quake lists. Butt kicking time I think.
edit
on 29/1/2013 by PuterMan because: (no reason given)
reply to post by PuterMan
My first thought as well, maybe politics holding up the reporting. I've been looking for any local news on the matter and haven't found any yet.
Maybe if they knew that you were on the trail they'd be more forthcoming
My first thought as well, maybe politics holding up the reporting. I've been looking for any local news on the matter and haven't found any yet.
Maybe if they knew that you were on the trail they'd be more forthcoming
reply to post by sageturkey
An email has been sent.
Full details were included - all links to GFZ, EMSC, seismograms and travel calc times etc. They cannot deny it happened!
An email has been sent.
Full details were included - all links to GFZ, EMSC, seismograms and travel calc times etc. They cannot deny it happened!
It looks like a decent sized quake waay off the Oregon coast. Mag 5.0 EMSC
.
Not on USGS yet...strange.
USGS is in with Mag 5.3 mb
Not on USGS yet...strange.
USGS is in with Mag 5.3 mb
edit on 1/29/2013 by Olivine because:
add
edit on 1/29/2013 by Olivine because: (no reason given)
reply to post by Olivine
Looks to be right on the Blanco Fracture Zone where a lot of them take place. Haven't seen any of this size for a little while now, at least a few months anyway?
Oh, and GET 'EM PM!!!
Looks to be right on the Blanco Fracture Zone where a lot of them take place. Haven't seen any of this size for a little while now, at least a few months anyway?
Oh, and GET 'EM PM!!!
edit on 29-1-2013 by sageturkey because: More to add
reply to post by sageturkey
Taking a quick look at that area, you're correct. It looks like there was m 4.7 back in October, a bit farther west. Here is table showing events near the Blanco going back to 1982.
Here is a pic of the area I pulled the data from:
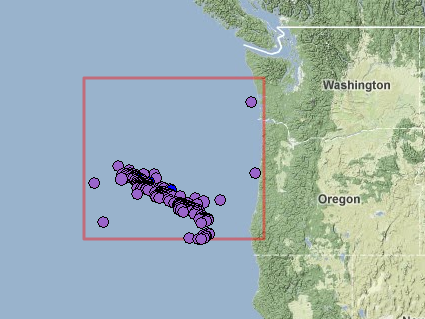
Source
(zoomed to area, EQ's 4.5 and larger, most recent 1st)
Taking a quick look at that area, you're correct. It looks like there was m 4.7 back in October, a bit farther west. Here is table showing events near the Blanco going back to 1982.
Here is a pic of the area I pulled the data from:
Source
(zoomed to area, EQ's 4.5 and larger, most recent 1st)
edit on 1/29/2013 by Olivine because: add link and pic
new topics
-
12 jurors selected in Trump criminal trial
US Political Madness: 24 minutes ago -
Iran launches Retalliation Strike 4.18.24
World War Three: 38 minutes ago -
Israeli Missile Strikes in Iran, Explosions in Syria + Iraq
World War Three: 1 hours ago -
George Knapp AMA on DI
Area 51 and other Facilities: 6 hours ago -
Not Aliens but a Nazi Occult Inspired and then Science Rendered Design.
Aliens and UFOs: 6 hours ago -
Louisiana Lawmakers Seek to Limit Public Access to Government Records
Political Issues: 9 hours ago -
The Tories may be wiped out after the Election - Serves them Right
Regional Politics: 10 hours ago
top topics
-
BREAKING: O’Keefe Media Uncovers who is really running the White House
US Political Madness: 13 hours ago, 25 flags -
George Knapp AMA on DI
Area 51 and other Facilities: 6 hours ago, 20 flags -
Biden--My Uncle Was Eaten By Cannibals
US Political Madness: 14 hours ago, 18 flags -
Israeli Missile Strikes in Iran, Explosions in Syria + Iraq
World War Three: 1 hours ago, 8 flags -
"We're All Hamas" Heard at Columbia University Protests
Social Issues and Civil Unrest: 14 hours ago, 7 flags -
Louisiana Lawmakers Seek to Limit Public Access to Government Records
Political Issues: 9 hours ago, 7 flags -
So I saw about 30 UFOs in formation last night.
Aliens and UFOs: 12 hours ago, 5 flags -
Not Aliens but a Nazi Occult Inspired and then Science Rendered Design.
Aliens and UFOs: 6 hours ago, 3 flags -
Do we live in a simulation similar to The Matrix 1999?
ATS Skunk Works: 13 hours ago, 3 flags -
The Tories may be wiped out after the Election - Serves them Right
Regional Politics: 10 hours ago, 3 flags
active topics
-
Israeli Missile Strikes in Iran, Explosions in Syria + Iraq
World War Three • 17 • : YourFaceAgain -
12 jurors selected in Trump criminal trial
US Political Madness • 2 • : RazorV66 -
African "Newcomers" Tell NYC They Don't Like the Free Food or Shelter They've Been Given
Social Issues and Civil Unrest • 16 • : stelth2 -
It has begun... Iran begins attack on Israel, launches tons of drones towards the country
World War Three • 883 • : 777Vader -
-@TH3WH17ERABB17- -Q- ---TIME TO SHOW THE WORLD--- -Part- --44--
Dissecting Disinformation • 536 • : 777Vader -
Elites disapearing
Political Conspiracies • 29 • : 777Vader -
Iran launches Retalliation Strike 4.18.24
World War Three • 6 • : JimmyNeutr0n -
MULTIPLE SKYMASTER MESSAGES GOING OUT
World War Three • 37 • : YourFaceAgain -
Mandela Effect - It Happened to Me!
The Gray Area • 106 • : CCoburn -
Candidate TRUMP Now Has Crazy Judge JUAN MERCHAN After Him - The Stormy Daniels Hush-Money Case.
Political Conspiracies • 388 • : matafuchs