It looks like you're using an Ad Blocker.
Please white-list or disable AboveTopSecret.com in your ad-blocking tool.
Thank you.
Some features of ATS will be disabled while you continue to use an ad-blocker.

T-28 Days and counting!
page: 3share:
reply to post by PuterMan
For your Hurricane chart, I'd stick with frequency (how many form) and force (hurricane category).
Is your data for the entire world? Or just the Atlantic?
For your Hurricane chart, I'd stick with frequency (how many form) and force (hurricane category).
Is your data for the entire world? Or just the Atlantic?
reply to post by JustMike
Hi Mike. It is a bit of a headache because unlike the East side of the Pacific plate (the Wast coasts of USA and South America) there is not a nice defined edge on the West side of the plate because it splits around Indonesia and that region.
I have nor forgotten, but have not sorted out how I want to do it.
Any input on that would be appreciated.
PS As you can see I am keeping it as one thread and counting down the days in my signature.
but as I mentioned somewhere before, it would help if we could also perhaps have some details of eg western side of the ring of fire events vs eastern side. Can that be done or is it a huge headache to set up?
Hi Mike. It is a bit of a headache because unlike the East side of the Pacific plate (the Wast coasts of USA and South America) there is not a nice defined edge on the West side of the plate because it splits around Indonesia and that region.
I have nor forgotten, but have not sorted out how I want to do it.
Any input on that would be appreciated.
PS As you can see I am keeping it as one thread and counting down the days in my signature.
reply to post by eriktheawful
Entire world which was why I went for force to give a measure of the volume current at any given time. I could split it into the six areas perhaps.
Entire world which was why I went for force to give a measure of the volume current at any given time. I could split it into the six areas perhaps.
Originally posted by PuterMan
reply to post by eriktheawful
Entire world which was why I went for force to give a measure of the volume current at any given time. I could split it into the six areas perhaps.
I'd keep it one for overall since hurricane season shifts from the northern hemisphere to the south.
I'd like to see that chart as with climate change the idea was that there would be more frequency of hurricanes and stronger too, but I've not seen any charts put together for it. Of course the numbers will be skewed if you go too far back due to the lack of satellite data as these storms were only then reported by ships and if they happened to hit land.
Would be interesting to see.
ETA: of course the chart doesn't prove man made climate change or anything like that, (I'm a skeptic of AGW myself), but it would be a good chart to see.
edit on 24-11-2012 by eriktheawful because: (no reason given)
reply to post by Chadwickus
Pff...days. It's the end of the world, we need a proper count down.
Ok, commencing ...
T- 2 368 800
T- 2 368 799
T - 2 368 798
Come on... count!!
Maybe we should graph how many new threads are started on the subject each day.
Pff...days. It's the end of the world, we need a proper count down.
Ok, commencing ...
T- 2 368 800
T- 2 368 799
T - 2 368 798
Come on... count!!
Hey PM. I found this report that may be of interest to you and others prepared in 2010. Link to report:
geochange-report.org...:possible-forecasts&catid=35:1st-report&Itemid=111
Their conclusions:
"CONCLUSIONS
We have carried out long-term forecasting of the evolution of global seismic, volcanic, tsunami and solar activity. The forecasting was based on identification of cyclicities and other regularities in the distribution of numbers of earthquakes, volcanic eruptions and tsunamis for past periods of time and use of the established regularities in the development patterns for future processes.
All long-term forecasts for natural disasters have been made for the period between 2010 and 2016. Two cycles of increased activity with peaks in 2011 and 2013 and a local minimum in 2012 have been identified in long-term forecasts for large earthquakes, volcanic eruptions and tsunamis. By 2016, a decline in activity of all geodynamic cataclysms is expected.
Global changes in a number of geophysical parameters and the high correlation of the period of “explosive intensification” of natural disasters throughout the entire volume of Earth including the lithosphere, hydrosphere and atmosphere over the past two decades – all are indicative of release of an unusually high level of extra endogenous and exogenous energy.
The expected activity of natural disasters may have very serious negative consequences for the stable progress of civilization, leading to death and destruction unprecedented in human history. Economic implications for countries prone to natural disasters may be catastrophic.
It is necessary to unite scientists, international organizations and governments of various states under UN auspices in order to take effective measures to counter natural disasters and minimize casualties and damage they cause to humanity."
Interesting read to say the least...
Originally posted by HTapoicos
See, I can't get excited about this subject because the reality is; if it is coming it's coming and there is nothing we can do about it.
So, lay back, smoke pot, get laid, drive fast or whatever else you do for release, then if you wake up on the day after, then it didn't happen and you had a good time - and if you wake up dead, hey, you had a good time.
Never a truer word! But don't go out borrowing millions because you will still have to pay it back dead or not!
You see folks CranialSponge is the true disinformation agent and a banker to boot. By advising you that all is not as I say, in other words that a world event will happen, the aim is to make you throw caution to the winds and borrow recklessly from the banks to have a stomper of a party on the way out, and just for a short time to experience the world of super-yachts, $4000 a night hotels and other such luxuries. $4000 a night hookers even if you must!
Then HTapoicos comes along, soothing you into a false sense of security. "Have a good time", "Relax, don't worry". It is quite obvious to me that the banker stooge CranialSponge employs HTapoicos.
I can be contacted at the Ministry Of Truth should you need further evidence of this.
reply to post by eriktheawful
I have started on it. I got back to 2011 so far but it does take a long time. I will post it on ATS when I have got back to 1990 (my target year)
but I've not seen any charts put together for it.
I have started on it. I got back to 2011 so far but it does take a long time. I will post it on ATS when I have got back to 1990 (my target year)
reply to post by whatnext21
Pretty much what I have been saying for over a year now. We have hit the peak and are on the decline until it builds back up to 2060. The low ebb will be 2030. It is all based on the Solar cycles. This also control climate change.
I believe we have passed the top so I am not sure about their peak in 2013. I don't believe we will have another Mag 9 in 2012 but it may be a little busier than 2012.
All long-term forecasts for natural disasters have been made for the period between 2010 and 2016. Two cycles of increased activity with peaks in 2011 and 2013 and a local minimum in 2012 have been identified in long-term forecasts for large earthquakes, volcanic eruptions and tsunamis. By 2016, a decline in activity of all geodynamic cataclysms is expected.
Pretty much what I have been saying for over a year now. We have hit the peak and are on the decline until it builds back up to 2060. The low ebb will be 2030. It is all based on the Solar cycles. This also control climate change.
I believe we have passed the top so I am not sure about their peak in 2013. I don't believe we will have another Mag 9 in 2012 but it may be a little busier than 2012.
Originally posted by PuterMan
reply to post by eriktheawful
but I've not seen any charts put together for it.
I have started on it. I got back to 2011 so far but it does take a long time. I will post it on ATS when I have got back to 1990 (my target year)
I'd also thought about flooding (lot's of 2012 maps floating around out there showing a very flooded out USA), but then what would be a base line? What is "normal flooding" (other than rivers like the Nile, etc)? Then I also thought about this past year's drought, and how most of the flooding we've seen at least this past year has been from storm surges, etc. So I'm not too sure a chart like that would be very useful.
Increased Meteorite Activity? Boy, I'm thinking that one would be a big headache for you to do! And of course I think the numbers would be skewed due to the increased ability of people to be able to capture video/pictures and post them on the internet as compared to just 10 years ago. Then of course there is the fact that each debris field that the Earth passes through becomes weaker each year with less debris until we have new cometary tails to pass through. But, this is something that a lot of people lately have been pointing at and claiming is on the rise.
reply to post by PuterMan
Hi Puterman and thanks for the response.
I appreciate that deliniating events around the ring of fire is difficult, for the very reason you mentioned. Perhaps it could be done after a fashion by defining the eastern side as "the Americas" -- say from the island chain off Alaska, on down past the Nth American and Sth American west coastal and near-coastal regions, with the other "half" being all the rest?
While comparing one "half" with the other could be interesting in itself, what might be even more useful is to see the relative amounts of activity (and hence energy release) within those two loosely-defined regions, over a longer period of time. True, short-term comparisons for the purpose of this countdown are also interesting, but it would be good to be able to weigh any such perceived variations against longer-term statistical/historical data.
For example, it would be interesting to see how the centenary list or other long(ish) term databases would look in that context -- obviously within their own limitations of reliability. It just seems to me that in the shorter term, there seems to be an increase in the number of mag six and bigger events in "the Americas" (ie western coastal regions), but that's only an impression and not worth much without good, longer-term data to back it up.
EDIT:
That's an excellent way to manage this. Anyone can find the latest day from your signature but also go back within the thread to see what's gone before. Brilliant.
Mike
Hi Puterman and thanks for the response.
I appreciate that deliniating events around the ring of fire is difficult, for the very reason you mentioned. Perhaps it could be done after a fashion by defining the eastern side as "the Americas" -- say from the island chain off Alaska, on down past the Nth American and Sth American west coastal and near-coastal regions, with the other "half" being all the rest?
While comparing one "half" with the other could be interesting in itself, what might be even more useful is to see the relative amounts of activity (and hence energy release) within those two loosely-defined regions, over a longer period of time. True, short-term comparisons for the purpose of this countdown are also interesting, but it would be good to be able to weigh any such perceived variations against longer-term statistical/historical data.
For example, it would be interesting to see how the centenary list or other long(ish) term databases would look in that context -- obviously within their own limitations of reliability. It just seems to me that in the shorter term, there seems to be an increase in the number of mag six and bigger events in "the Americas" (ie western coastal regions), but that's only an impression and not worth much without good, longer-term data to back it up.
EDIT:
PS As you can see I am keeping it as one thread and counting down the days in my signature.
That's an excellent way to manage this. Anyone can find the latest day from your signature but also go back within the thread to see what's gone before. Brilliant.
Mike
edit on 24/11/12 by JustMike because: (no reason given)
Originally posted by PuterMan
23 in total, but bear in mind that 16 are considered to be always erupting.
I did think that was slightly unfair, to list Stromboli and Kilauea etc. If they weren't erupting, now that would be a scary headline.
Anyway, as to things to watch, is there a global list of extreme temperatures, or anything like that? To work out any potential variance of temperature or average temperatures worldwide. All I can find with a quick search all are either by year or in a wonderful ASCII file.
reply to post by PuterMan
Everything seems very calm.
That volcano in Mexico has not popped off yet.
I heard that a nearby asteroid could effect earthquakes on Earth but it was - bumped-.
We are out of harms way.
Everything seems very calm.
That volcano in Mexico has not popped off yet.
I heard that a nearby asteroid could effect earthquakes on Earth but it was - bumped-.
We are out of harms way.
Originally posted by PuterMan
reply to post by whatnext21
All long-term forecasts for natural disasters have been made for the period between 2010 and 2016. Two cycles of increased activity with peaks in 2011 and 2013 and a local minimum in 2012 have been identified in long-term forecasts for large earthquakes, volcanic eruptions and tsunamis. By 2016, a decline in activity of all geodynamic cataclysms is expected.
Pretty much what I have been saying for over a year now. We have hit the peak and are on the decline until it builds back up to 2060. The low ebb will be 2030. It is all based on the Solar cycles. This also control climate change.
I believe we have passed the top so I am not sure about their peak in 2013. I don't believe we will have another Mag 9 in 2012 but it may be a little busier than 2012.
Have you noticed that the sun appears more white and less yellow?
What's going on?
reply to post by PuterMan
You took alot of time putting those together. Have you noticed a pattern?or cycle? Well, good luck and we'll see how it plays out. I believe it's not the end of the world but the beginning of hope?
You took alot of time putting those together. Have you noticed a pattern?or cycle? Well, good luck and we'll see how it plays out. I believe it's not the end of the world but the beginning of hope?
Dammit PM, now you've gone and done it...
Attention all agents:
Operation Vaseline has been compromised !
I repeat, Operation Vaseline has been compromised !
Get those hedge funds over to our associates in the Caymans ! Where's our bloody derivative interim reports ?! Has the Starscape modular lifepod been finished ? Why isn't our lifepod ready to go ? Where's my assistant ? Someone get my assistant ! I need a Twinkie, would someone bring me a damn Twinkie ! We need to get on the phone with headquarters, the boss needs to know what's happening ! I want my mommy...
Man the boats !!
T-26 Days and counting
No doom yet! No doom in sight but early days yet. It is fairly quiet on the geophysical front and nothing new in the way of tropical storms at present.
I am still expecting something to happen at Vanuatu in the fairly near future, but will it be in time for the end of the world? Who knows? Maybe!
Earthquakes
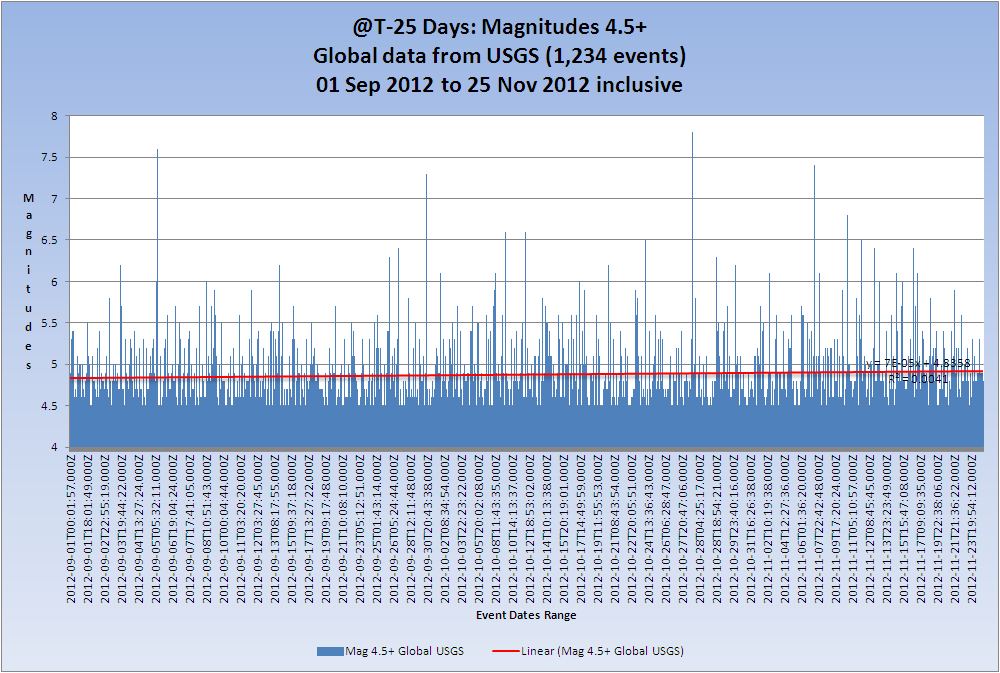
All magnitudes 4.5+
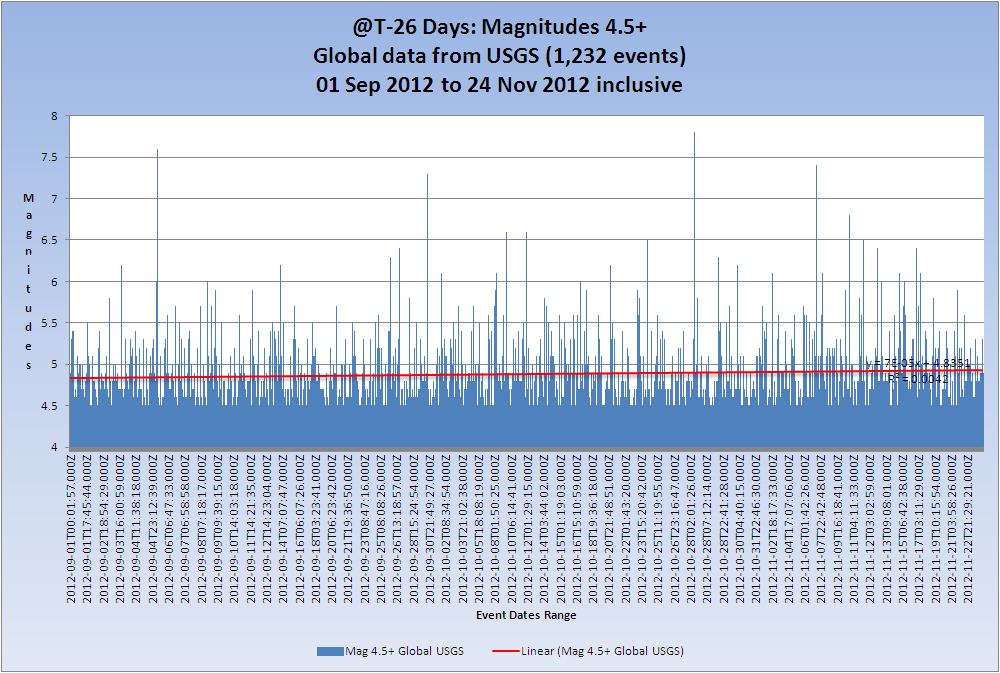
You probably can't see the difference but there is a very minuscule decrease in the upwards trend. R squared dropped from 0.0043 to 0.0042
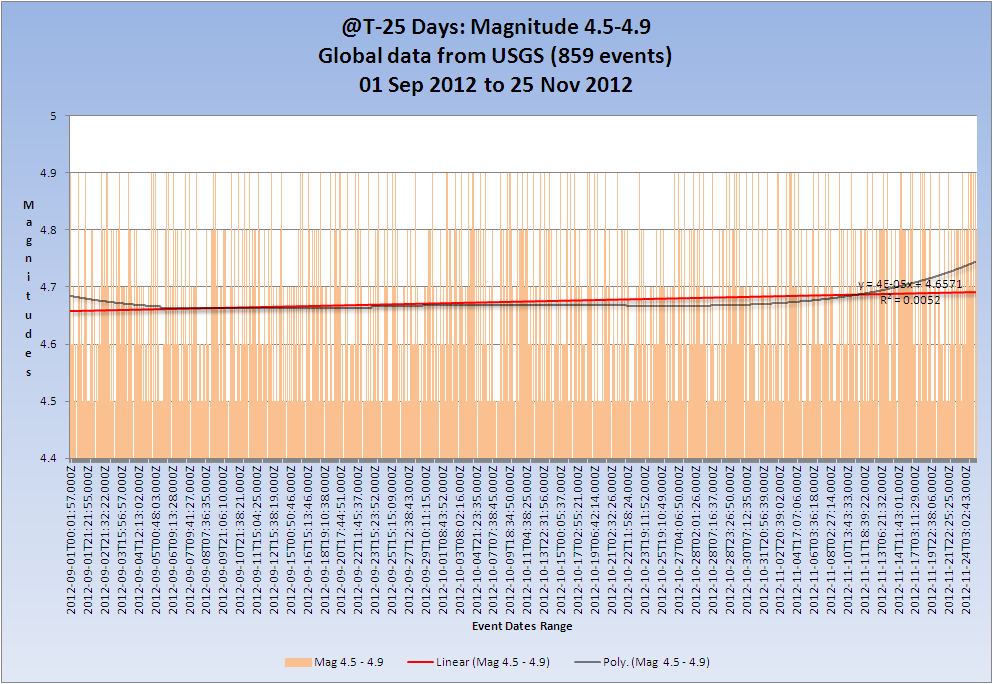
Magnitude 4.5-4.9
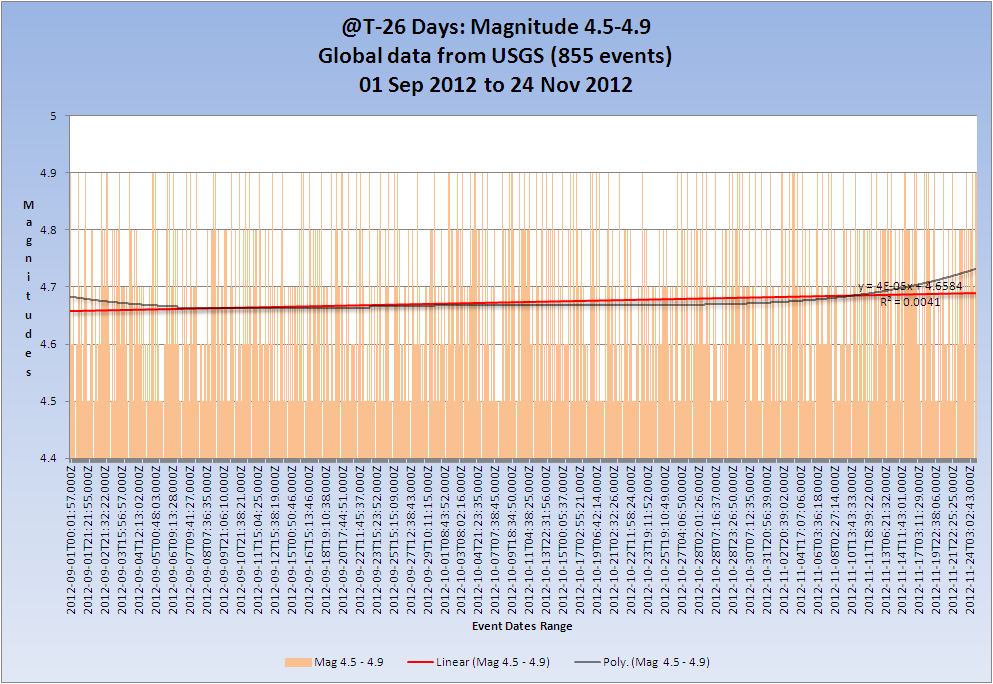
An increase in the trend of Mag 4.5 to 4.9 although again minuscule. R squared changed from 0.0025 to 0.0041
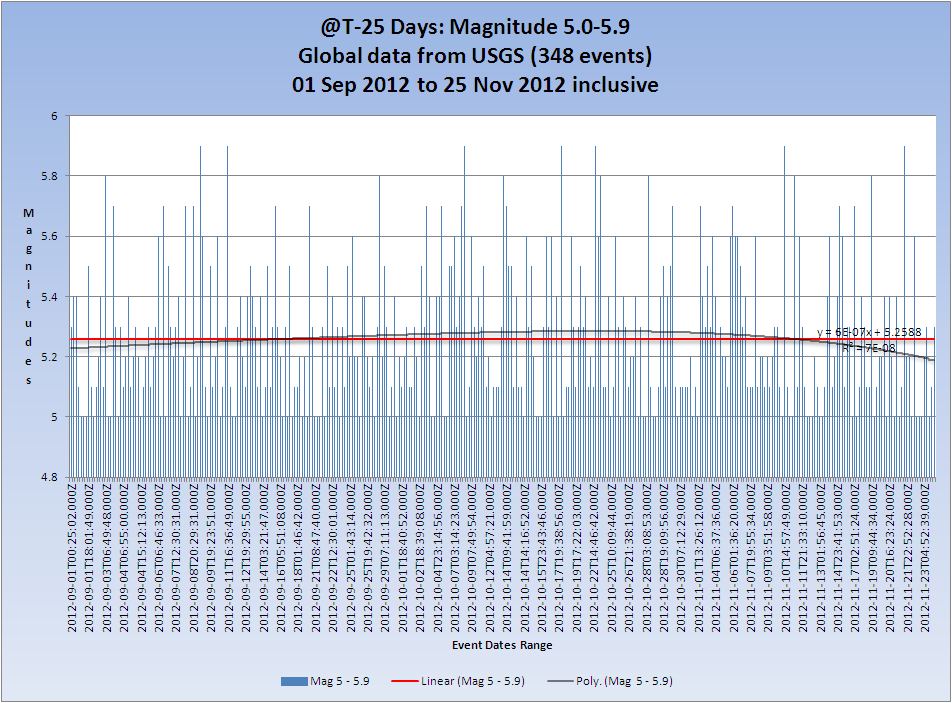
Magnitude 5.0-5.9

For all intents and purposes the trend of Mag 5s is flat.
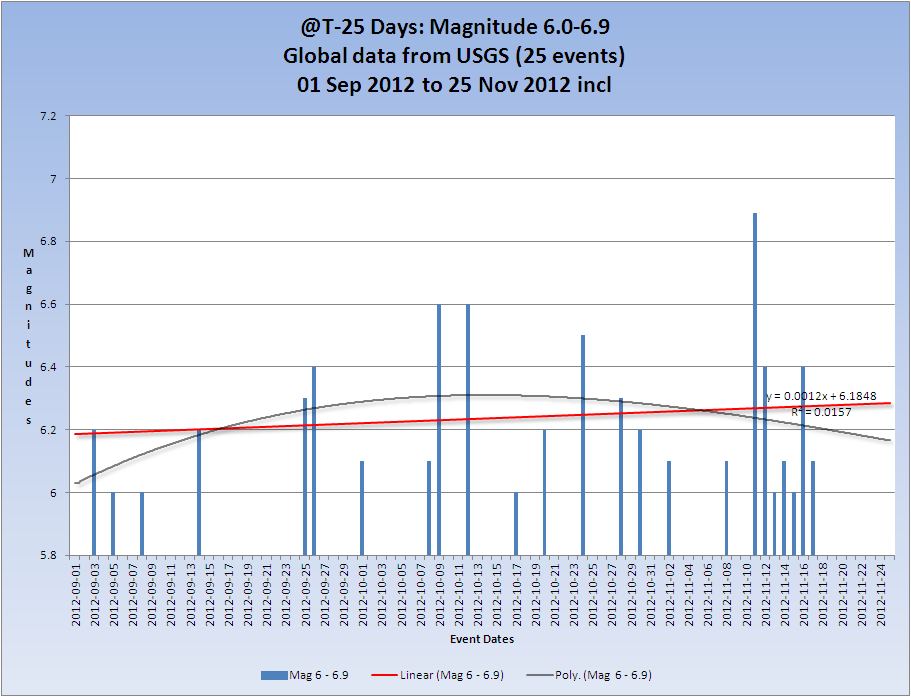
Magnitude 6.0-6.9
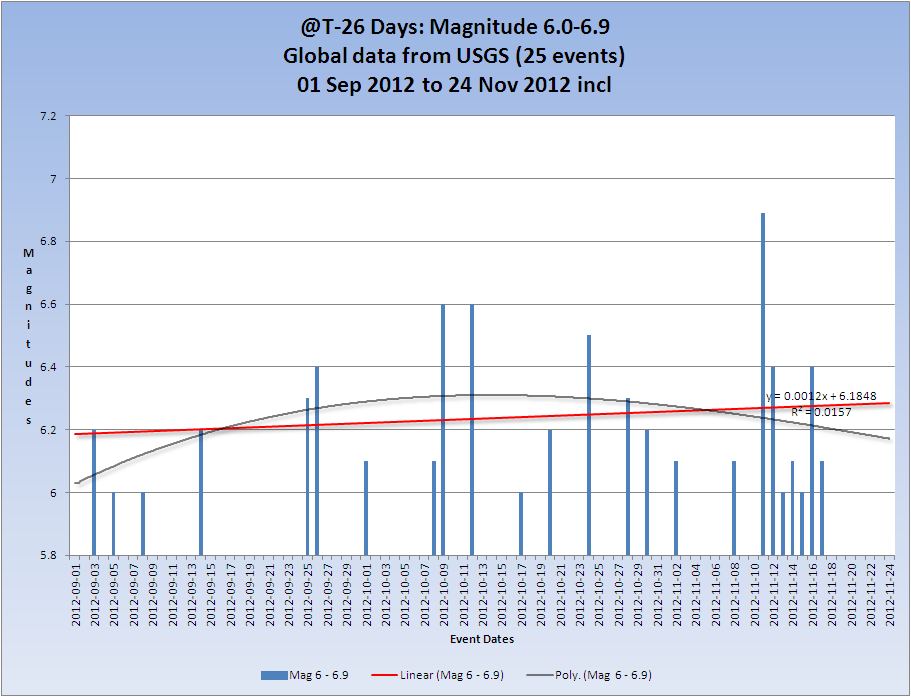
No change. A mag 6 or greater has to be very imminent now.
Magnitude 7.0-7.9
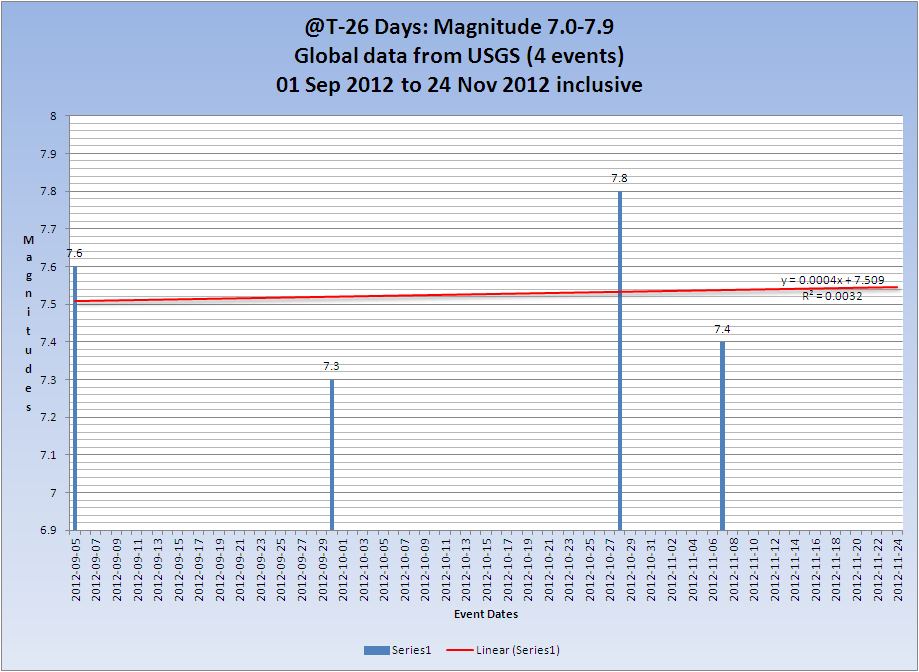
No change.
Volcanoes
No change as far as I am aware. The Smithsonian site is still down for activity reports and I guess will not be repaired until Monday now. I have reported it.
Hurricanes and other Category 1+ storms
No change. Tropical Storm BOLDWIN is still active in the Southern Indian Ocean but has nor reached Cat 1.
That concludes the report for T-26
Originally posted by PuterMan
Originally posted by HTapoicos
See, I can't get excited about this subject because the reality is; if it is coming it's coming and there is nothing we can do about it.
So, lay back, smoke pot, get laid, drive fast or whatever else you do for release, then if you wake up on the day after, then it didn't happen and you had a good time - and if you wake up dead, hey, you had a good time.
Never a truer word! But don't go out borrowing millions because you will still have to pay it back dead or not!
You see folks CranialSponge is the true disinformation agent and a banker to boot. By advising you that all is not as I say, in other words that a world event will happen, the aim is to make you throw caution to the winds and borrow recklessly from the banks to have a stomper of a party on the way out, and just for a short time to experience the world of super-yachts, $4000 a night hotels and other such luxuries. $4000 a night hookers even if you must!
Then HTapoicos comes along, soothing you into a false sense of security. "Have a good time", "Relax, don't worry". It is quite obvious to me that the banker stooge CranialSponge employs HTapoicos.
I can be contacted at the Ministry Of Truth should you need further evidence of this.
i wonder if you could graph the magnitude of financial collapse from our government living by this model you speak of because they sure are living just like you described.
i saw you online and had to say hi. lol
anyway this past year iv been quietly following all of this and i have notice a below normal amount of mag 4p+ quakes globally .. but still nothing to worry about it in my opinion and last time i checked you trusted my opinion above that of the usual fools found on here these days ... unless i became retarded in my absence ..
im in the beginning stages of planning volcano watch 2013 . i got a great thread in mind ..
cheers to see you still around bro
T-25 Days and counting
VERY quiet yesterday (25th Nov) Only 4 Mag 4 quakes, and if you use EMSC only 6.
Alysha.angel stated
below normal amount of mag 4p+ quakes globally
In the past 365 days just over 5,500 recorded by USGS. The USGS average of Mag 4 quakes per year is 13,000 however I just wonder if the reason it seems low is because of the recent USGS policy of not reporting under 4.5 and the fact that they really cover very little in Europe of the lower range.
Having said that EMSC have even fewer!! 5,268 over the same period so I guess Alysha.angel is right.
Earthquakes
2012-11-25T22:57:42.000Z,-9.4626,-63.0168,4.7,19.4,Rondonia. Brazil
2012-11-25T22:11:45.000Z,-44.3567,-77.8578,4.9,14.3,off the coast of Aisen. Chile
2012-11-25T12:33:18.000Z,-56.1571,-27.3847,4.9,109.1,South Sandwich Islands region
2012-11-25T07:14:53.000Z,5.7204,126.6255,4.8,57.3,Mindanao. Philippines
All magnitudes above 4.5
No change on the trend
Magnitude 4.5 - 4.9
No effective change in trend.
Magnitude 5 - 5.9
No effective change in trend.
Magnitude 6 - 6.9
No effective change in trend.
Magnitude 7 - 7.9

No effective change in trend.
Volcanoes
No change from yesterday. I am hoping Smithsonian will be back some time today.
Category 1+ storms
No new Cat 1+ storms but new additions to Tropical Depressions in the Western Pacific
26 Tropical Depression TWENTY 25-26 NOV 30 - Active
27 Tropical Depression 26W 26-26 NOV 30 - Active
Tropical storm BOLDWIN in the Southern Indian Ocean is no longer marked active.
That concludes the report of yesterday 25th November 2012 UTC.
new topics
-
God's Righteousness is Greater than Our Wrath
Religion, Faith, And Theology: 2 hours ago -
Electrical tricks for saving money
Education and Media: 5 hours ago -
VP's Secret Service agent brawls with other agents at Andrews
Mainstream News: 7 hours ago -
Sunak spinning the sickness figures
Other Current Events: 7 hours ago -
Nearly 70% Of Americans Want Talks To End War In Ukraine
Political Issues: 8 hours ago -
Late Night with the Devil - a really good unusual modern horror film.
Movies: 9 hours ago -
Cats Used as Live Bait to Train Ferocious Pitbulls in Illegal NYC Dogfighting
Social Issues and Civil Unrest: 11 hours ago
top topics
-
VP's Secret Service agent brawls with other agents at Andrews
Mainstream News: 7 hours ago, 9 flags -
Cats Used as Live Bait to Train Ferocious Pitbulls in Illegal NYC Dogfighting
Social Issues and Civil Unrest: 11 hours ago, 8 flags -
Electrical tricks for saving money
Education and Media: 5 hours ago, 4 flags -
HORRIBLE !! Russian Soldier Drinking Own Urine To Survive In Battle
World War Three: 15 hours ago, 3 flags -
Nearly 70% Of Americans Want Talks To End War In Ukraine
Political Issues: 8 hours ago, 3 flags -
Sunak spinning the sickness figures
Other Current Events: 7 hours ago, 3 flags -
Late Night with the Devil - a really good unusual modern horror film.
Movies: 9 hours ago, 2 flags -
The Good News According to Jesus - Episode 1
Religion, Faith, And Theology: 13 hours ago, 1 flags -
God's Righteousness is Greater than Our Wrath
Religion, Faith, And Theology: 2 hours ago, 0 flags
active topics
-
New whistleblower Jason Sands speaks on Twitter Spaces last night.
Aliens and UFOs • 55 • : baablacksheep1 -
VP's Secret Service agent brawls with other agents at Andrews
Mainstream News • 40 • : ThatSmellsStrange -
Cats Used as Live Bait to Train Ferocious Pitbulls in Illegal NYC Dogfighting
Social Issues and Civil Unrest • 20 • : Asher47 -
Nearly 70% Of Americans Want Talks To End War In Ukraine
Political Issues • 12 • : Asher47 -
Electrical tricks for saving money
Education and Media • 4 • : Lumenari -
DONALD J. TRUMP - 2024 Candidate for President - His Communications to Americans and the World.
2024 Elections • 514 • : WeMustCare -
The Acronym Game .. Pt.3
General Chit Chat • 7744 • : bally001 -
Truth Social goes public, be careful not to lose your money
Mainstream News • 128 • : Astyanax -
Sunak spinning the sickness figures
Other Current Events • 5 • : glen200376 -
SETI chief says US has no evidence for alien technology. 'And we never have'
Aliens and UFOs • 44 • : MikeDeGrasseTyson