It looks like you're using an Ad Blocker.
Please white-list or disable AboveTopSecret.com in your ad-blocking tool.
Thank you.
Some features of ATS will be disabled while you continue to use an ad-blocker.

1880 IS getting colder!
page: 10share:
reply to post by PuterMan
Nice find! NO legitimate explanation, but I will offer an explanation. They are deliberately altering the data, to deceive and scare people. Considering all of the lies and misrepresentations that have been discovered, this should not surprise anyone.
I remember, when reading State of Fear by Michael Crichton, that he talked about (in a forward or afterward) getting date from online sites, that was later made unavailable to the public. I know I have heard, personally, people misrepresent data. Example (and the story of where I heard this is astounding...) - one woman was talking about ice caps on South American mountains melting, and blaming it on "global warming", totally ignoring that deforestation is the actual reason. A REAL reason for concern, and she preferred to promote a false agenda instead.
I wouldn't be surprised if there is some sort of 'global warming' agenda behind this.
While there are such reports of global warming there are also respected scientists saying there is an impending ice age.
Generally, there appears to more EXTREME weather around the globe that could account for an increase in mean temperatures annually.
There appears to be much more extreme winters and drought / wet summers. Here in the UK and other places in Europe we had aquifer droughts whilst enduring the wettest summers on record, accompanied by flooding. The US had record breaking heat waves and droughts. Our winters here have been very extreme, the Big Freeze where it was below freezing for weeks constantly, the Danube freezing over almost entirely last year.
My feelings are, it could be the position Earth is in in the Solar System, or more precisely, the Solar Systems' position in relation to the Oort cloud and Kuiper Belt. The most likely reason for the mass extinctions on Earth is when traversing this area of space that is known for sending comets Earth's way. This could somehow be affecting the protection offered by the Earth's protective electromagnetic shield and hence the climate.
ETA these extinction events are now known to have occurred over thousands of years, so the effects must have been gradual. For all anyone knows, including scientists, effects of certain large space objects entering the solar system vicinity could have effects even if they are 63 light years away. Even if the projected time scale for any effects of little known objects like Gliese 710 were 1.5 million years, who knows maybe it's effects via affecting Oort cloud comets could have affects. Let's hope not,but science hasn't even the knowledge yet of so many huge things sitting in the immediate vicinity of space.
Something is certainly affecting the Earth.
english.pravda.ru...
www.dailymail.co.uk...
edit on
1-12-2012 by theabsolutetruth because: (no reason given)
This article gives a more realistic angle than many reports about how science really has to wait and see before making presumptions.
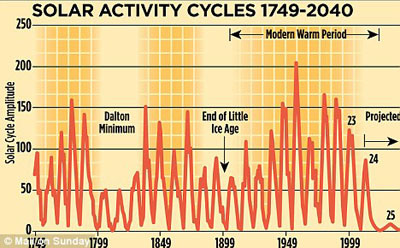
It also gives a 92% chance of there being a mini ice age at least, that is at least as cold as the previous Dalton Minimum of 1790 TO 1830 when there were frost fairs on the Thames and Hollands canals froze.
ETA I recall talk of another ice age at school in the 70's / 80's in the UK.
weeklyworldnews.com...
NASA and University of Arizona Graph
It also gives a 92% chance of there being a mini ice age at least, that is at least as cold as the previous Dalton Minimum of 1790 TO 1830 when there were frost fairs on the Thames and Hollands canals froze.
ETA I recall talk of another ice age at school in the 70's / 80's in the UK.
weeklyworldnews.com...
Analysis by experts at NASA and the University of Arizona – derived from magnetic-field measurements 120,000 miles beneath the sun’s surface – suggest that Cycle 25, whose peak is due in 2022, will be a great deal weaker still. According to a paper issued last week by the Met Office, there is a 92 per cent chance that both Cycle 25 and those taking place in the following decades will be as weak as, or weaker than, the ‘Dalton minimum’ of 1790 to 1830. In this period, named after the meteorologist John Dalton, average temperatures in parts of Europe fell by 2C. However, it is also possible that the new solar energy slump could be as deep as the ‘Maunder minimum’ (after astronomer Edward Maunder), between 1645 and 1715 in the coldest part of the ‘Little Ice Age’ when, as well as the Thames frost fairs, the canals of Holland froze solid.
NASA and University of Arizona Graph
edit on 1-12-2012 by theabsolutetruth because: (no reason given)
You can't rely on any nasa temperature charts as nasa has never based their temperature findings on any set location
they base it on random locations all over the world and even change/remove and add new stations all the time, they wont tell you for example when they close down a weather station in alaska and move it to africa
If you want to do some real research do it on a single location.
they base it on random locations all over the world and even change/remove and add new stations all the time, they wont tell you for example when they close down a weather station in alaska and move it to africa
If you want to do some real research do it on a single location.
If you read all the post, the first thing I said is this
The graph is from the article and it basically says scientists are looking at the longer term for predictions, as there are so many variations and possibilities. It also say some of the global warming scientists could end up being wrong, as is already sort of happening, with the retractions of certain things and the Co2 issue being hushed.
Essentially it shows the flaws of gov sponsored science and the agendas of some that could be manipulating data for the purpose of 'being right'.
However NASA are rather explicit in their detailing of how they measure temperatures, and adjust analysis methods.
data.giss.nasa.gov...
Here is some blurb from NASA on the 1880 anomalies
data.giss.nasa.gov...
More blurb about other anomalies
data.giss.nasa.gov...
This article gives a more realistic angle than many reports about how science really has to wait and see before making presumptions.
The graph is from the article and it basically says scientists are looking at the longer term for predictions, as there are so many variations and possibilities. It also say some of the global warming scientists could end up being wrong, as is already sort of happening, with the retractions of certain things and the Co2 issue being hushed.
Essentially it shows the flaws of gov sponsored science and the agendas of some that could be manipulating data for the purpose of 'being right'.
However NASA are rather explicit in their detailing of how they measure temperatures, and adjust analysis methods.
data.giss.nasa.gov...
The current analysis uses satellite observed nightlights to identify measurement stations located in extreme darkness and adjust temperature trends of urban and peri-urban stations for non-climatic factors, verifying that urban effects on analyzed global change are small. A paper describing the current analysis was published (Hansen et al. 2010) in Reviews of Geophysics in December 2010. The paper compares alternative analyses, and address questions about perception and reality of global warming. Alternative choices for the ocean data are tested. It is shown that global temperature change is sensitive to estimated temperature change in polar regions, where observations are limited. We suggest use of 12-month (and n×12) running mean temperature to fully remove the annual cycle and improve information content in temperature graphs. We conclude that global temperature continued to rise rapidly in the past decade, despite large year-to-year fluctuations associated with the El Niño-La Niña cycle of tropical ocean temperature. Record high global temperature during the period with instrumental data was reached in 2010. After that paper appeared, version 3 of the GHCN data became available. The current analysis is now based on the adjusted GHCN v3 data for the data over land. The ocean data are still based on Hadley Center's HadISST1 and Reynold's OISST based on satellite measurements. We maintain a running record of any modifications made to the analysis, available on our Updates to Analysis page. Graphs and tables are updated around the middle of every month using the current adjusted GHCN-v3 and SCAR files. The new files incorporate reports for the previous month and late reports and corrections for earlier months. The GHCNv3/SCAR data are modified to obtain station data from which our tables, graphs, and maps are constructed: The urban and peri-urban (i.e., other than rural) stations are adjusted so that their long-term trend matches that of the mean of neighboring rural stations. Urban stations without nearby rural stations are dropped.
Here is some blurb from NASA on the 1880 anomalies
data.giss.nasa.gov...
The analysis is limited to the period since 1880 because of poor spatial coverage of stations and decreasing data quality prior to that time. Meteorological station data provide a useful indication of temperature change in the Northern Hemisphere extratropics for a few decades prior to 1880, and there are a small number of station records that extend back to previous centuries. However, we believe that analyses for these earlier years need to be carried out on a station by station basis with an attempt to discern the method and reliability of measurements at each station, a task beyond the scope of our analysis. Global studies of still earlier times depend upon incorporation of proxy measures of temperature change. Programs used in the GISTEMP analysis and documentation on their use are available for download. The programs assume a Unix-like operating system and require familiarity with FORTRAN, C and Python for installation and use.
More blurb about other anomalies
data.giss.nasa.gov...
Anomalies and Absolute Temperatures Our analysis concerns only temperature anomalies, not absolute temperature. Temperature anomalies are computed relative to the base period 1951-1980. The reason to work with anomalies, rather than absolute temperature is that absolute temperature varies markedly in short distances, while monthly or annual temperature anomalies are representative of a much larger region. Indeed, we have shown (Hansen and Lebedeff, 1987) that temperature anomalies are strongly correlated out to distances of the order of 1000 km. For a more detailed discussion, see The Elusive Absolute Surface Air Temperature.
Originally posted by dmsuse
You can't rely on any nasa temperature charts as nasa has never based their temperature findings on any set location
they base it on random locations all over the world and even change/remove and add new stations all the time, they wont tell you for example when they close down a weather station in alaska and move it to africa
If you want to do some real research do it on a single location.
edit on 1-12-2012 by theabsolutetruth because: (no reason
given)
True, the data is just flawed in so many ways, it would be nice to see some impartial evidence for once, i would be interested to see how temperatures
have really changed, if at all.
reply to post by LadyGreenEyes
I did not have an answer for you earlier, but I do now. This comment in a thread is made by.....well read for yourself as he refutes an earlier commenter who says they don't believe it is going to get colder.
Source
Here we have an ex IPCC researcher stating in effect that the data is rubbish.
You really should go and read the initial post because this guy is a climate scientist and what he is saying is scary, and I am not the kind of person to be easily scared. I have read many texts about the 'Maunder minimum' but this is saying that what could actually happen is WAY beyond that.
Ice age possibly on Doorstep, the Radiative 'Greenhouse Effect" is NOT what it seems
Of course we cannot know if this guy is genuine, but it certainly looks that way to me.
I did not have an answer for you earlier, but I do now. This comment in a thread is made by.....well read for yourself as he refutes an earlier commenter who says they don't believe it is going to get colder.
I don't doubt the warming since 1979, at all...I do doubt pre-1979 data, though... I just prefer to use the most accurate data, and most legitimate physical analysis.
You mention "research"...what you say about "research" is not accurate...I was one of the scientists you cite, actually doing such "research"..I was a reviewer of the AR4 IPCC report..I've attended hundreds of conferences, and reviewed dozens of papers..even from the scientists you've cited here. But you're still making claims about me, and the science, that are not true.
Source
Here we have an ex IPCC researcher stating in effect that the data is rubbish.
You really should go and read the initial post because this guy is a climate scientist and what he is saying is scary, and I am not the kind of person to be easily scared. I have read many texts about the 'Maunder minimum' but this is saying that what could actually happen is WAY beyond that.
Ice age possibly on Doorstep, the Radiative 'Greenhouse Effect" is NOT what it seems
Abrupt climate change occurs when the system is forced to cross an "unfamiliar" threshold, one that does not allow the same atmospheric circulation regime to sustain in ability...which means that, if the Solar Cycles do shut down after this cycle, the Earth could either come close to, or surpass the perturbation threshold that has held us in the Holocene interglacial.
So, I predict that, depending on what this upcoming minimum turns out to be, will dtermine whether or not we're going into a simple cool period as seen in the 1970's/1900's, or whether it will be a steady, significant cooling, followed by a plunge into conditions that the system will not recover from, hence the end of the Holocene.
Of course we cannot know if this guy is genuine, but it certainly looks that way to me.
Unbeknown to me there is a site out there basically saying the same thing and doing a grand job of annotating the changes.
Source
All five databases are the result of much painstaking work, and they all represent admirable attempts towards establishing an estimate of recent global temperature changes. At the same time it should however be noted, that a temperature record which keeps on changing the past hardly can qualify as being correct.
Source
reply to post by PuterMan
This page with sets of graphs from GISS is pretty good, it shows the uncertainty estimates in green.
data.giss.nasa.gov...
This page with sets of graphs from GISS is pretty good, it shows the uncertainty estimates in green.
data.giss.nasa.gov...
reply to post by PuterMan
Interesting, but as you said, who knows if any of this is legitimate. Actually, I suspect that such things are not, because they seem to be more of the same scare tactics used by the GW crowd. Either we will all fry, or we will all freeze, but either way, they assume some mega-disaster. Of course, as a result, they can receive tons of research money, and fame, etc. I think the entire mess is about control. Scare people, then do things they won't like, to easily control them, in the name of "saving the planet", or some other excuse. I don't think this is any more valid that removing rights for "protection". If the climate alarmists get their way, they will be able to close off huge sections of land (as is happening now....), and force people to live in more contained areas. They will limit resources (a sure method of control), limit travel (for the masses, not for themselves), and so forth. Easily controlled people, with no way to travel, are easily removed as well.
Interesting, but as you said, who knows if any of this is legitimate. Actually, I suspect that such things are not, because they seem to be more of the same scare tactics used by the GW crowd. Either we will all fry, or we will all freeze, but either way, they assume some mega-disaster. Of course, as a result, they can receive tons of research money, and fame, etc. I think the entire mess is about control. Scare people, then do things they won't like, to easily control them, in the name of "saving the planet", or some other excuse. I don't think this is any more valid that removing rights for "protection". If the climate alarmists get their way, they will be able to close off huge sections of land (as is happening now....), and force people to live in more contained areas. They will limit resources (a sure method of control), limit travel (for the masses, not for themselves), and so forth. Easily controlled people, with no way to travel, are easily removed as well.
Ok its December and yesterday was in the low 60's todays top temp was 56 degrees.....hopefully its gonna cool down I am assuming this is coming off
the ocean....we are exspecting temps in the 50's all week.....sorry but for here its not normal every one is loving this weather but I know it's not
a good sign....where I'm from it should be cold as hell and it's not....I believe that the sun is getting hotter but I also believe that while we
are cutting down trees and at the same time putting tons of carbon in the air that it cant be a good mix.
reply to post by GREENFOX74
No, actually insolation is getting less which is why we are headed towards a Maunder Minimum.
They have been at the figures again. Now they have warmed 1880 and cooled the 1900s but of course warmed everything after about 1960.
GISSTEMPS or PISSTAKES?
I believe that the sun is getting hotter
No, actually insolation is getting less which is why we are headed towards a Maunder Minimum.
They have been at the figures again. Now they have warmed 1880 and cooled the 1900s but of course warmed everything after about 1960.
GISSTEMPS or PISSTAKES?
new topics
-
Bobiverse
Fantasy & Science Fiction: 15 minutes ago -
Florida man's trip overseas ends in shock over $143,000 T-Mobile phone bill
Social Issues and Civil Unrest: 20 minutes ago -
Former Labour minister Frank Field dies aged 81
People: 2 hours ago -
SETI chief says US has no evidence for alien technology. 'And we never have'
Aliens and UFOs: 4 hours ago -
This is our Story
General Entertainment: 6 hours ago -
President BIDEN Vows to Make Americans Pay More Federal Taxes in 2025 - Political Suicide.
2024 Elections: 9 hours ago -
Ode to Artemis
General Chit Chat: 10 hours ago
top topics
-
University student disciplined after saying veganism is wrong and gender fluidity is stupid
Education and Media: 17 hours ago, 14 flags -
President BIDEN Vows to Make Americans Pay More Federal Taxes in 2025 - Political Suicide.
2024 Elections: 9 hours ago, 12 flags -
Should Biden Replace Harris With AOC On the 2024 Democrat Ticket?
2024 Elections: 15 hours ago, 6 flags -
One Flame Throwing Robot Dog for Christmas Please!
Weaponry: 13 hours ago, 6 flags -
Don't take advantage of people just because it seems easy it will backfire
Rant: 13 hours ago, 4 flags -
Ditching physical money
History: 13 hours ago, 4 flags -
SETI chief says US has no evidence for alien technology. 'And we never have'
Aliens and UFOs: 4 hours ago, 4 flags -
Former Labour minister Frank Field dies aged 81
People: 2 hours ago, 3 flags -
Ode to Artemis
General Chit Chat: 10 hours ago, 3 flags -
This is our Story
General Entertainment: 6 hours ago, 2 flags
active topics
-
Russia Ukraine Update Thread - part 3
World War Three • 5725 • : BernnieJGato -
So this is what Hamas considers 'freedom fighting' ...
War On Terrorism • 248 • : network dude -
NASA Researchers Discover a Parallel Universe That Runs Backwards through Time - Alongside Us
Space Exploration • 70 • : seekshelter -
SETI chief says US has no evidence for alien technology. 'And we never have'
Aliens and UFOs • 21 • : network dude -
IDF Intel Chief Resigns Over Hamas attack
Middle East Issues • 43 • : TheWoker -
President BIDEN Vows to Make Americans Pay More Federal Taxes in 2025 - Political Suicide.
2024 Elections • 25 • : CriticalStinker -
University student disciplined after saying veganism is wrong and gender fluidity is stupid
Education and Media • 44 • : confuzedcitizen -
Who guards the guards
US Political Madness • 6 • : covent -
Remember These Attacks When President Trump 2.0 Retribution-Justice Commences.
2024 Elections • 53 • : Justoneman -
Bobiverse
Fantasy & Science Fiction • 0 • : DAVID64