It looks like you're using an Ad Blocker.
Please white-list or disable AboveTopSecret.com in your ad-blocking tool.
Thank you.
Some features of ATS will be disabled while you continue to use an ad-blocker.

1880 IS getting colder!
page: 1share:
It appears to be a fact that 1880, and many years after that, are getting colder by the year. Not only that but temperature means are getting warmer
by the year for the later figures.
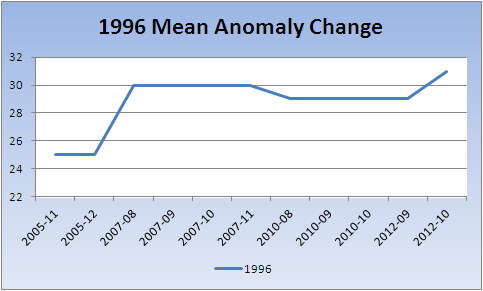
Take 1996 for example. That has warmed by .06°C in the last 7 years! The anomaly has gone from 25 (.25°C) to 31 (.31°C). It is scary to think that the temperature back in 2005 can still keep climbing even in 2012. Is this something to do with parallel universes perhaps?
OK before I go further with this let me explain the source of the data and what I have done to get the following charts.
I was musing on the fact that I had contacted a well known climate blog about this, but got no response. I did not know how to explain what I was seeing but I thought they may be interested.
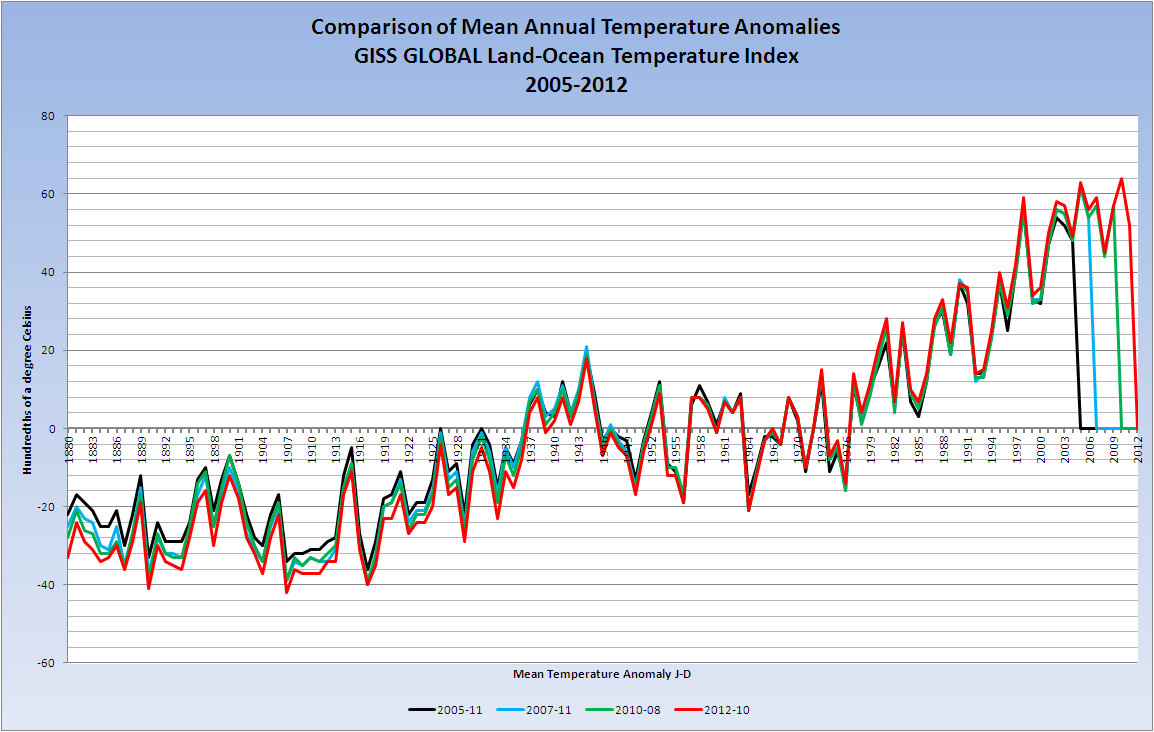
For the past year I have been collecting the GLOBAL Land-Ocean Temperature Index in 0.01 degrees Celsius (base period: 1951-1980) from this page
For over a year I have simply added the next single month figure to the bottom of my list. Last month however it just happened to catch my eye, as I was collecting the latest figure, that the 1880 mean had changed. Eh what? How can that be I thought.
After getting no response from the well known blog I resolved last night to see if I could find any historical data using the Internet Wayback machine. Nearly all data that I could get by putting in "data.giss.nasa.gov/gistemp" was not having permission to view (Permission denied). It seemed that the IWBM was actually accessing the NASA site and not it’s own archives. Undaunted I resorted to the mirror archive in Egypt. I struck lucky with 2005 November despite the fact that this is NOT available in the normal IWBM.
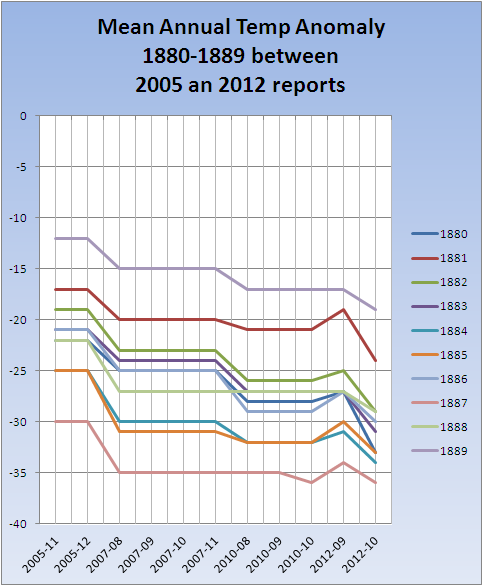
I managed to source a few more years from Bibalex and for clarity I have just shown one month figures from each of the years I have collected. It is very obvious that before the base it is steadily getting colder and after the base it is getting warmer, and by that I mean that past years are getting warmer and not the overall temperature.
You can see the rest of this, and download the Excel spreadsheet or PDF files of the data at 1880 IS getting colder!
Whilst this above is external content I have not put it in ex tags as it is my own work and not derived from anyone else.
One last chart for you
Anyone have any explanation as to how this can legitimately be correct?
Take 1996 for example. That has warmed by .06°C in the last 7 years! The anomaly has gone from 25 (.25°C) to 31 (.31°C). It is scary to think that the temperature back in 2005 can still keep climbing even in 2012. Is this something to do with parallel universes perhaps?
OK before I go further with this let me explain the source of the data and what I have done to get the following charts.
I was musing on the fact that I had contacted a well known climate blog about this, but got no response. I did not know how to explain what I was seeing but I thought they may be interested.
For the past year I have been collecting the GLOBAL Land-Ocean Temperature Index in 0.01 degrees Celsius (base period: 1951-1980) from this page
For over a year I have simply added the next single month figure to the bottom of my list. Last month however it just happened to catch my eye, as I was collecting the latest figure, that the 1880 mean had changed. Eh what? How can that be I thought.
After getting no response from the well known blog I resolved last night to see if I could find any historical data using the Internet Wayback machine. Nearly all data that I could get by putting in "data.giss.nasa.gov/gistemp" was not having permission to view (Permission denied). It seemed that the IWBM was actually accessing the NASA site and not it’s own archives. Undaunted I resorted to the mirror archive in Egypt. I struck lucky with 2005 November despite the fact that this is NOT available in the normal IWBM.
I managed to source a few more years from Bibalex and for clarity I have just shown one month figures from each of the years I have collected. It is very obvious that before the base it is steadily getting colder and after the base it is getting warmer, and by that I mean that past years are getting warmer and not the overall temperature.
You can see the rest of this, and download the Excel spreadsheet or PDF files of the data at 1880 IS getting colder!
Whilst this above is external content I have not put it in ex tags as it is my own work and not derived from anyone else.
One last chart for you
Anyone have any explanation as to how this can legitimately be correct?
edit on 18/11/2012 by PuterMan because: Maybe one day I will learn to spell check things before I create images of them!!!!!
Are you saying the information in the archives is changing?
I read your post, but I am a little confused at what your overall point is.
Sorry man, I do find it interesting.
I believe that the whole global temperature thing has scientists and government officials doing whatever it takes to get their viewpoints noticed.
I read your post, but I am a little confused at what your overall point is.
Sorry man, I do find it interesting.
I believe that the whole global temperature thing has scientists and government officials doing whatever it takes to get their viewpoints noticed.
reply to post by PuterMan
So you are saying that the data from 1880 is being changed?
I want to be sure I understand you here.
So you are saying that the data from 1880 is being changed?
I want to be sure I understand you here.
reply to post by PuterMan
If you are saying what i think you are saying and the recorded mean temperature of past years is changing, then you may be on to something pretty significant.
It would not suprise me to find out these numbers are being changed to support global warming. There is just too much money it in for those making the money to let it a little thing like the truth get in the way.
I hope you have been saving screen shots, documents, and any other form of proof for these changes.
Awesome catch!
DC
reply to post by network dude
Yes the older data is being changed. Not the data in the archives but on the published report. By comparing the 1880 figures from archived copies of the reports on the Wayback Machine I can see that the older figures are not the same. There are always figures for 1880 onwards as the text file always goes from that date, but each year the early temperatures get progressively cooler and the later years get very slightly warmer. This takes place either side of the base 1950 to 1980 figures.
Yes the older data is being changed. Not the data in the archives but on the published report. By comparing the 1880 figures from archived copies of the reports on the Wayback Machine I can see that the older figures are not the same. There are always figures for 1880 onwards as the text file always goes from that date, but each year the early temperatures get progressively cooler and the later years get very slightly warmer. This takes place either side of the base 1950 to 1980 figures.
Sounds to me like some one is cooking the books.Hmmmm somebody with an agenda perhaps?Now just who would benefit from making the warming look more
sever than it actually is? Follow the money.
You could be on to something here.
Initially I thought that the evolution of technology could account for the changed figures, but in this case, all of the data will be from historical records and not from scientific analysis of sedimentary layers, ice-cores, etc.
Initially I thought that the evolution of technology could account for the changed figures, but in this case, all of the data will be from historical records and not from scientific analysis of sedimentary layers, ice-cores, etc.
reply to post by OccamAssassin
Yes exactly which is why I thought it odd that the very early figures had changed. It was when I created the graph that it really jumped out of the page that the early one had gone down and the later ones gone up.
An aroma of pork in pastry containers wafted mentally though my head.
Initially I thought that the evolution of technology could account for the changed figures, but in this case, all of the data will be from historical records and not from scientific analysis of sedimentary layers, ice-cores, etc.
Yes exactly which is why I thought it odd that the very early figures had changed. It was when I created the graph that it really jumped out of the page that the early one had gone down and the later ones gone up.
An aroma of pork in pastry containers wafted mentally though my head.
It is much easier to change the past than the future. With a click of a mouse this can be accomplished, easier than getting rid of a lot of
textbooks. We have created a dangerous situation where people do not read written history but are reading rewritten history. What you are saying
does not surprise me at all. They will use all means accessible to them to accomplish what they desire. What you are seeing is just a small part of
the history being changed, they say it is in the best interest of the people but is it? In this case we need to take better care of our world,
letting the trees grow. We need the birds to supply nitrogen to the trees so they are fire resistant also. We are messing everything up but the ones
that are trying to straighten it out are looking in the wrong direction. A healthy ecosystem will help this planet to make it through these times.
You can put as much CO2 into the environment as you want if there are trees to eat it. Lots of trees, the older the better. Refining the CO2 too
much makes it rise, removing the particulates makes it look and smell better but makes it go higher in the atmosphere. What fools we are to think
what we perceive is what really is.
reply to post by PuterMan
Ha ha.
This is awesome. They probably thought no one would notice.
Just goes to show, nothing gets by ATS BS filter.
Your meticulousness and attention to detail should be rewarded.
I propose giving PuterMan the ATS Tinfoil Hat Award.
Ha ha.
This is awesome. They probably thought no one would notice.
Just goes to show, nothing gets by ATS BS filter.
Your meticulousness and attention to detail should be rewarded.
I propose giving PuterMan the ATS Tinfoil Hat Award.
Everything that can be done to push this global warming scam, is being done.
Hell, even the weather channel no longer gives the correct temperature in the summer anymore.
Instead of saying what the temp is, they now say what the heat index is, making it sound like its way hotter
than it really is.
Hell, even the weather channel no longer gives the correct temperature in the summer anymore.
Instead of saying what the temp is, they now say what the heat index is, making it sound like its way hotter
than it really is.
reply to post by watchitburn
I'll second that at least for this morning. Seems to be the most on topic Tin hat thread.
I propose giving PuterMan the ATS Tinfoil Hat Award.
I'll second that at least for this morning. Seems to be the most on topic Tin hat thread.
So, maybe our next step is to fact check the books ourselves?
Recorded temperature from the past doesn't change once recorded!
Our own local temperatures can be used for comparison...
Old newspapers, articles, weather reports...physical paper entries.
Those can't be manipulated!
I think you may have stumbled upon something bigger than we imagine.
Excellent work.
*S&F*
If you are adding data to the mean data temperature set and charting for the whole data collection, then, yes the data will change for the entire
periord.
Recording just this data set for a period and looking at the trend line will give the correct results...
Recording just this data set for a period and looking at the trend line will give the correct results...
reply to post by Shdak
No that is not what happens. The mean I am giving is the figure for the mean of the anomalies for the given year. This should not change over time, neither should the base set.
I agree that if you were taking a mean across all the years the value would change BUT IF the temperatures were increasing then the mean would also increase. In this case however each year is separate.
PM, you are too awesome for words!
This shows that the agenda is what matters, not something as banal as the truth. If this data is being manipulated, what other is, and to what purpose?
This shows that the agenda is what matters, not something as banal as the truth. If this data is being manipulated, what other is, and to what purpose?
Originally posted by lonegurkha
Sounds to me like some one is cooking the books.Hmmmm somebody with an agenda perhaps?Now just who would benefit from making the warming look more sever than it actually is? Follow the money.
I'm thinking more along the lines of Agenda 21, sustainable development and UN control. The more negatives they can show the more positive Agenda 21 would be for the world, right?
reply to post by phrig
How strange. That is about the time I contacted the well known climate blog about this. The blog was WUWT by the way. I never got any response from them.
How strange. That is about the time I contacted the well known climate blog about this. The blog was WUWT by the way. I never got any response from them.
reply to post by PuterMan
Puterman, first I must say that I admire the work you've put into the volcano/earthquake threads. However, these temperature adjustments are well known to us AGW skeptics. What you have found is just a continuation of these on going adjustments to show a "warming trend," to push the AGW meme. Here are some links to past blog posts from Steve McIntyre and Anthony Watts. Note the dates.
wattsupwiththat.com...
climateaudit.org...
And here is a great vid from Bob Tisdale FULLY explaining why we have warmed to the degree we have, in relation to the oceans.
www.youtube.com...
For those that can't watch it, it basically explains the El Nino and La Nina are NOT exact opposites of each other, and that La Nina is actually a heat generating phenomenon, forcing heat to build up in the Western Pacific. That heat, when released from the lower depths of the ocean during an El Nino, remains, and lingers in various regions of the oceans surface for YEARS. He also goes into the serious lack of past data that they are extrapolating from few data points to make it look like we actually have sufficient data to make the determinations of man made warming and the mysterious "adjustments" of the ARGO data. If you can, take the time to watch it. It's a two part vid and about 1 hr 35 min long in total, but well worth it, if you really want to understand the oceans role in our climate. It's eye opening.
I'll post other info in regard to solar activity later.
new topics
-
Supreme Court Oral Arguments 4.25.2024 - Are PRESIDENTS IMMUNE From Later Being Prosecuted.
Above Politics: 19 minutes ago -
Krystalnacht on today's most elite Universities?
Social Issues and Civil Unrest: 28 minutes ago -
Chris Christie Wishes Death Upon Trump and Ramaswamy
Politicians & People: 55 minutes ago -
University of Texas Instantly Shuts Down Anti Israel Protests
Education and Media: 3 hours ago -
Any one suspicious of fever promotions events, major investor Goldman Sachs card only.
The Gray Area: 5 hours ago -
God's Righteousness is Greater than Our Wrath
Religion, Faith, And Theology: 9 hours ago
top topics
-
VP's Secret Service agent brawls with other agents at Andrews
Mainstream News: 14 hours ago, 11 flags -
Nearly 70% Of Americans Want Talks To End War In Ukraine
Political Issues: 15 hours ago, 5 flags -
Sunak spinning the sickness figures
Other Current Events: 14 hours ago, 5 flags -
Electrical tricks for saving money
Education and Media: 12 hours ago, 4 flags -
Late Night with the Devil - a really good unusual modern horror film.
Movies: 16 hours ago, 3 flags -
Krystalnacht on today's most elite Universities?
Social Issues and Civil Unrest: 28 minutes ago, 3 flags -
Any one suspicious of fever promotions events, major investor Goldman Sachs card only.
The Gray Area: 5 hours ago, 2 flags -
University of Texas Instantly Shuts Down Anti Israel Protests
Education and Media: 3 hours ago, 2 flags -
Supreme Court Oral Arguments 4.25.2024 - Are PRESIDENTS IMMUNE From Later Being Prosecuted.
Above Politics: 19 minutes ago, 1 flags -
Chris Christie Wishes Death Upon Trump and Ramaswamy
Politicians & People: 55 minutes ago, 0 flags
active topics
-
Nearly 70% Of Americans Want Talks To End War In Ukraine
Political Issues • 65 • : Consvoli -
University of Texas Instantly Shuts Down Anti Israel Protests
Education and Media • 42 • : Vermilion -
Remember These Attacks When President Trump 2.0 Retribution-Justice Commences.
2024 Elections • 56 • : WeMustCare -
Candidate TRUMP Now Has Crazy Judge JUAN MERCHAN After Him - The Stormy Daniels Hush-Money Case.
Political Conspiracies • 743 • : WeMustCare -
British TV Presenter Refuses To Use Guest's Preferred Pronouns
Education and Media • 148 • : Consvoli -
VP's Secret Service agent brawls with other agents at Andrews
Mainstream News • 44 • : ByeByeAmericanPie -
New whistleblower Jason Sands speaks on Twitter Spaces last night.
Aliens and UFOs • 59 • : baablacksheep1 -
1980s Arcade
General Chit Chat • 27 • : alwaysbeenhere2 -
Skinwalker Ranch and the Mystery 1.6GHz Signal
Aliens and UFOs • 143 • : Ophiuchus1 -
"We're All Hamas" Heard at Columbia University Protests
Social Issues and Civil Unrest • 281 • : marg6043