It looks like you're using an Ad Blocker.
Please white-list or disable AboveTopSecret.com in your ad-blocking tool.
Thank you.
Some features of ATS will be disabled while you continue to use an ad-blocker.

Tax Cuts Are Destroying America
page: 1share:
Tax cuts for the rich and corporations do not help the economy, they hurt it, badly.
www.ibtimes.com...
graphics8.nytimes.com...
www.nytimes.com...
You'd figure everyone by now would realize that nothing trickles down. Just look at New Jersey.
Christ Christie gave millions of corporate tax breaks to create jobs,..and it FAILED. The corporations cut jobs, hoarded the wealth, and outsourced.
www.nytimes.com...
Cuts increase the economic gap between the rich and the poor. Romney and all the republicans need a new plan unless you are an advocate for feudalism.
A new study from the Congressional Research Service - a non-partisan government group that provides analysis to Congress - will likely fuel the already bitter political fight.The report concludes that tax cuts for the rich don't seem to be associated with economic growth and instead are linked to a different outcome: greater income inequality in the U.S.
www.ibtimes.com...
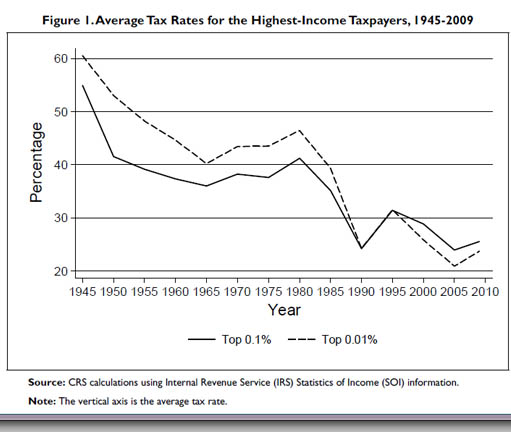
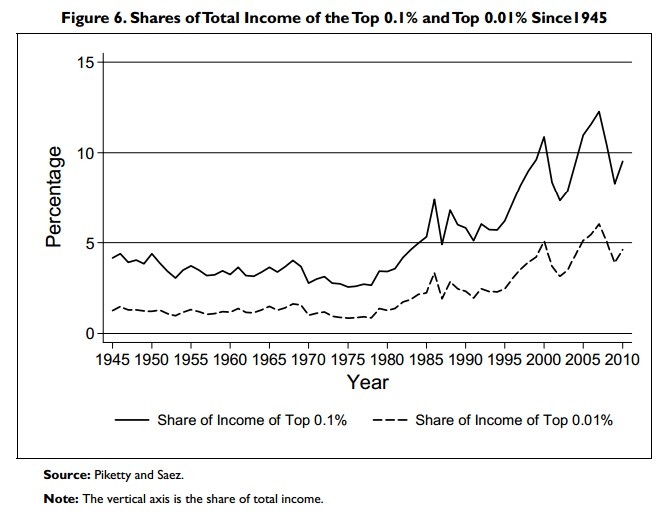
Here are two graphs of the top 0.1 percent and 0.01 percent. The first shows average tax rates for the highest-income taxpayers since 1945 has been dropping. The second graph shows that during the same period, the richest American families captured a greater and greater share of total income.
The top income tax rates have changed considerably since the end of World War II. Throughout the late-1940s and 1950s, the top marginal tax rate was typically above 90%; today it is 35%. Additionally, the top capital gains tax rate was 25% in the 1950s and 1960s, 35% in the 1970s; today it is 15%. The average tax rate faced by the top 0.01% of taxpayers was above 40% until the mid-1980s; today it is below 25%. Tax rates affecting taxpayers at the top of the income distribution are currently at their lowest levels since the end of the second World War.
The results of the analysis suggest that changes over the past 65 years in the top marginal tax rate and the top capital gains tax rate do not appear correlated with economic growth. The reduction in the top tax rates appears to be uncorrelated with saving, investment, and productivity growth. The top tax rates appear to have little or no relation to the size of the economic pie.
However, the top tax rate reductions appear to be associated with the increasing concentration of income at the top of the income distribution. As measured by IRS data, the share of income accruing to the top 0.1% of U.S. families increased from 4.2% in 1945 to 12.3% by 2007 before falling to 9.2% due to the 2007-2009 recession. At the same time, the average tax rate paid by the top 0.1% fell from over 50% in 1945 to about 25% in 2009. Tax policy could have a relation to how the economic pie is sliced—lower top tax rates may be associated with greater income disparities.
graphics8.nytimes.com...
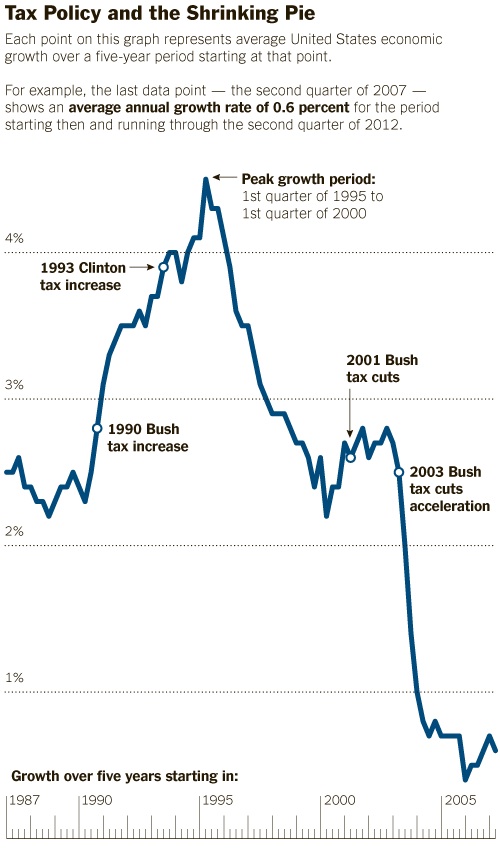
One of the first things you notice in the chart is that the American economy was not especially healthy even before the financial crisis began in late 2007. By 2007, remarkably, the economy was already on pace for its slowest decade of growth since World War II. The mediocre economic growth, in turn, brought mediocre job and income growth — and the crisis more than erased those gains.
www.nytimes.com...
You'd figure everyone by now would realize that nothing trickles down. Just look at New Jersey.
Christ Christie gave millions of corporate tax breaks to create jobs,..and it FAILED. The corporations cut jobs, hoarded the wealth, and outsourced.
Under the program, the Christie administration has granted more than $900 million in state tax credits over 10 years to 15 companies, including Panasonic, Goya, Prudential and Campbell’s Soup.
Another agreement has also stirred criticism. In February 2011, the state approved a $42 million tax break for Campbell’s Soup to renovate its longtime headquarters in Camden and add new jobs.
Campbell’s then announced in June that it would eliminate 130 jobs in Camden
www.nytimes.com...
Cuts increase the economic gap between the rich and the poor. Romney and all the republicans need a new plan unless you are an advocate for feudalism.
edit on 19-9-2012 by RealSpoke because: (no reason given)
reply to post by RealSpoke
Yes, economic growth for the wealthy who receive the most benefit from tax cuts.
Middle class people as a percentage don't get that much benefit because they still get hammered by sales tax, payroll tax, state taxes, property tax, etc. The middle class doesn't have fancy tax attorneys and accountants to help them avoid taxes.
The Rich are getting richer and the middle class is shrinking into poverty.
www.huffingtonpost.com...
rdwolff.com...
I wonder who President Romney's tax policy will favor?........
Do Tax Cuts Lead to Economic Growth?
Yes, economic growth for the wealthy who receive the most benefit from tax cuts.
Middle class people as a percentage don't get that much benefit because they still get hammered by sales tax, payroll tax, state taxes, property tax, etc. The middle class doesn't have fancy tax attorneys and accountants to help them avoid taxes.
The Rich are getting richer and the middle class is shrinking into poverty.
www.huffingtonpost.com...
rdwolff.com...
I wonder who President Romney's tax policy will favor?........
edit on 19-9-2012 by olaru12 because: (no reason given)
1. Tax "cuts" are simply new deductions, and if you don't qualify then there is no tax cut for you. In fact, you'll need to qualify to get the
money back, and should something happen during that period of government withholding, you'll not get it back.
2. Federal Income tax is money given directly to the fed to repay the money borrowed in your name, cutting the repayment only means they'll look to get their return on investment another way.
3. Tax cuts for are good for companies, but since companies have ZERO mandate to spend that money on anything but repaying investors, the tax cut has no effect whatsoever on joe and jane. Apple has billions in cash, billions in stock value, billions in assets, and is doing very little hiring and is not reducing the price of their products. So cutting their taxes will in no way induce them to spend on hiring or investment in people - it hasn't yet, but in fact, will add to the investor payout.
4. Tax cuts, will always be made up elsewhere. We pay: state tax, sales tax, gas tax, car tax, license fees for all manner of things, business tax, phone tax, internet tax, banking tax, SS tax, unemployment insurance tax, parking tax, luxury purchase tax, sin tax on booze and smokes, death tax, capital gains tax, travel tax, hotel tax - what have I left out? So "offering" a new deduction for SOME people does not alter ANY, not one, of those other taxes that are increased as often as possible.
5. The meme of tax cuts for the rich is beyond obscene. Poor people pay tax, it has always been this way and will always be this way, because people accept a version of economics that never includes the truth about fiat currency and the real truth about who owns the people who demand to be taxed fairly.
The king taxed the plebes, the government is just a king doing exactly the same thing, only now they have talking points to tell the plebes that the tax is for their own good. Lincoln started the Civil war to take back the south - the excuse was slaves, because the south refused to pay england the tax it was still paying. The north was paying, and was bust. People killed their own to pay the tax.
When the Capital Gains tax was reduced by Reagan/Congressional Dems, there was a lot of pent-up selling that took place. This activity actually
generated a lot of unexpected tax dollars as folks were "happy' to pay the lower tax rate and were willing to cash in their bonds/stocks (thus
paying Capital Gains tax).
The same thing happened when Kennedy lowered tax rates back in the 60's.
Certainly for taxes there has to be some type of balance between government spending and sucking people's money from their wallets.
Interestingly enough, most tax breaks are tilted toward the middle-class.
One last thing about "trickle down" - in the 90's the Democrats in Maryland instituted a 10% "luxery tax" on all yacht sales. As a result, yacht sales suffered signifcantly and many ordinary people suffered along with it; boat builders were laid off; yacht brokers went bust; and wealthier people simply weren't buying large boats/ships. And eventually these same Democrats figured out that the tax they'd enacted was wrong and they repealed the tax - at that point, things started going back to where they were before the tax was implemented - so yes, lowering taxes can indeed promote growth (sort of like in a "trickle down" manner).
reply to post by RealSpoke
Its not the "tax cuts" that are the problem
Its the g-damn SPENDING.
CUT spending. But they refuse. Because they can "borrow" from the Federal Reserve, they dont have to exercise any kind of fiscal responsibility unlike the rest of us.
But it will catch up to them. They cant keep rates at zero forever. Rates will rise and when they do, we will no longer be able to service the debt. Its not possible to keep borrowing and borrowing and borrowing without serious consequences. Europe being the best example and many of those countries had the highest tax rates in the world.
While it varies slightly from year to year, the majority of taxes are paid by the middle class and they are being destroyed, wiped out.
Between this never ending tax burden and devalued dollar, the average American is becoming more poor every day.
edit on 19-9-2012 by gladtobehere because: (no reason given)
reply to post by gladtobehere
Please read the OP. It has absolutely nothing to do with federal spending. This is about individual citizens and the private sector. This would happen regardless if inflation was taking place or not.
Please read the OP. It has absolutely nothing to do with federal spending. This is about individual citizens and the private sector. This would happen regardless if inflation was taking place or not.
edit on 19-9-2012 by RealSpoke because: (no reason given)
reply to post by RealSpoke
They are looking at these numbers in a bubble and saying that lower corporate taxes means lower growth. This is a flawed premise.
In fact, most of the harm to our economy is the result of the Federal Reserve's flawed centrally planned economic policies, the artificially low interest rates (which encourages mal-investment) and the resulting boom and busts cycles.
While tax rates were much higher 50 years ago, there were many more loop holes. People, the wealthy, the corporations paid much less in taxes.
The most money ever collected by the government (to date) was $2.56 trillion in 2007 despite the "tax cuts".
www.taxpolicycenter.org...
As a matter of fact, income taxes only account for 43% of all receipts.
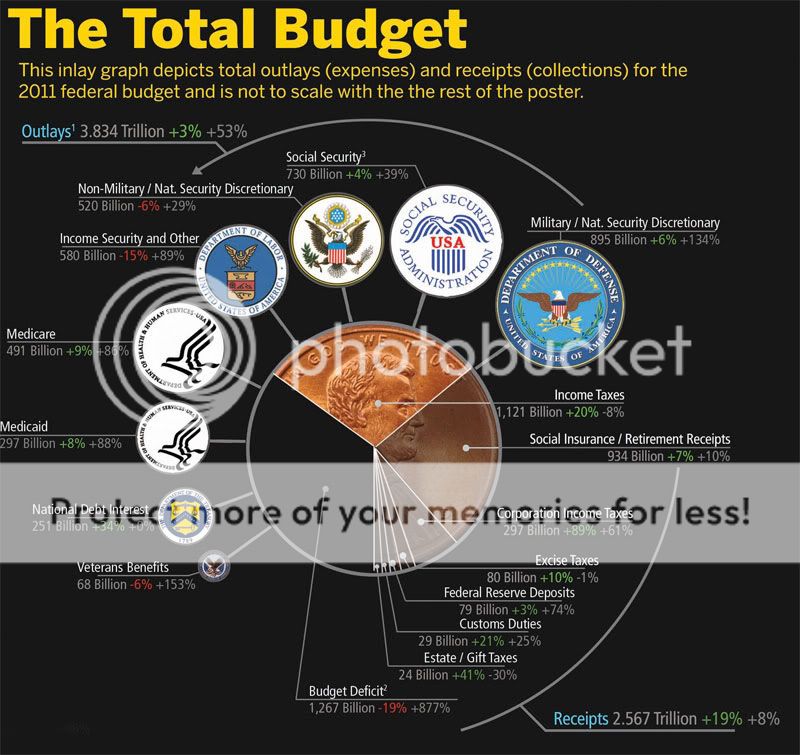
If the government would go back to 1996 spending levels, they could eliminate income taxes altogether. In 1996 the budget was $1.56 trillion. And in 1996, we had a huge military empire, big welfare state, hell there was even plenty of money for crony capitalism and pet projects.
Cut spending, get rid of the income tax, and get this domestic gestapo, the IRS, off our backs.
They are looking at these numbers in a bubble and saying that lower corporate taxes means lower growth. This is a flawed premise.
In fact, most of the harm to our economy is the result of the Federal Reserve's flawed centrally planned economic policies, the artificially low interest rates (which encourages mal-investment) and the resulting boom and busts cycles.
While tax rates were much higher 50 years ago, there were many more loop holes. People, the wealthy, the corporations paid much less in taxes.
The most money ever collected by the government (to date) was $2.56 trillion in 2007 despite the "tax cuts".
www.taxpolicycenter.org...
As a matter of fact, income taxes only account for 43% of all receipts.
If the government would go back to 1996 spending levels, they could eliminate income taxes altogether. In 1996 the budget was $1.56 trillion. And in 1996, we had a huge military empire, big welfare state, hell there was even plenty of money for crony capitalism and pet projects.
Cut spending, get rid of the income tax, and get this domestic gestapo, the IRS, off our backs.
edit on 19-9-2012 by gladtobehere because: (no reason given)
reply to post by gladtobehere
No it isn't. I gave New Jersey as an example. Chris Christie gave corporation tax cuts and they outsourced and got rid of jobs. It is possible it could grow, but that usually doesn't happen. Look at the state of our nation.
Rich people hoarding the wealth when they get cuts has nothing to do with the federal reserve.Of course the reserve causes inflation, but that has nothing to do with the study.
They are looking at these numbers in a bubble and saying that lower corporate taxes means lower growth. This is a flawed premise.
No it isn't. I gave New Jersey as an example. Chris Christie gave corporation tax cuts and they outsourced and got rid of jobs. It is possible it could grow, but that usually doesn't happen. Look at the state of our nation.
Rich people hoarding the wealth when they get cuts has nothing to do with the federal reserve.Of course the reserve causes inflation, but that has nothing to do with the study.
edit on 19-9-2012 by RealSpoke because: (no reason given)
reply to post by RealSpoke
Sure it does.
The last graph is comparing tax cuts to an "average annual growth rate". They are implying that as taxes went up, so did growth. When taxes went down, growth decreased.
They are looking at two criteria and making a correlation without taking into account any other factors.
Not even sure what they mean by "average annual growth rate". Between 2003 and 2007 (the graph ends there) the housing industry was booming. Not sure which criteria they are using to say that growth was down?
By 2008, the economy had collapsed. Not due to tax cuts but due to the housing bubble, created by the Fed.
Rest assured, theres another crash coming and its going to be MUCH worse. Not because of tax cuts but because of the endless borrowing, debt and currency devaluation.
Will the establishment place blame where it belongs? Never.

Dont take it from me. Take it from the handful of people who have been proven correct vs. the "so called experts" running our economy into the ground via flawed centrally planned economics.
It would be comical if it wasnt so dangerous to our way of life. Here is Ron Paul warning us of the coming bubbles as far back as 2001 vs Bernanke who not only caused the crash but couldnt even see it one-year-out...
vs
Sure it does.
The last graph is comparing tax cuts to an "average annual growth rate". They are implying that as taxes went up, so did growth. When taxes went down, growth decreased.
They are looking at two criteria and making a correlation without taking into account any other factors.
Not even sure what they mean by "average annual growth rate". Between 2003 and 2007 (the graph ends there) the housing industry was booming. Not sure which criteria they are using to say that growth was down?
By 2008, the economy had collapsed. Not due to tax cuts but due to the housing bubble, created by the Fed.
Rest assured, theres another crash coming and its going to be MUCH worse. Not because of tax cuts but because of the endless borrowing, debt and currency devaluation.
Will the establishment place blame where it belongs? Never.
Dont take it from me. Take it from the handful of people who have been proven correct vs. the "so called experts" running our economy into the ground via flawed centrally planned economics.
It would be comical if it wasnt so dangerous to our way of life. Here is Ron Paul warning us of the coming bubbles as far back as 2001 vs Bernanke who not only caused the crash but couldnt even see it one-year-out...
vs
edit on 20-9-2012 by gladtobehere because: (no reason given)
reply to post by gladtobehere
Peter Schiff is a wallstreet douche, he's not on your side unless you a millionaire. Listening to him is like taking advice from from the Koch Bros.
But anyways let's say you're right. This is the reality we live in, the fed isn't going anywhere, (lets just be realistic here).. Republicans like Romney are advocating to cut taxes for the rich, that will create an even FURTHER gap between the rich and middle class/poor. If continued we will only have two classes, the poor and rich...They do this on purpose, for their own gain. They convince their fan base to vote against their own interests.
But you really can't blame the fed for what happened in New Jersey and the whole country...multiple corporations got tax cuts and STILL outsourced and cut jobs. You're trying to put all the blame on the Fed when they have nothing to do with Cambel soup moving jobs to 3rd world countries so they can pay their workers .50 cents an hour. That is purely motivated for PROFIT. They are not interested in investing their profits into the USA. It is all about GREED.
edit on 20-9-2012 by RealSpoke because: (no reason given)
^ Gross and out of touch with reality.. He's like a free market Romney.
Trickle down crap. Immoral, poor theory and don't work when tested. LOL
Have a look at the national debt. This wealth Reagan and Thatcher promised came from kicking the poor and the working class in the head and thru borrowing money.
Can you create wealth by borrowing money? Not real wealth.
USA will find out when interest on U.S. debt is greater than its tax revenues.
money.cnn.com...
Here's a new way to think about the U.S. government's epic borrowing: More than half of the $9 trillion in debt that Uncle Sam is expected to build up over the next decade will be interest.
More than half. In fact, $4.8 trillion.
So how is that working for you?
Just understand that stock- /shareholders are parasites and you will understand why 'trickle down' can't work for long. Shareholders get their money from others work. And they get it only because they have money. Insane! And then these people say stuff like - "If you don't work you don't eat." Totally oblivious to their own corruption!!
Look into Feudalism and if you are okay with a gangster elite making it perfectly legal to steal from workers, a gangster elite so powerfull it becomes social norm, you should be okay with the 'trickle down' madness.
Great thread!
It would seem OBVIOUS that trickle down doesn't work and the GOP KNOWS it doesn't work! Like GWB said, they have become the party of the "haves" and the "have-mores". The more they have, the more they want. And Romney's plans to increase his own wealth, by using the presidency, has become CRYSTAL clear.
If there's one thing Romney knows how to do, it's make money and keep it for himself. He's an Ayn Rand wet dream!
I am most likely posting on the wrong thread right now, as I am dumb as a brick when it comes to economics....I didn't get half of what real spokes
charts were about, but I do think I grasp the basics of his point. If anything, call this mija's morning Econ class ATS style!
So, these tax cuts, and incentives we give to the wealthy.....in theory they are supposed to take that extra money and improve their companies with it, right? And when they improve their companies in theory, they put out better products, and in theory, once those better products are released, then consumers will buy more and they will post profits, and in theory have even more money so that they can take on X amount of new employees yes?
But isn't this just a theory? Isn't this just one option of many these CEOs could make? I mean how do we really know they will do this? Aren't there so many other variables to this whole thing?
What if, we give a company tax cuts, they take the extra money and instead of investing it in product improvement, they give out private jets to all the CEOs? Or they take the money to a financial firm to play the market for them and the financial firm sucks and they lose the companies money on wall street? Or what if the CEOs do invest in production improvement, but the improvement is a flop when it hits the consumers and they refuse to buy the new "improved" product? I mean......so many bad things can happen......and there is always the hope something good will come out of it and those 100 jobs will be created.....but that is a hope.....not a sure bet.
Seems to me that trickle down is dependent on a whole lot of "ifs". It could work in theory if all the right choices are made and things fall into place.......but in reality, it doesn't seem like it is working so well. All these big companies have got fat tax breaks, so where are they putting all that extra moolah?
reply to post by RealSpoke
How is Peter Schiff a "Wall Street douche"? He was one of the few against all of the banker/Wall St. bail outs... Meanwhile Fed cheerleaders like Krugman (whos supposed to be "on the side of the people") were telling us that we have to bail out Wall St. and the banks...
And of-course the connection is conveniently cut off. Too much truth I guess? Not toeing the establishment line?
Bush passed the first banker bailout and Obama passed the second two: TARP 2 and TARP 3.
So I would argue that Bush, Obama and many other establishment minions are the Wall Street "douches".
Again, the NJ example isnt a good one. "See see see, they got tax breaks and they still fired people!"
We dont know their plans (at-least I dont) prior to the tax breaks and incentives. Would more people have been fired? Would the companies have collapsed altogether like so many other corporations did during that period?
I'm against all income taxes but I would agree that if anyone gets taxed it should be those who earn more. Fact is the middle class pays most of the income taxes collected. This has to stop.
But the answer isnt more taxes. Government has to CUT spending. Its like theyre addicted.
However, with regards to businesses, we have to create an environment which makes it attractive to do business in the United States. Make it cheaper to do business here. Give them an incentive to keep jobs here without simply giving them money (or bailouts) that we dont have.
Its not like we dont have a domestic work force. Remember, "small businesses" are the the number one source of job creation in America. Lets make it easy for them to create more jobs.
edit on 20-9-2012 by gladtobehere because: (no reason given)
reply to post by RealSpoke
Anytime anyone endorses taking more of a persons money to give to a government body, I cringe.
Government should exist, barely. At our discretion.
Not as a bloated monolith, eagerly sucking every cent that we own.
Anytime anyone endorses taking more of a persons money to give to a government body, I cringe.
Government should exist, barely. At our discretion.
Not as a bloated monolith, eagerly sucking every cent that we own.
edit on 20-9-2012 by beezzer because: (no reason given)
reply to post by beezzer
Government destroys EVERY program it touches. They have LOST trillions of dollars let alone mismanaged and wasted. The below video is during a time when our budget was 1/3 of what it is now. One can only imagine the crimes being committed today.
Its crazy that there are people who want to give this giant monstrosity known as the Federal Government MORE of our money...
edit on 20-9-2012 by gladtobehere because: (no reason given)
Looking at it from a Corporations view i think the higher my Corporation is taxed the lower my profits and the dividends my stock holders receive.
Stock holders are your 401k's etc for retired people,not just rich people. The dividends they receive are spent in the economy which creates jobs. So
i have a choice when over taxed. I can outsource or i can lay people off. This is not a black and white issue. There are ALWAYS unintended
consequences to any path you choose. The unintended consequences are most often devastating.
new topics
-
Electrical tricks for saving money
Education and Media: 1 hours ago -
VP's Secret Service agent brawls with other agents at Andrews
Mainstream News: 2 hours ago -
Sunak spinning the sickness figures
Other Current Events: 3 hours ago -
Nearly 70% Of Americans Want Talks To End War In Ukraine
Political Issues: 3 hours ago -
Late Night with the Devil - a really good unusual modern horror film.
Movies: 5 hours ago -
Cats Used as Live Bait to Train Ferocious Pitbulls in Illegal NYC Dogfighting
Social Issues and Civil Unrest: 6 hours ago -
The Good News According to Jesus - Episode 1
Religion, Faith, And Theology: 8 hours ago -
HORRIBLE !! Russian Soldier Drinking Own Urine To Survive In Battle
World War Three: 10 hours ago
top topics
-
SETI chief says US has no evidence for alien technology. 'And we never have'
Aliens and UFOs: 17 hours ago, 8 flags -
Cats Used as Live Bait to Train Ferocious Pitbulls in Illegal NYC Dogfighting
Social Issues and Civil Unrest: 6 hours ago, 8 flags -
Florida man's trip overseas ends in shock over $143,000 T-Mobile phone bill
Social Issues and Civil Unrest: 13 hours ago, 8 flags -
VP's Secret Service agent brawls with other agents at Andrews
Mainstream News: 2 hours ago, 7 flags -
Former Labour minister Frank Field dies aged 81
People: 15 hours ago, 4 flags -
Bobiverse
Fantasy & Science Fiction: 13 hours ago, 3 flags -
HORRIBLE !! Russian Soldier Drinking Own Urine To Survive In Battle
World War Three: 10 hours ago, 3 flags -
Nearly 70% Of Americans Want Talks To End War In Ukraine
Political Issues: 3 hours ago, 3 flags -
Sunak spinning the sickness figures
Other Current Events: 3 hours ago, 3 flags -
Late Night with the Devil - a really good unusual modern horror film.
Movies: 5 hours ago, 2 flags
active topics
-
The Reality of the Laser
Military Projects • 45 • : 5thHead -
President BIDEN Vows to Make Americans Pay More Federal Taxes in 2025 - Political Suicide.
2024 Elections • 125 • : ImagoDei -
Cats Used as Live Bait to Train Ferocious Pitbulls in Illegal NYC Dogfighting
Social Issues and Civil Unrest • 13 • : Albone -
Spectrophilia - Women Who Have Had Affairs With Ghosts Say Spooks Are Better Lovers Than Real Men
Paranormal Studies • 31 • : charlyv -
HORRIBLE !! Russian Soldier Drinking Own Urine To Survive In Battle
World War Three • 29 • : doubledan717 -
-@TH3WH17ERABB17- -Q- ---TIME TO SHOW THE WORLD--- -Part- --44--
Dissecting Disinformation • 651 • : 777Vader -
VP's Secret Service agent brawls with other agents at Andrews
Mainstream News • 19 • : NoCorruptionAllowed -
VirginOfGrand says hello
Introductions • 5 • : burritocat -
SETI chief says US has no evidence for alien technology. 'And we never have'
Aliens and UFOs • 42 • : Boomer1947 -
NASA Researchers Discover a Parallel Universe That Runs Backwards through Time - Alongside Us
Space Exploration • 71 • : charlyv