It looks like you're using an Ad Blocker.
Please white-list or disable AboveTopSecret.com in your ad-blocking tool.
Thank you.
Some features of ATS will be disabled while you continue to use an ad-blocker.

Evidence of Vote Flipping in GOP Primary Elections
page: 1share:
Vote flipping: fraudulent transfer of votes from one candidate to another, leaving the overall vote count unchanged
First: I did not author this document and can not vouch for it's credibility. I'm bringing it to ATS, as we have many sharp minds who can likely verify or debunk it.
(Sorry for the scrolling pictures)
When tabulating the results of a ballot, at County or State level, the precincts are usually tallied by alphabetical order. Typically, the higher the percentage of the ballots you have counted, the closer the partial-count result of each candidate gets to his final, all-ballots-counted result.
Graphically, If we take the 2012 New Hampshire Republican Primary, we obtain this:
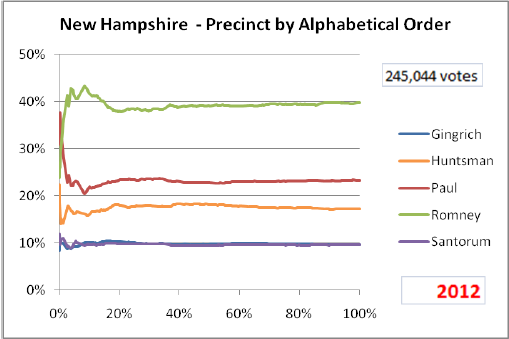
As can be seen, by the time you have counted 40% of all the ballots, the line goes flat: you have a reliable predictor of the candidate's final result. All poll science is based on this sort of predictability. There is a zero correlation between the alphabetical order of the precinct and the cumulative result of the candidate.
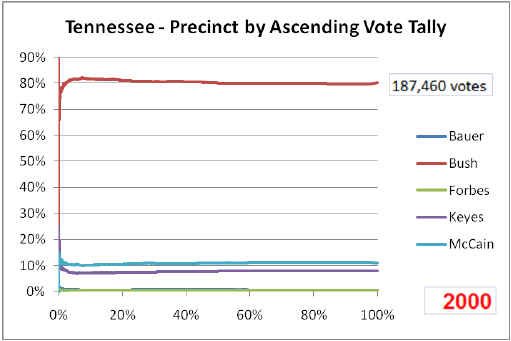
Now let's order the precincts by number of votes cast and let's start counting from the smallest all the way to the largest. Start with the Republican Primary in Tennessee, 2000.
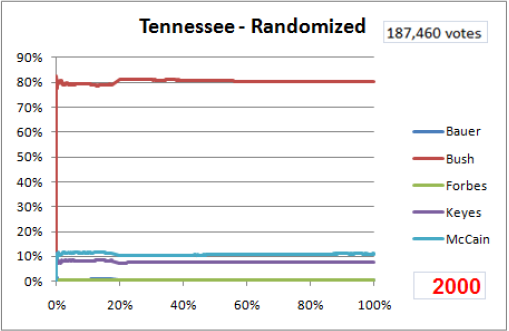
Zero correlation. Basically, if you sort the precincts randomly, you end up with the same chart:
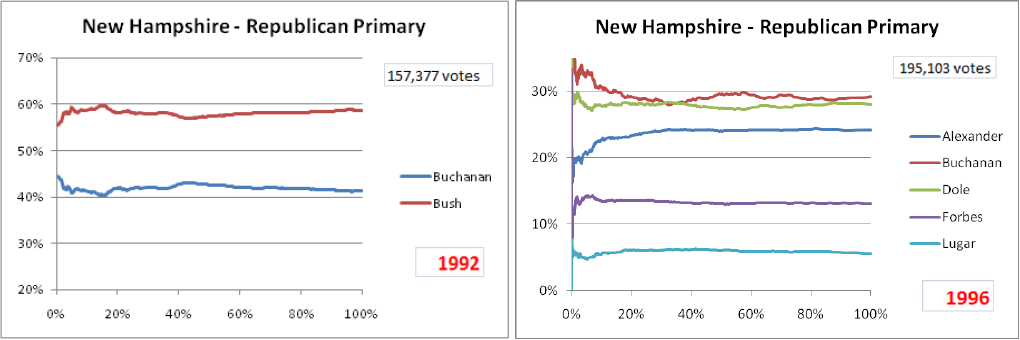
Below are shown more historical examples, both at state and county level. All sorted by Precinct Vote Tally.
Scroll to Right to View Image
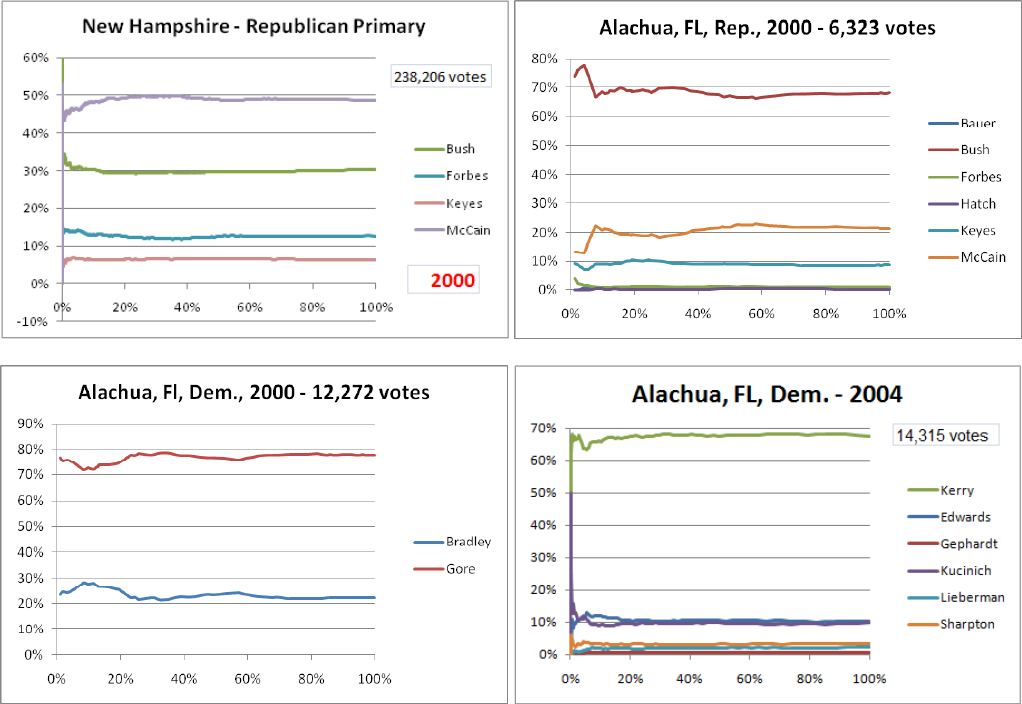
Scroll to Right to View Image
In all charts, for all candidates, there is a flat line rapidly developing, which translate into a zero correlation between their partial-count results and the precincts ordered by vote tally.
Then, in 2012, it was noticed that something EXTRAORDINARY happens:
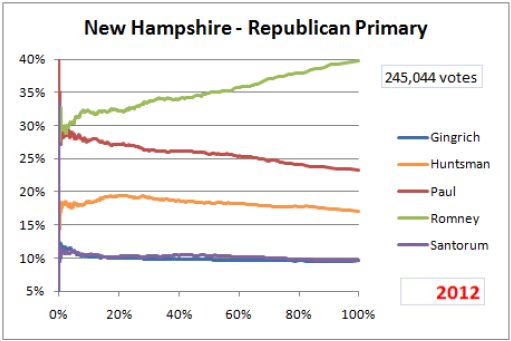
The correlation with the precinct vote tally goes from NONE to 99%.
In the chart above you can notice that this anomaly affects Romney positively, Paul and Huntsman negatively, but leaves Gingrich and Santorum entirely untouched.
-------------------------------------------------------
Please view the document for more information and to draw your conclusions based on the data.
I'm anxious to hear how ATS members receive this.
Research and Source Information for the document:
(bolded for emphasis)
(bolded for emphasis)
The research is based so far on Republican primaries in Iowa 2012, Nevada 2012, New Hampshire 2012, 2008, 2000, 1996, 1992, South Carolina 2012, 2008, Maine 2012, Arizona 2012 (partial), Florida 2012, 2008, 2004, 2000 (partial), Tennessee 2000, Alabama 2012 (partial), Ohio 2012 (partial), Oklahoma 2012, Puerto Rico 2012, Vermont 2012.
Verification and quantification by PhD-level mathematicians is urgently required.
Data Sources: Alabama results.enr.clarityelections.com... Arizona results.enr.clarityelections.com... Iowa www.filedropper.com... Maine www.filedropper.com... Nevada www.filedropper.com... New Hampshire www.sos.nh.gov... www.sos.nh.gov... Ohio where available, data sourced from each County's Board of Elections web site, for instance: Franklin vote.franklincountyohio.gov... Hamilton www.hamilton-co.org... Oklahoma www.ok.gov... Puerto Rico 64.185.222.182... South Carolina www.enr-scvotes.org... www.scvotes.org... Tennessee www.tn.gov... Vermont www.sec.state.vt.us... Alachua, FL elections.alachua.fl.us... Miami-Dade, FL www.miamidade.gov... Palm Beach, FL www.pbcelections.org... Tampa, FL votehillsborough.org... All
edit on 5/22/2012 by freakjive
because: (no reason given)
The way that the numbers correlate between Romney and Paul, but for the most part the other candidates seem unaffected, is the smoking gun here. It
seems during preliminary counts when the GOP saw that Paul was in the lead, or had a chance, they stole his votes and awarded them to Romney. I cannot
think of another logical explanation for what we are seeing here..
This is blatant fraud, and while I doubt anything will ever come of it (See G. Bush 2000/2004) people need to know their GOP candidate is a liar and a thief.
Thanks very much for posting this!
People - this is an important thread, pleeease try to get it on the front page by flagging and responding. Everyone needs to see this. Post the analysis on your FB, Twitter, ATS, MS Live status, whatever..
Explanation: S&F!
Personal Disclosure: Just at a glance that last chart in the OP is BOGUS! My dad worked as HEAD of IT dept for Australian Bereau of Statistics and I am completely sure he would agree with me!
Bumping this thread for JUSTICE [who is blind and needs to loose the blindfold ok] !!!
Personal Disclosure: Just at a glance that last chart in the OP is BOGUS! My dad worked as HEAD of IT dept for Australian Bereau of Statistics and I am completely sure he would agree with me!
Bumping this thread for JUSTICE [who is blind and needs to loose the blindfold ok] !!!
One of these days I'm going to go into politics and I'm going to turn those dogs on each other, practically have them at each others' throats, and
bring their whole system crashing down with sheer logic.
Extraordinary find FJ! I think this is a good representation of what happened for sure... As time goes on, the apparent popular vote of Romney
actually goes up instead of reaching a "predictive" asymptote...
Well we all know that isn't true of course
I need to analyze this closer, mathematically, but of course it looks reasonable to what we have all been assuming this far...
About 7 hours since ou posted this, no anti-Paul bots have even attempted debunking this one, a sign perhaps??
Muahahahaha
Well we all know that isn't true of course
I need to analyze this closer, mathematically, but of course it looks reasonable to what we have all been assuming this far...
About 7 hours since ou posted this, no anti-Paul bots have even attempted debunking this one, a sign perhaps??
Muahahahaha
This has actually been discussed in the past. The "analysis" began with the South Carolina primary. I use quote around analysis because it ignores
almost all the rules required for a statistical analysis. I've outlined a large number of criticisms in another thread. I even provided my own
analysis using the methodology used in this report. I'll see if I can dig it up.
ETA: Here it is. As I said this analysis initially came about in regards to the South Carolina primary. The methodology hasn't changed since that time so all of my criticisms are still pertinent to this larger analysis.
ETA: Here it is. As I said this analysis initially came about in regards to the South Carolina primary. The methodology hasn't changed since that time so all of my criticisms are still pertinent to this larger analysis.
edit on
5/22/2012 by Xcalibur254 because: (no reason given)
There have been multiple threads on this
www.abovetopsecret.com...
www.abovetopsecret.com...
www.abovetopsecret.com...
www.abovetopsecret.com...
www.abovetopsecret.com...
www.abovetopsecret.com...
Originally posted by OutKast Searcher
There have been multiple threads on this
www.abovetopsecret.com...
www.abovetopsecret.com...
www.abovetopsecret.com...
Thanks for the info. It appears those are citing the SC statistical information.
Oddly enough, I haven't been to the threads before.
This includes the full gamut of information that they have collected so far.
Either way, it's important information to share and it needs to be analyzed by sharp minds to verify the authenticity of the data. I'm very interested to hear if anyone finds any issues with the calculations and/or data.
Do you have any comments, OS? I would think this is good news for you. You're a Dem., right? Doesn't this kind of info on the GOP just make you super excited?
Or, does it scare you because Ron Paul actually scares you.
Are you afraid Ron Paul will beat Obama if given the chance?
I've been reading charts since Grade School and those charts look so entirely messed up / manipulated it is not even funny. If accurate there would
seem to be little question that some vote flipping really did occur.
Looking forward to the avalanche of replies this thread will get. Should be a great read!
Thanks for posting.
Looking forward to the avalanche of replies this thread will get. Should be a great read!
Thanks for posting.
reply to post by freakjive
I missed one of those, it is odd how those threads went somewhat unnoticed. Probably because they got dropped to BTS...
I missed one of those, it is odd how those threads went somewhat unnoticed. Probably because they got dropped to BTS...
reply to post by freakjive
The criticisms regarding the analysis of the SC is pertinent to the entire data as the methodology has not changed. Anybody who has taken even an introductory statistics course should be able to point out the egregious errors in this "analysis."
The criticisms regarding the analysis of the SC is pertinent to the entire data as the methodology has not changed. Anybody who has taken even an introductory statistics course should be able to point out the egregious errors in this "analysis."
Originally posted by Xcalibur254
reply to post by freakjive
Anybody who has taken even an introductory statistics course should be able to point out the egregious errors in this "analysis."
Have you taken an introductory statistics course? Can you help me see the egregious errors?
That's what I asked for in the OP.
reply to post by freakjive
The first link goes to the Daily Paul and that links to these same documents you have linked.
And it's really not important information because it is some of the worst mathmatical analysis I have seen. The author of the documents makes some really really bad assumptions to start off with and that kills the rest of his document. I'm sure you have heard the phrase "you can make statistics say anything"...this is a good example of this.
The author makes many very bad assumptions...but the worst is that he starts counting votes in the smallest precincts, get's a percentage, and assumes the candidate should get the same percentage state wide. The problem is...everyone knows that Romney does better in urban areas.
Me and Xcaliber talked with the author in another thread...his only response to this was "why does Romney do better in large precincts"...his answer to that was because the GOP only cheats in the large precincts
If you reverse the authors logic and start in the large precincts, it will look like Ron Paul stole votes from Romney in the small precincts.
Faulty math and very poor analysis is never good news for anyone...regardless of political leanings. I would love Ron Paul to get the nomination...it is currently the easiest path for Obama to win re-election.
Thanks for the info. It appears those are citing the SC statistical information.
Oddly enough, I haven't been to the threads before.
This includes the full gamut of information that they have collected so far.
Either way, it's important information to share and it needs to be analyzed by sharp minds to verify the authenticity of the data. I'm very interested to hear if anyone finds any issues with the calculations and/or data.
Do you have any comments, OS? I would think this is good news for you. You're a Dem., right? Doesn't this kind of info on the GOP just make you super excited?
Or, does it scare you because Ron Paul actually scares you.
Are you afraid Ron Paul will beat Obama if given the chance?
The first link goes to the Daily Paul and that links to these same documents you have linked.
And it's really not important information because it is some of the worst mathmatical analysis I have seen. The author of the documents makes some really really bad assumptions to start off with and that kills the rest of his document. I'm sure you have heard the phrase "you can make statistics say anything"...this is a good example of this.
The author makes many very bad assumptions...but the worst is that he starts counting votes in the smallest precincts, get's a percentage, and assumes the candidate should get the same percentage state wide. The problem is...everyone knows that Romney does better in urban areas.
Me and Xcaliber talked with the author in another thread...his only response to this was "why does Romney do better in large precincts"...his answer to that was because the GOP only cheats in the large precincts
If you reverse the authors logic and start in the large precincts, it will look like Ron Paul stole votes from Romney in the small precincts.
Faulty math and very poor analysis is never good news for anyone...regardless of political leanings. I would love Ron Paul to get the nomination...it is currently the easiest path for Obama to win re-election.
reply to post by freakjive
As I said in my first post, all of my criticisms are contained in the link I posted. I have provided you with the information you are seeking. If you don't want to read through it that is your fault.
As I said in my first post, all of my criticisms are contained in the link I posted. I have provided you with the information you are seeking. If you don't want to read through it that is your fault.
Originally posted by freakjive
Originally posted by Xcalibur254
reply to post by freakjive
Anybody who has taken even an introductory statistics course should be able to point out the egregious errors in this "analysis."
Have you taken an introductory statistics course? Can you help me see the egregious errors?
That's what I asked for in the OP.
This is from the article...and it is the false assumption the author makes and the basis for his entire analysis.
If we assume that precinct size has no material correlation with partial count results,
reply to post by freakjive
bump
this is my sorta evidence
so simple anyone can see whats going on,
info graphics are great to expose misconduct
xploder
ps star and flag
bump
this is my sorta evidence
so simple anyone can see whats going on,
info graphics are great to expose misconduct
xploder
ps star and flag
reply to post by freakjive
That chart is a smoking gun...
Folks don't listen to a thing the shills have to say about this.
They too can see how obvious this is, and it scares them.
That chart is a smoking gun...
Folks don't listen to a thing the shills have to say about this.
They too can see how obvious this is, and it scares them.
edit on 22-5-2012 by ChaoticOrder because: (no reason given)
reply to post by ChaoticOrder
Yes...if you don't know a thing about mathematics and you are easily swayed by pretty colors and graphs.
You can use statistics to prove anything when you start with incorrect assumptions. And this is entirely based off the assumption that the percentage a candidate wins in small precincts are the percentages they should get State wide....which is just ridiculously false.
That chart is a smoking gun...
Yes...if you don't know a thing about mathematics and you are easily swayed by pretty colors and graphs.
You can use statistics to prove anything when you start with incorrect assumptions. And this is entirely based off the assumption that the percentage a candidate wins in small precincts are the percentages they should get State wide....which is just ridiculously false.
new topics
-
God's Righteousness is Greater than Our Wrath
Religion, Faith, And Theology: 1 hours ago -
Electrical tricks for saving money
Education and Media: 4 hours ago -
VP's Secret Service agent brawls with other agents at Andrews
Mainstream News: 5 hours ago -
Sunak spinning the sickness figures
Other Current Events: 6 hours ago -
Nearly 70% Of Americans Want Talks To End War In Ukraine
Political Issues: 6 hours ago -
Late Night with the Devil - a really good unusual modern horror film.
Movies: 8 hours ago -
Cats Used as Live Bait to Train Ferocious Pitbulls in Illegal NYC Dogfighting
Social Issues and Civil Unrest: 9 hours ago -
The Good News According to Jesus - Episode 1
Religion, Faith, And Theology: 11 hours ago
top topics
-
Florida man's trip overseas ends in shock over $143,000 T-Mobile phone bill
Social Issues and Civil Unrest: 16 hours ago, 8 flags -
Cats Used as Live Bait to Train Ferocious Pitbulls in Illegal NYC Dogfighting
Social Issues and Civil Unrest: 9 hours ago, 8 flags -
VP's Secret Service agent brawls with other agents at Andrews
Mainstream News: 5 hours ago, 8 flags -
Bobiverse
Fantasy & Science Fiction: 16 hours ago, 3 flags -
HORRIBLE !! Russian Soldier Drinking Own Urine To Survive In Battle
World War Three: 13 hours ago, 3 flags -
Electrical tricks for saving money
Education and Media: 4 hours ago, 3 flags -
Nearly 70% Of Americans Want Talks To End War In Ukraine
Political Issues: 6 hours ago, 3 flags -
Sunak spinning the sickness figures
Other Current Events: 6 hours ago, 3 flags -
Late Night with the Devil - a really good unusual modern horror film.
Movies: 8 hours ago, 2 flags -
The Good News According to Jesus - Episode 1
Religion, Faith, And Theology: 11 hours ago, 1 flags
active topics
-
Cats Used as Live Bait to Train Ferocious Pitbulls in Illegal NYC Dogfighting
Social Issues and Civil Unrest • 19 • : WeMustCare -
VP's Secret Service agent brawls with other agents at Andrews
Mainstream News • 38 • : SchrodingersRat -
New whistleblower Jason Sands speaks on Twitter Spaces last night.
Aliens and UFOs • 54 • : Ophiuchus1 -
DONALD J. TRUMP - 2024 Candidate for President - His Communications to Americans and the World.
2024 Elections • 514 • : WeMustCare -
The Acronym Game .. Pt.3
General Chit Chat • 7744 • : bally001 -
Truth Social goes public, be careful not to lose your money
Mainstream News • 128 • : Astyanax -
Sunak spinning the sickness figures
Other Current Events • 5 • : glen200376 -
SETI chief says US has no evidence for alien technology. 'And we never have'
Aliens and UFOs • 44 • : MikeDeGrasseTyson -
HORRIBLE !! Russian Soldier Drinking Own Urine To Survive In Battle
World War Three • 31 • : budzprime69 -
How ageing is" immune deficiency"
Medical Issues & Conspiracies • 33 • : rickymouse